視覺化穀物產量

R 函式撰寫入門

Richie Cotton

Data Evangelist at DataCamp

corn 資料集

glimpse(corn)
Observations: 6,381
Variables: 6
$ year                   <int> 1866, 1866, 1866, 1866, 1866, 1866...
$ state                  <chr> "Alabama", "Arkansas", "California...
$ farmed_area_acres      <dbl> 1050000, 280000, 42000, 57000, 200...
$ yield_bushels_per_acre <dbl> 9.0, 18.0, 28.0, 34.0, 23.0, 9.0, ...
$ farmed_area_ha         <dbl> 424919.92, 113311.98, 16996.80, 23...
$ yield_kg_per_ha        <dbl> 79.29892, 158.59784, 246.70776, 29...
R 函式撰寫入門

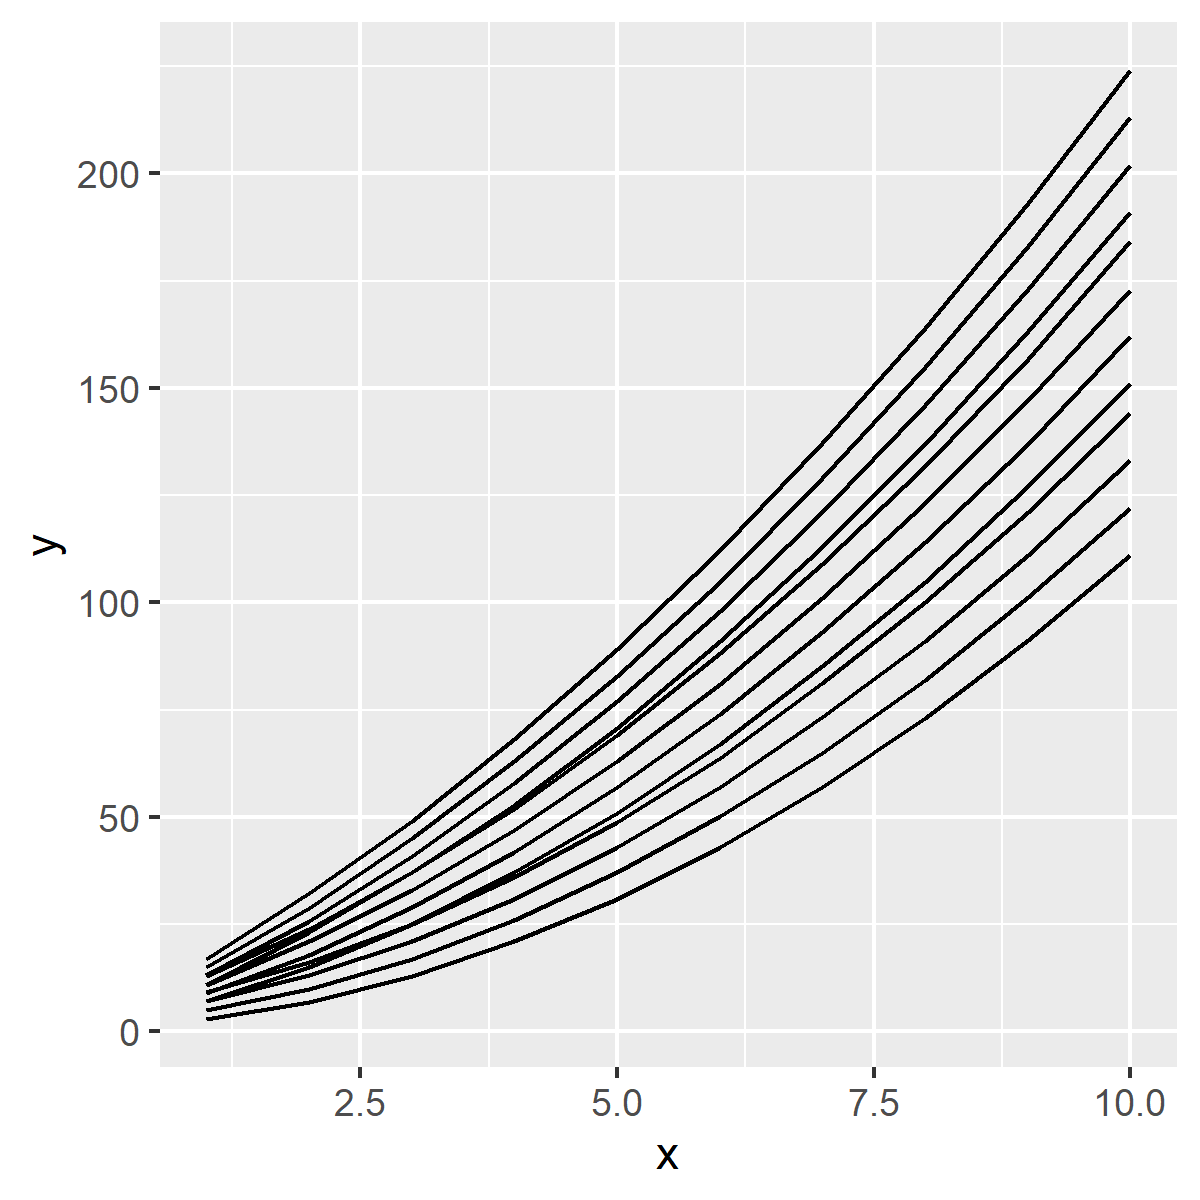
ggplot2:繪製多條線

ggplot(dataset, aes(x, y)) +
  geom_line(aes(group = group))

折線圖含多條線。資料為示意,重點是線條依資料框的 group 欄分組。

R 函式撰寫入門

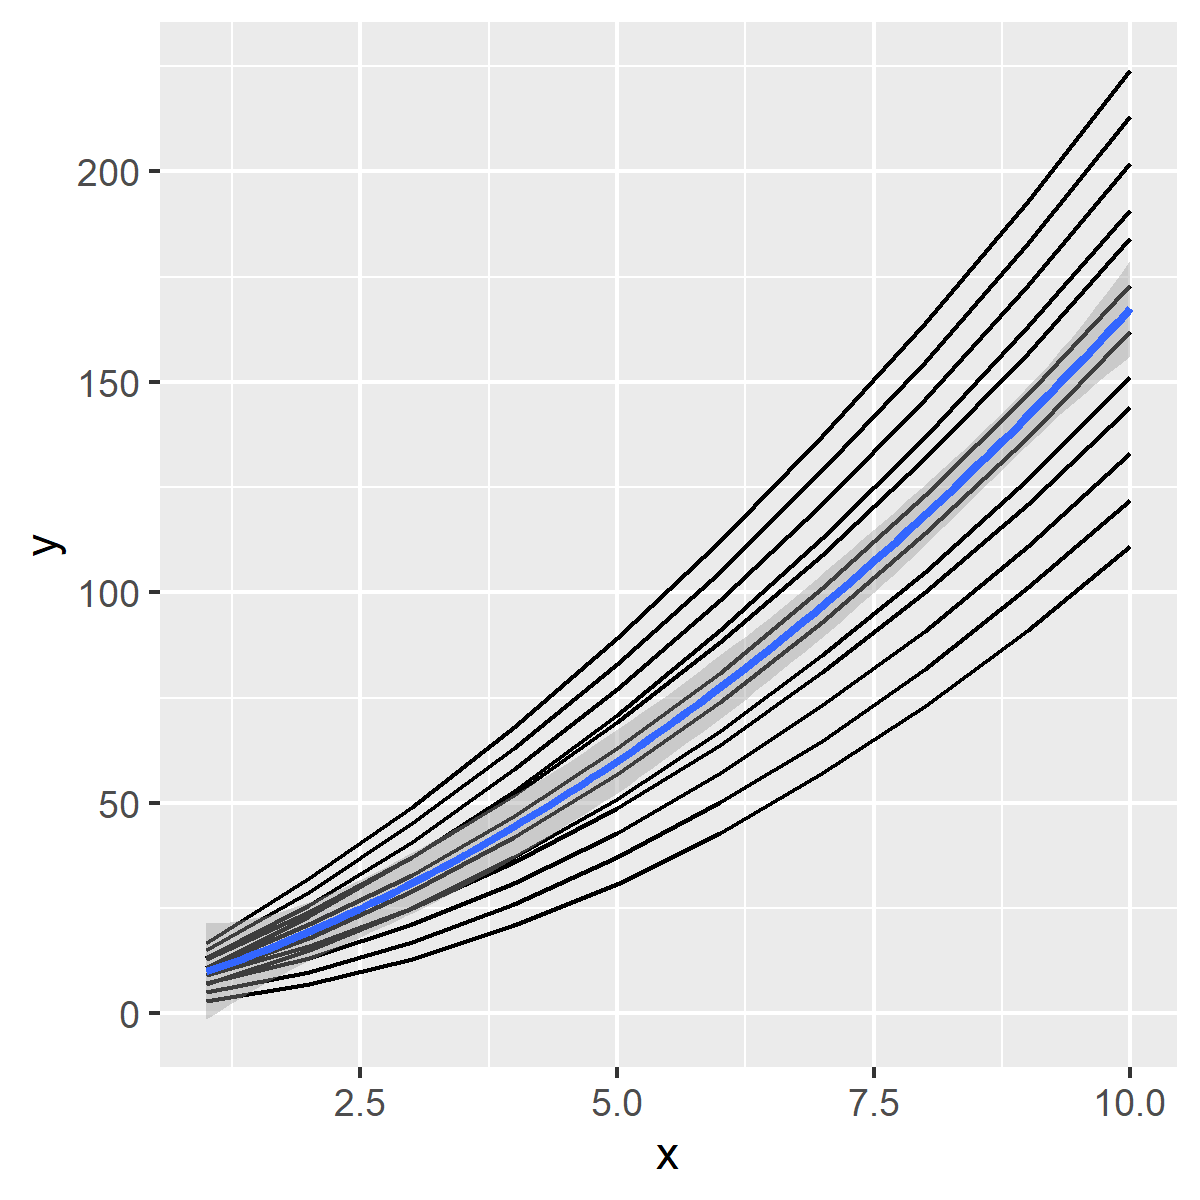
ggplot2:平滑趨勢

ggplot(dataset, aes(x, y)) +
  geom_line(aes(group = group)) +
  geom_smooth()

與前一張相同的折線圖,但多了一條平滑趨勢線。該線未分組,因為分組設在 line 幾何層,而非整個圖。很巧妙吧?

R 函式撰寫入門

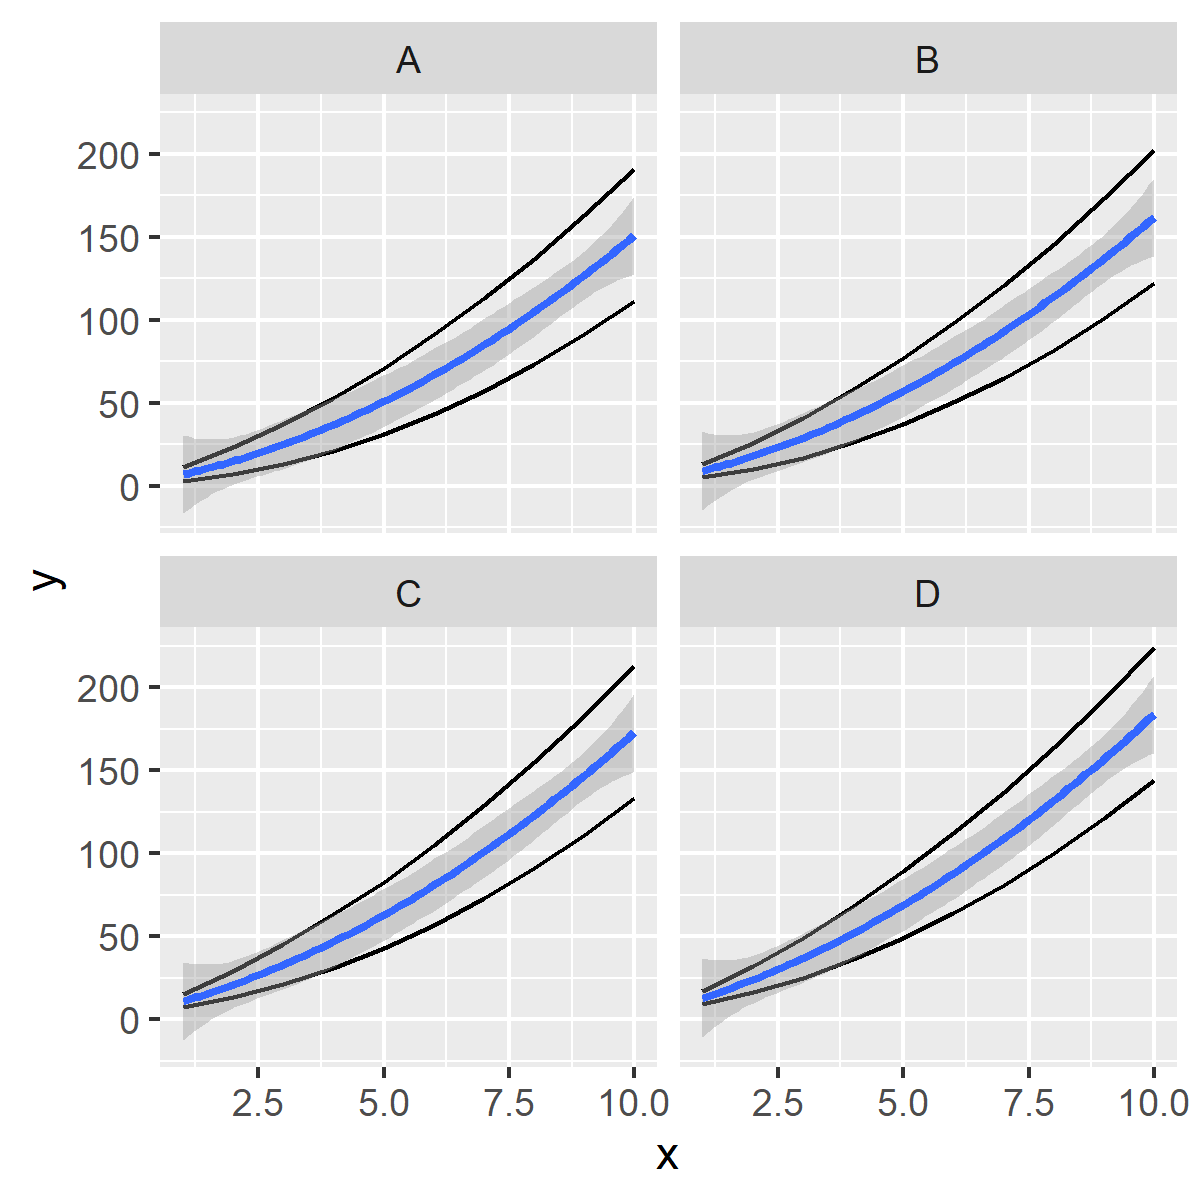
ggplot2:分面

ggplot(dataset, aes(x, y)) +
  geom_line(aes(group = group)) +
  geom_smooth() +
  facet_wrap(vars(facet))

與上次相同,但現在用 facet_wrap 分成 A 到 D 四個小圖。

R 函式撰寫入門

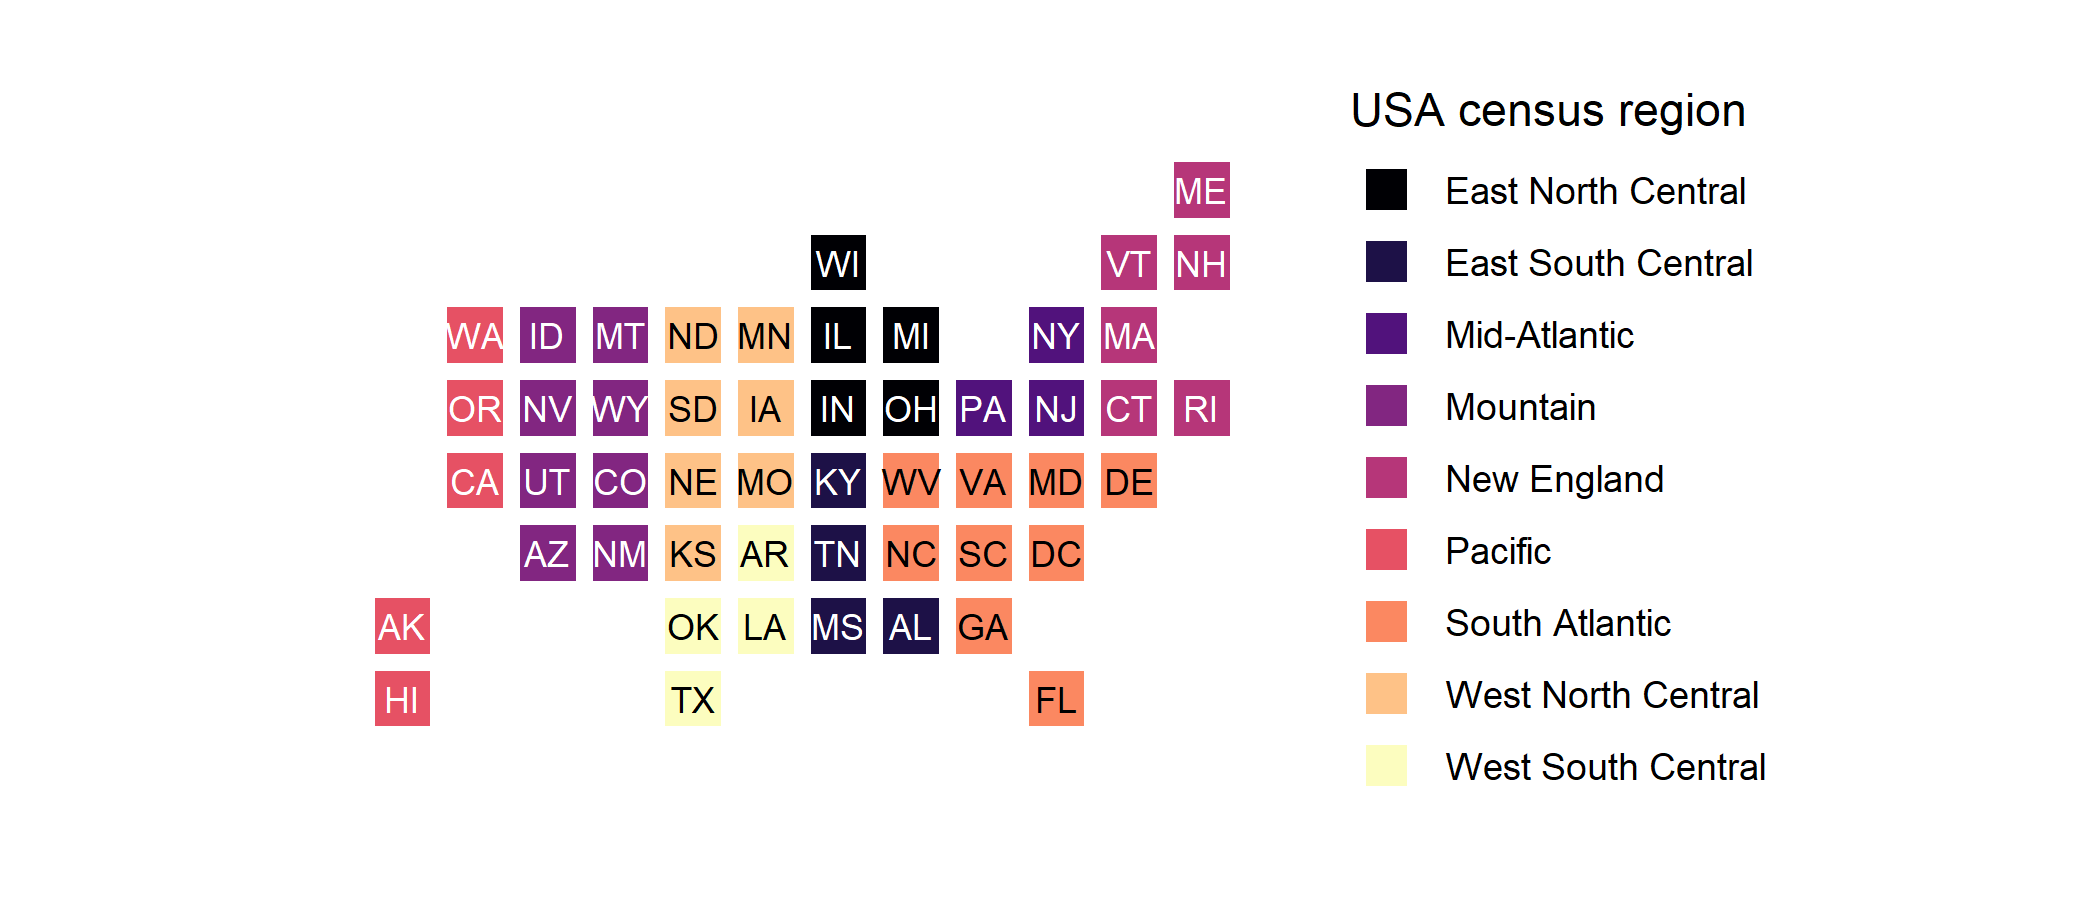
美國普查區域

這是 statebin 圖:每個美國州以方格表示,依列與行排成近似美國形狀。各普查區域以不同顏色標示。

R 函式撰寫入門

dplyr:inner join

dataset1 %>%
  inner_join(dataset2, by = "column_to_join_on")
R 函式撰寫入門

一起來練習吧!

R 函式撰寫入門

Preparing Video For Download...