迴歸

使用 PySpark 的機器學習

Andrew Collier

Data Scientist, Fathom Data

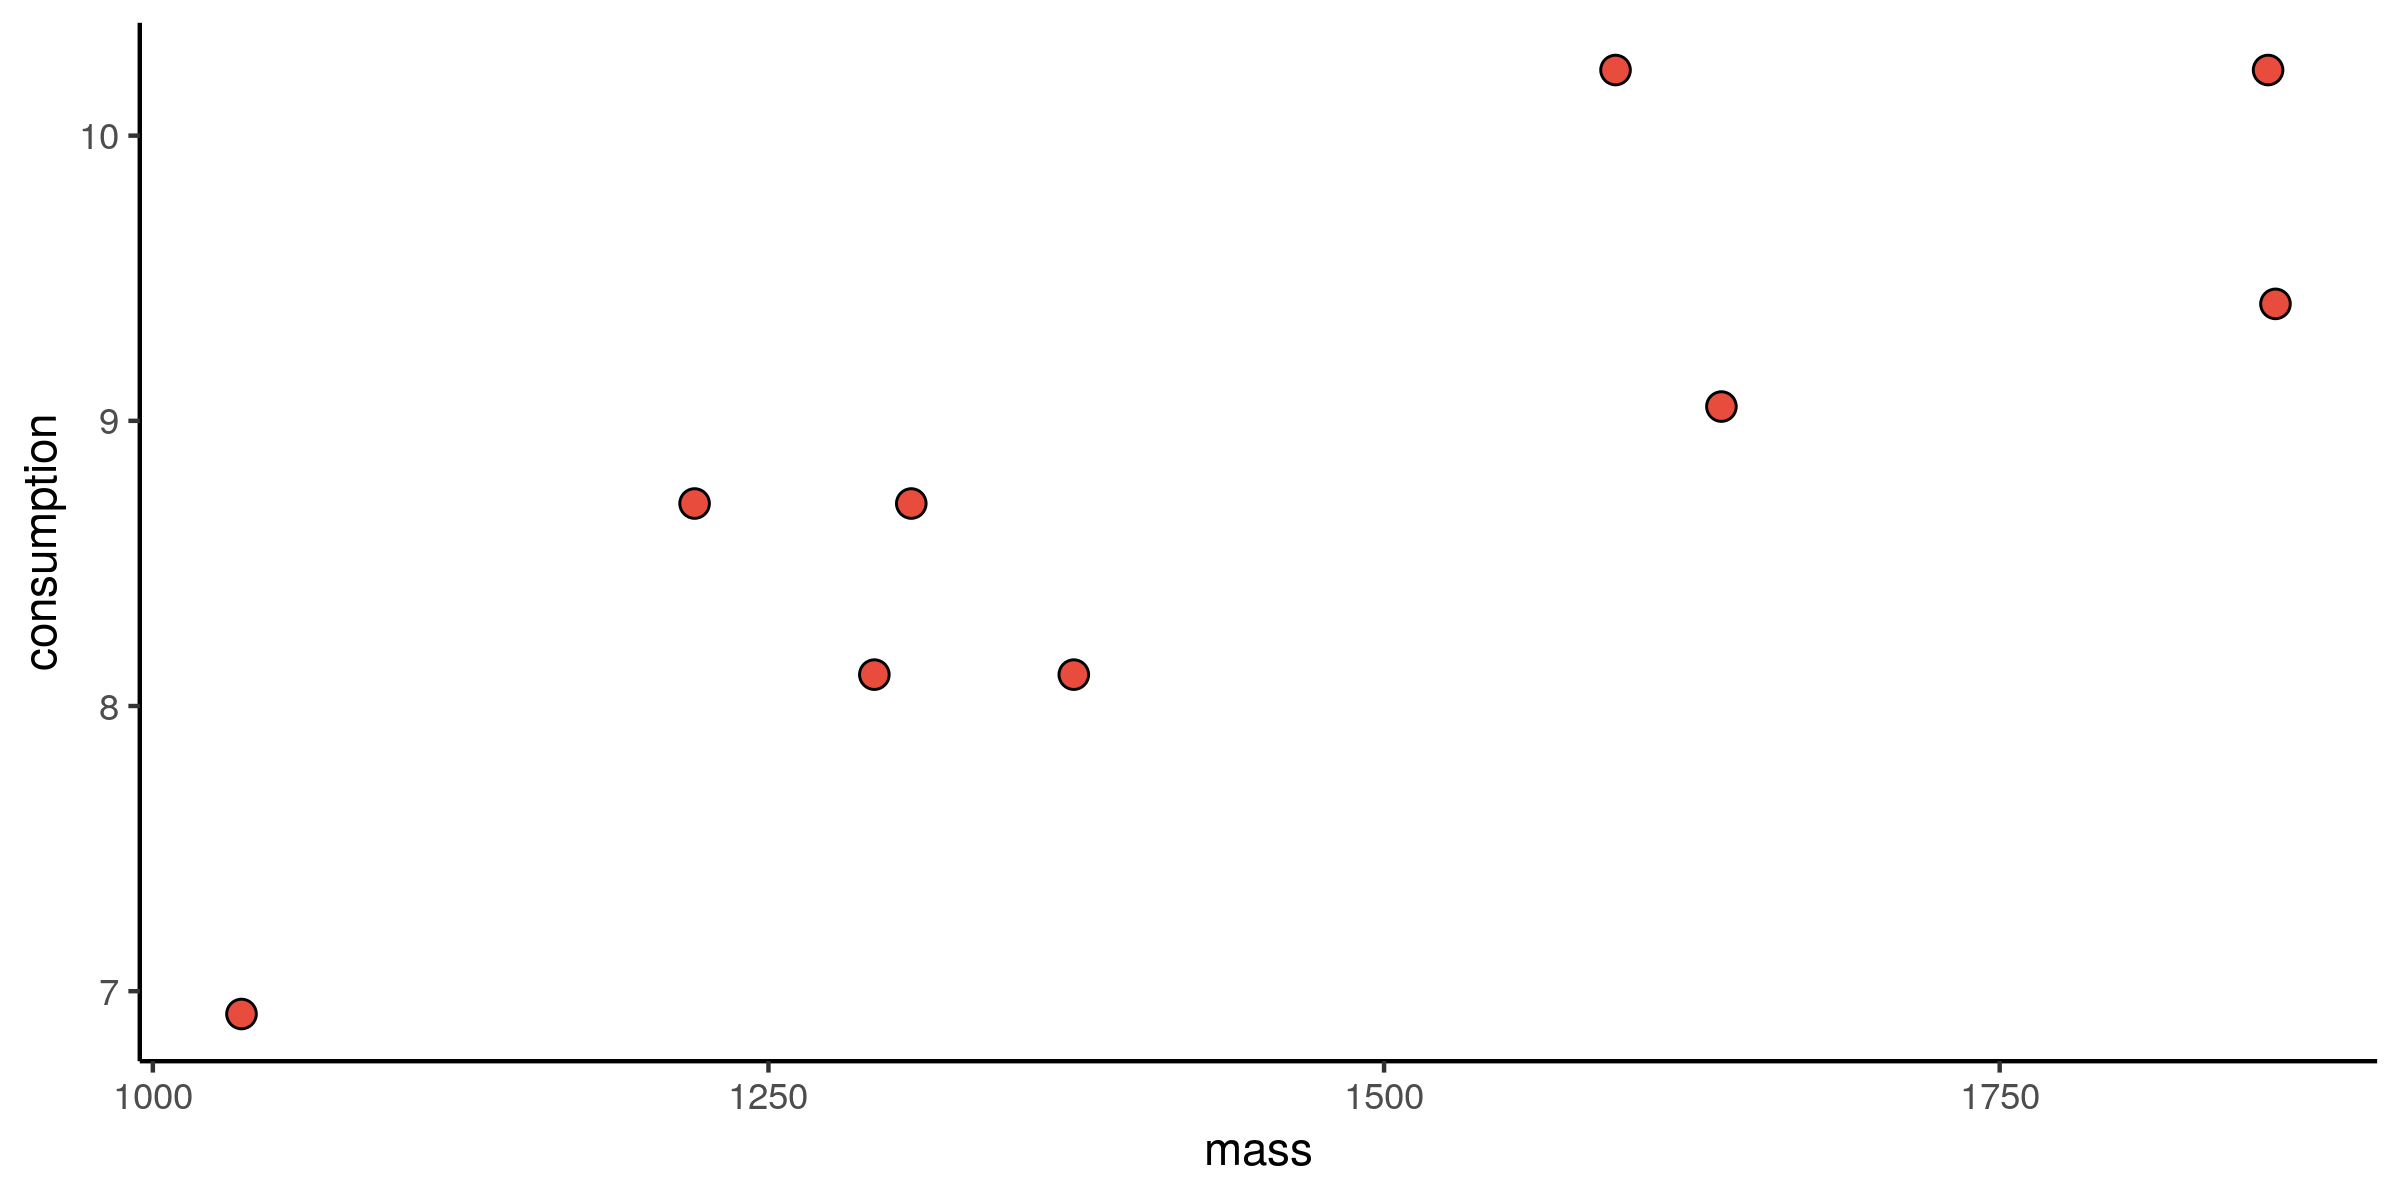
消耗 vs 質量:散佈

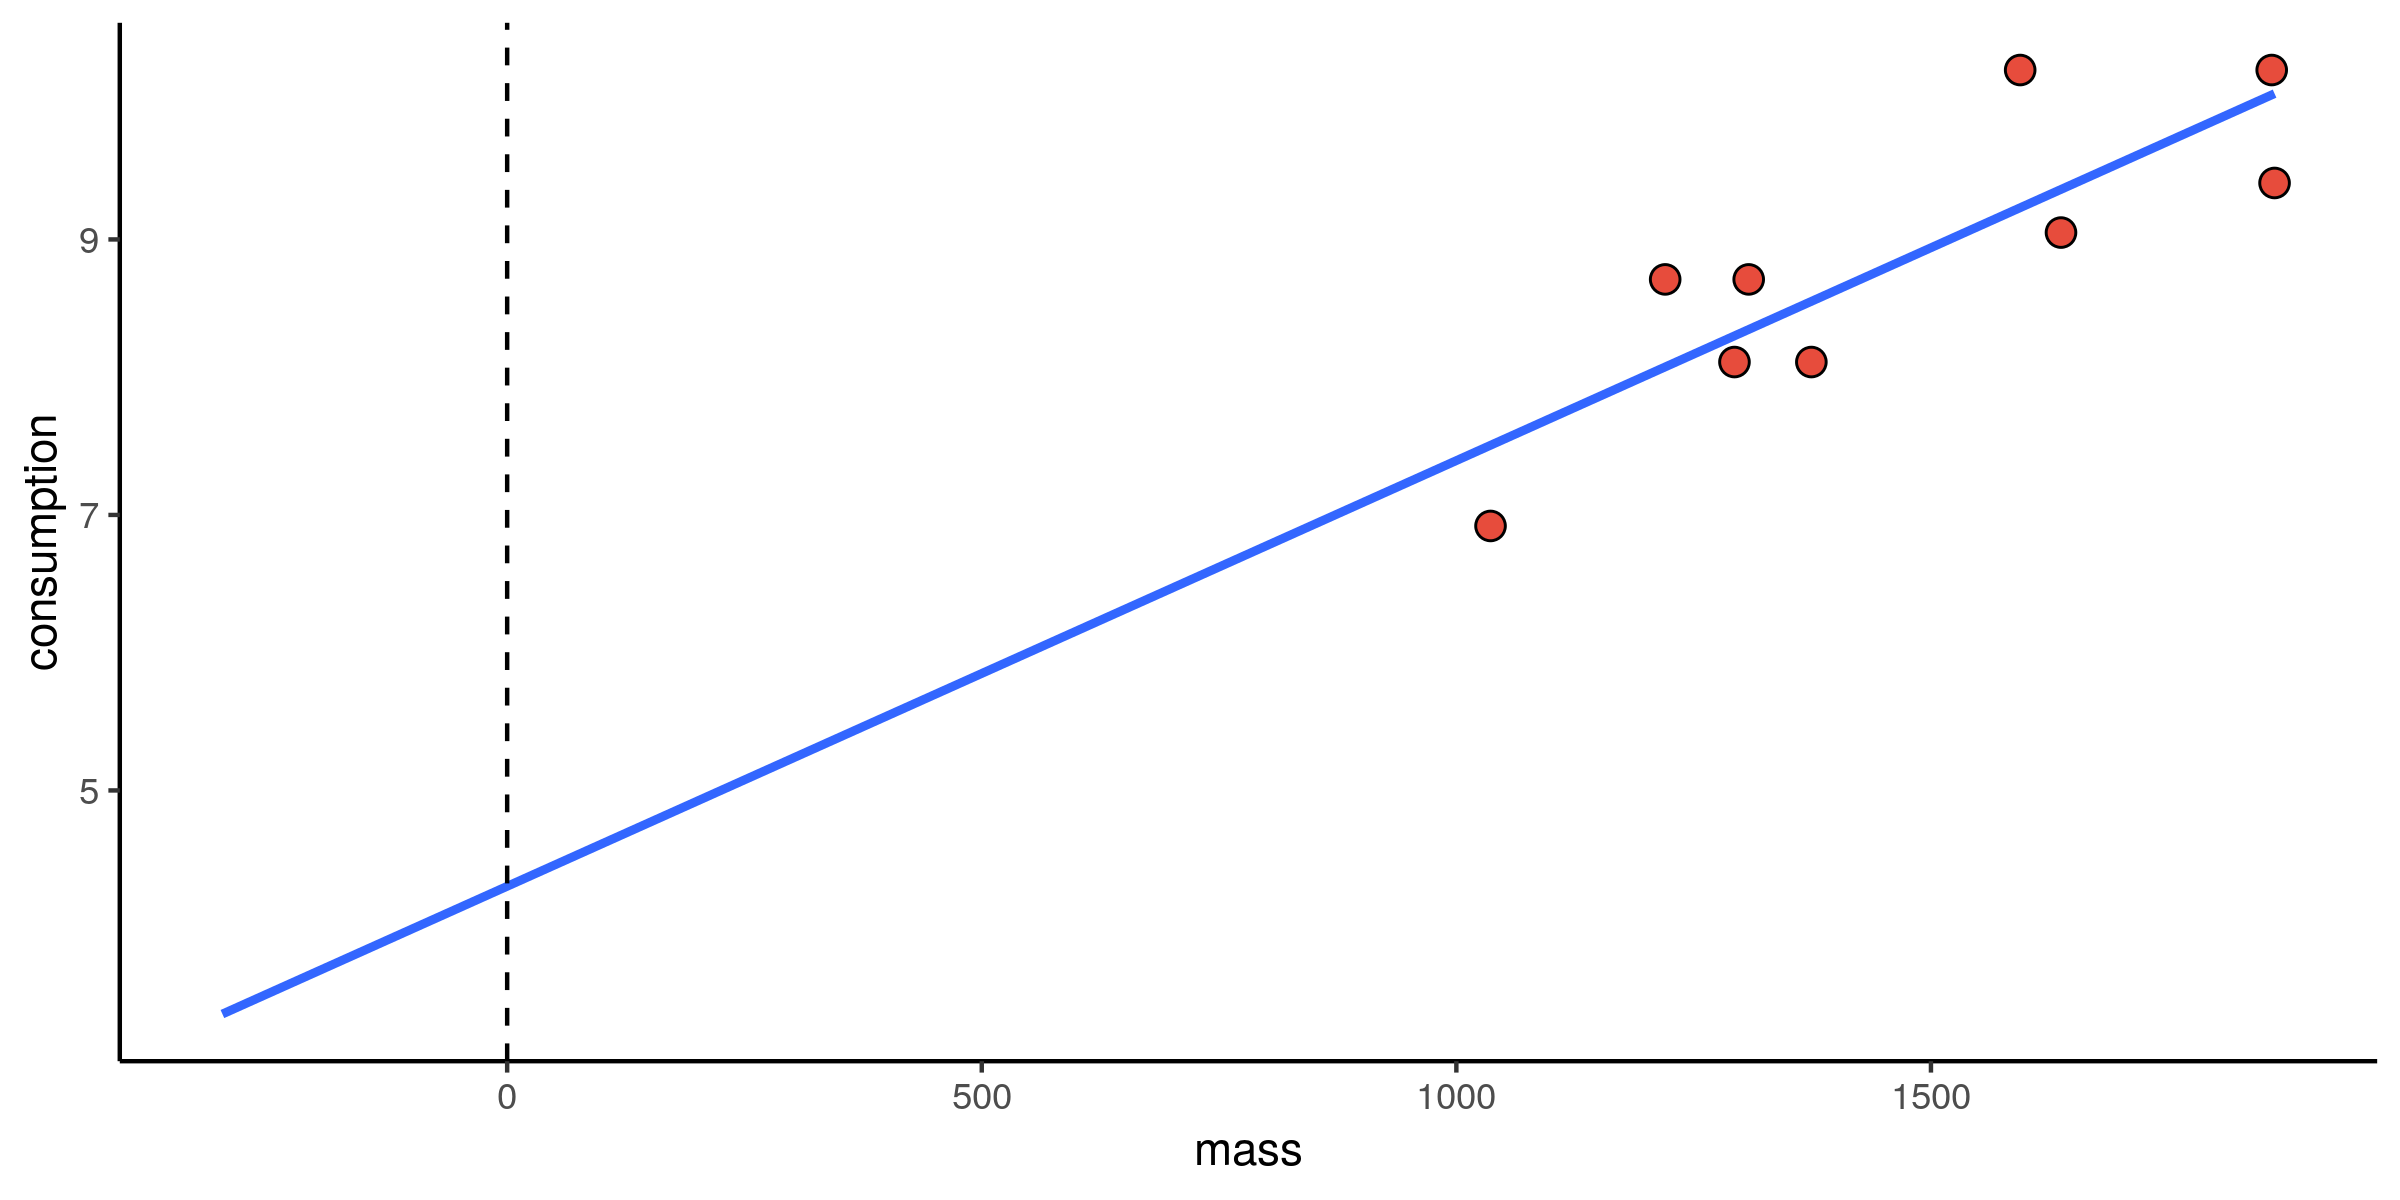
燃料消耗與質量的散佈圖

使用 PySpark 的機器學習

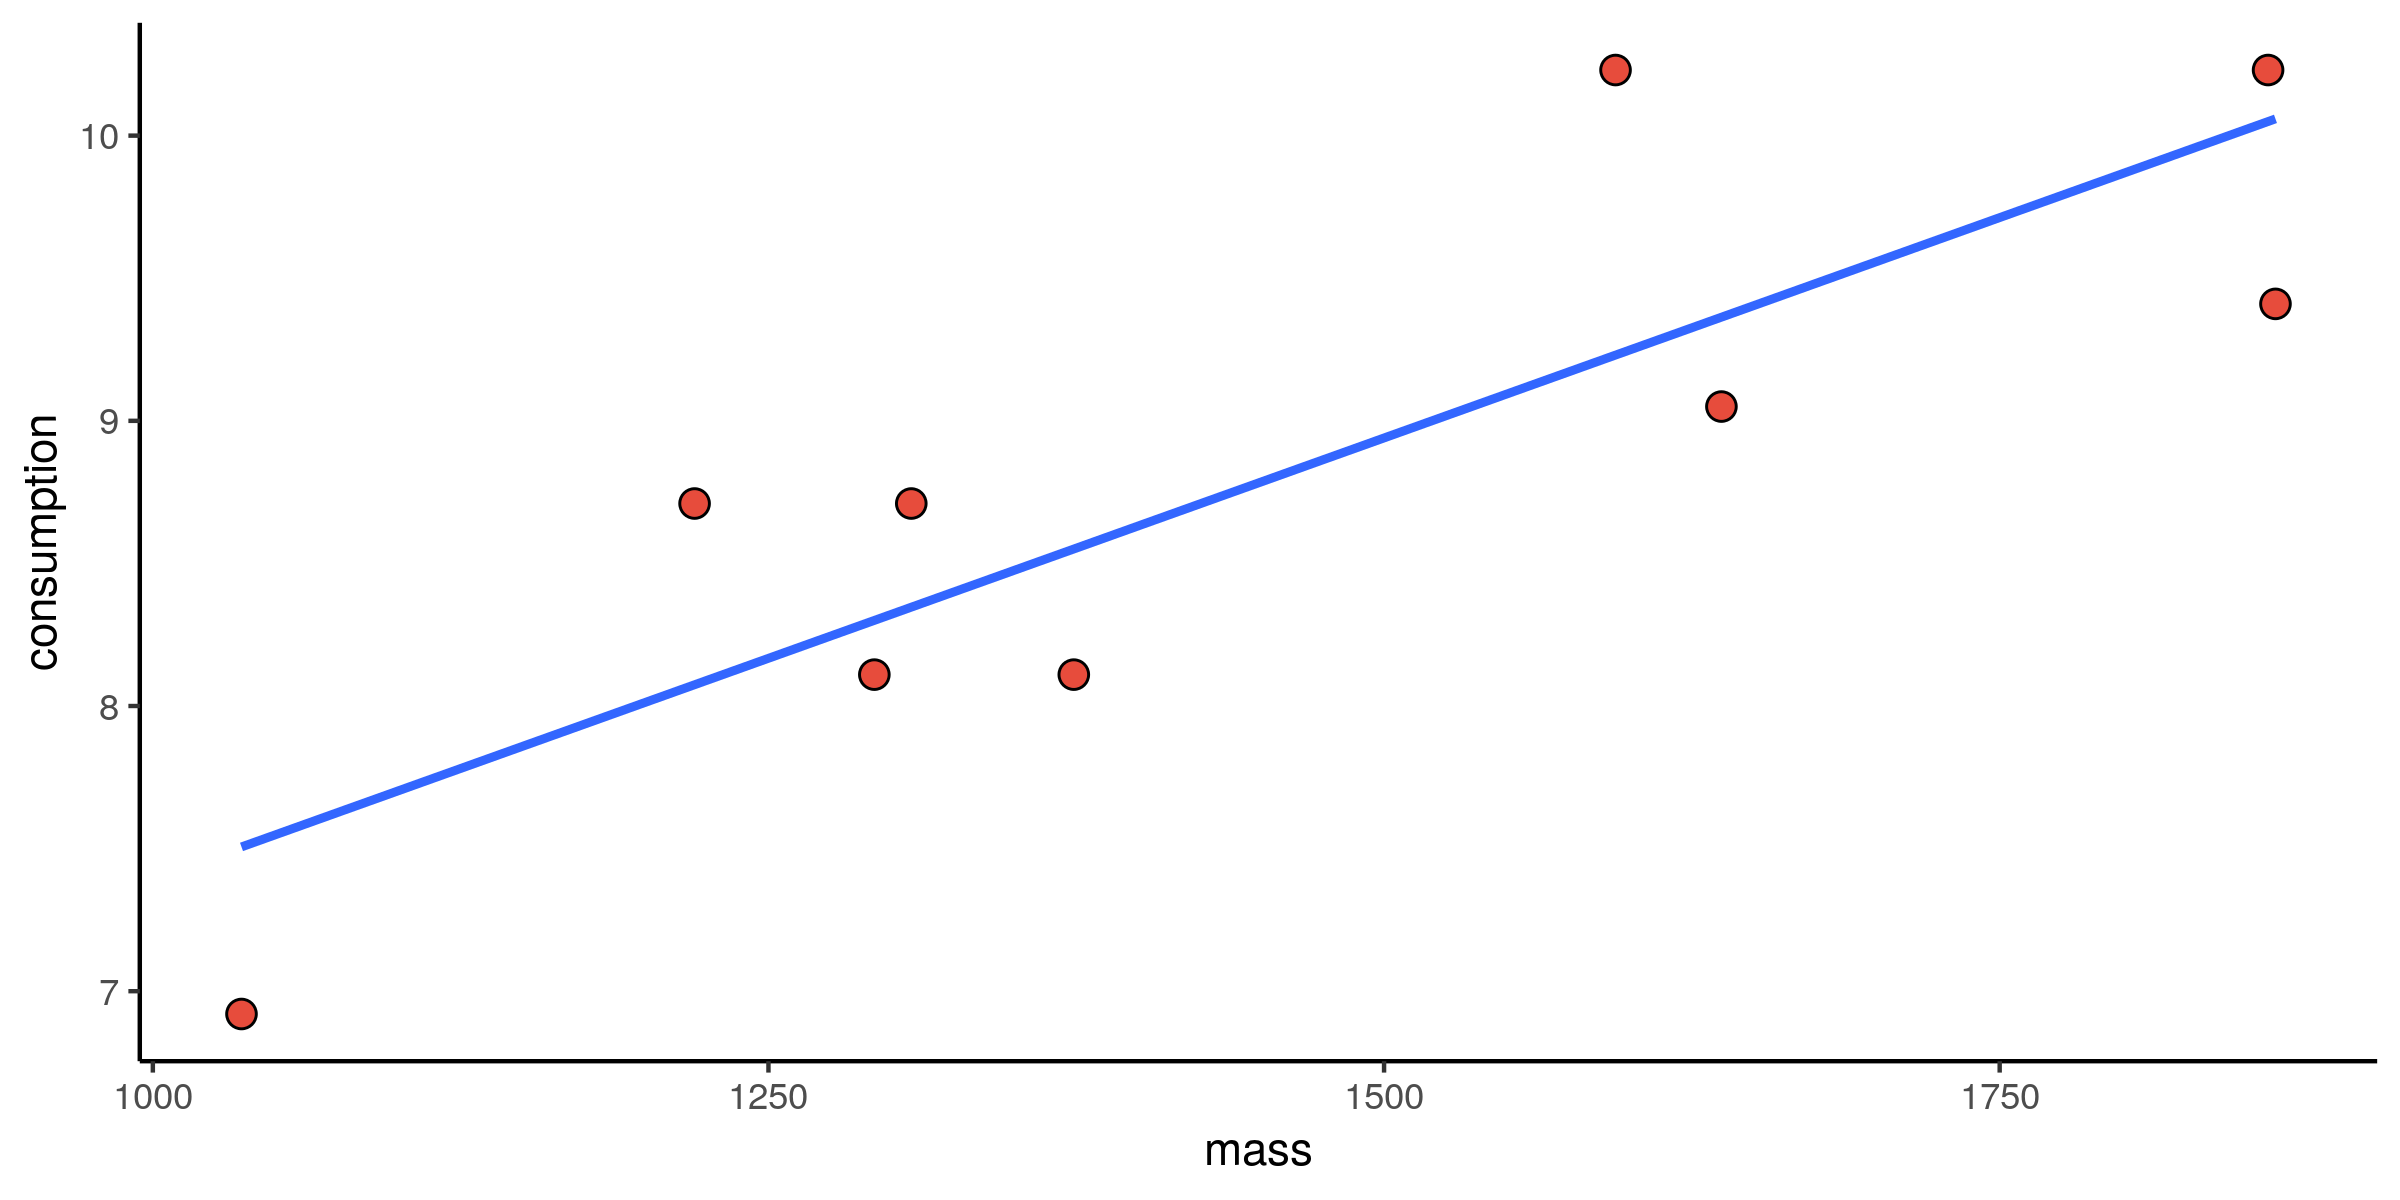
消耗 vs 質量:擬合

燃料消耗與質量的散佈圖與線性擬合

使用 PySpark 的機器學習

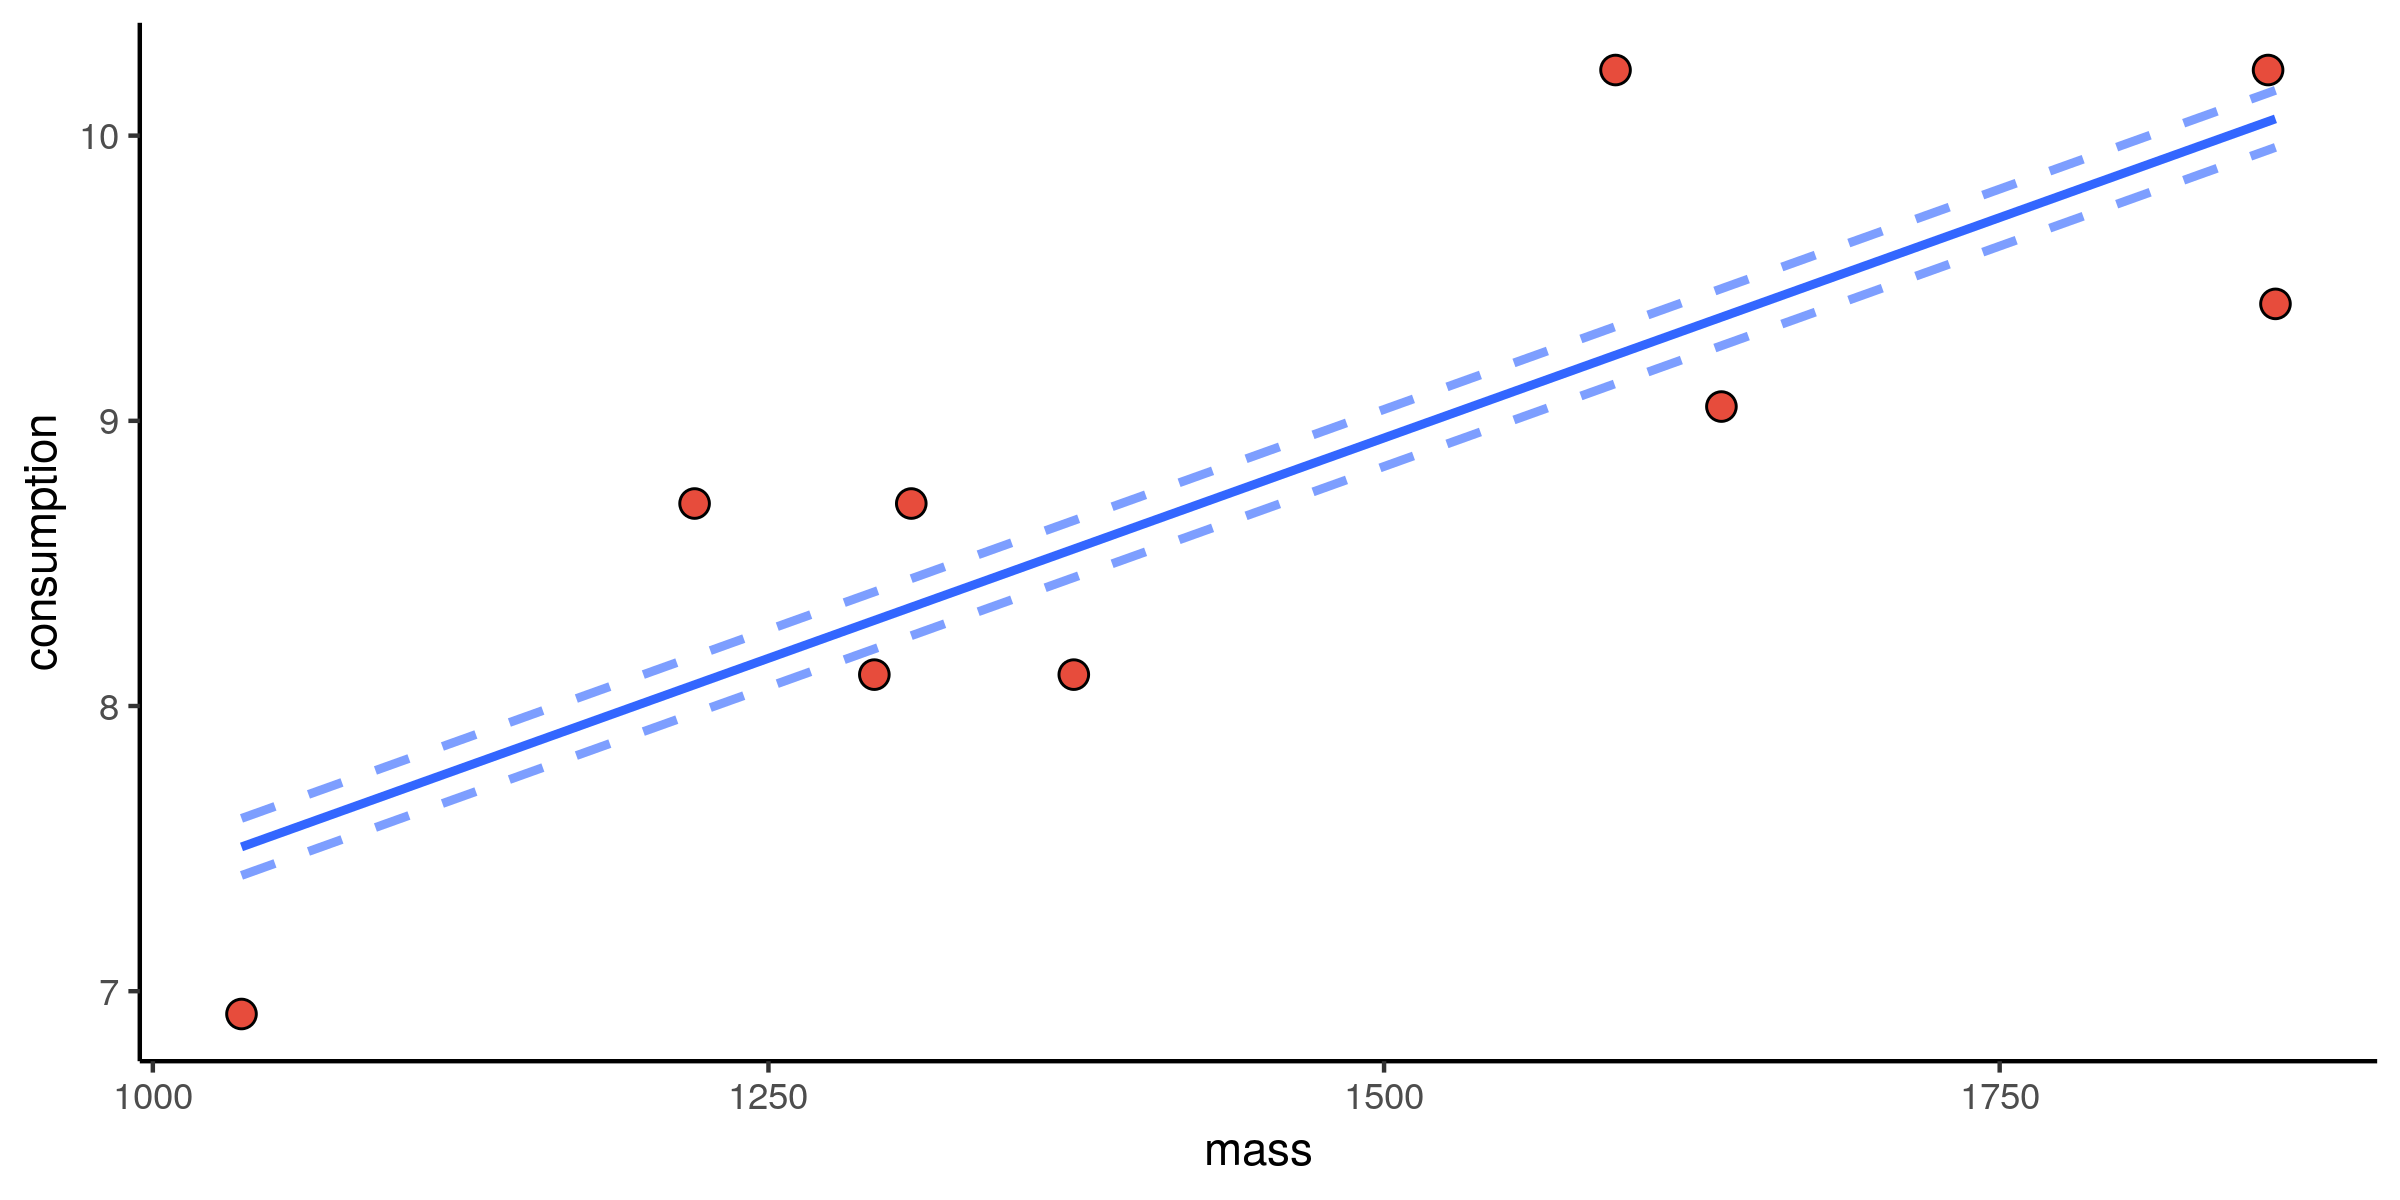
消耗 vs 質量:其他擬合

燃料消耗與質量的散佈圖,含線性擬合與替代方案

使用 PySpark 的機器學習

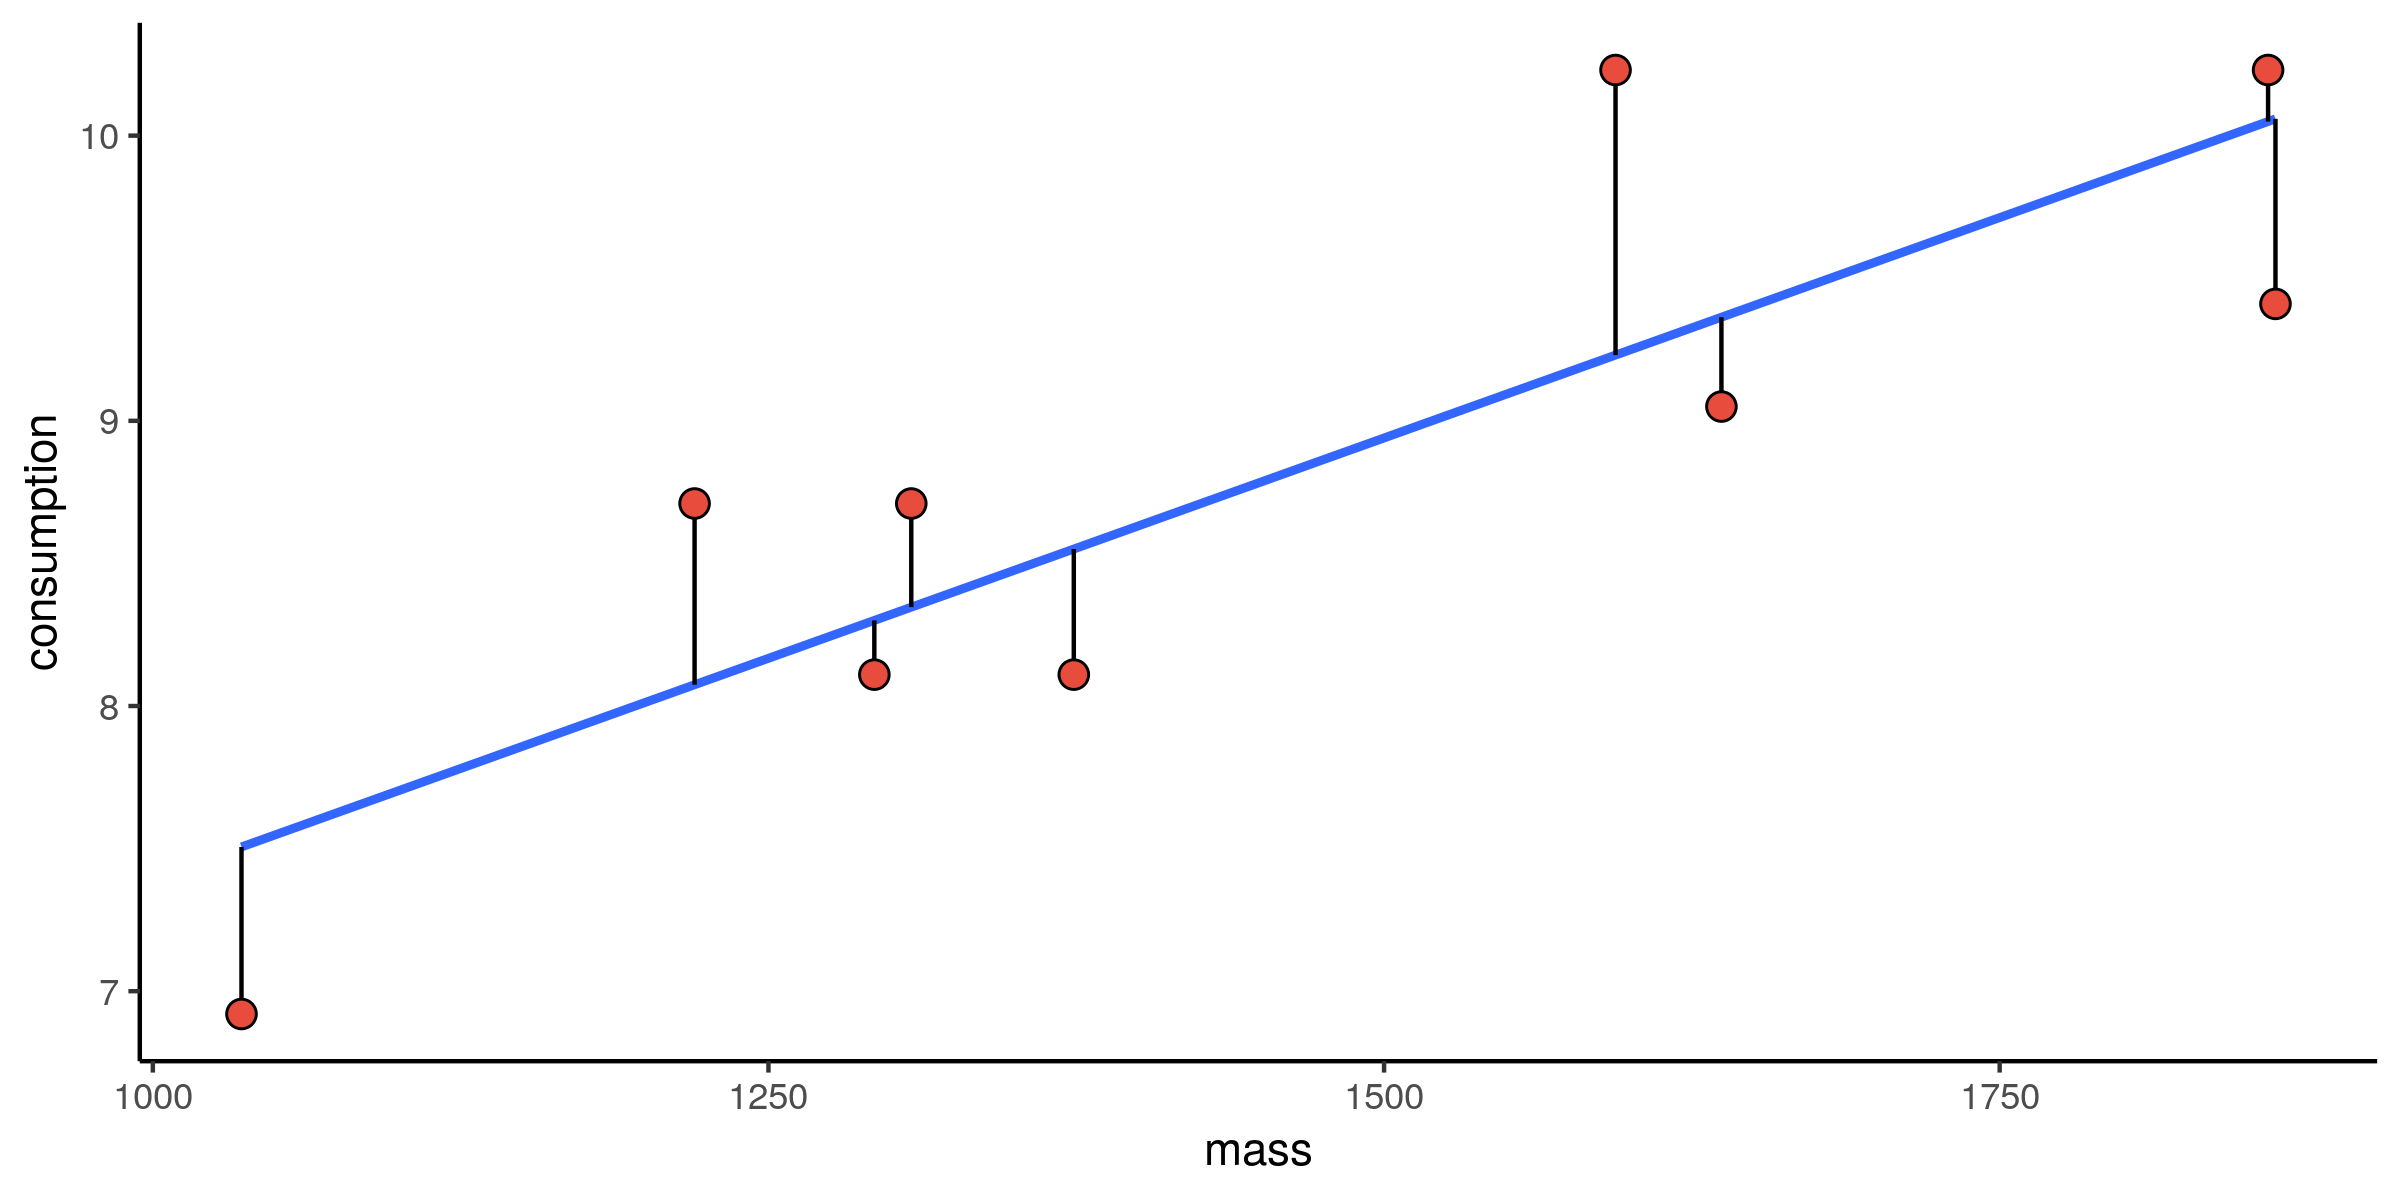
消耗 vs 質量:殘差

燃料消耗與質量的散佈圖與線性擬合和殘差

使用 PySpark 的機器學習

損失函式


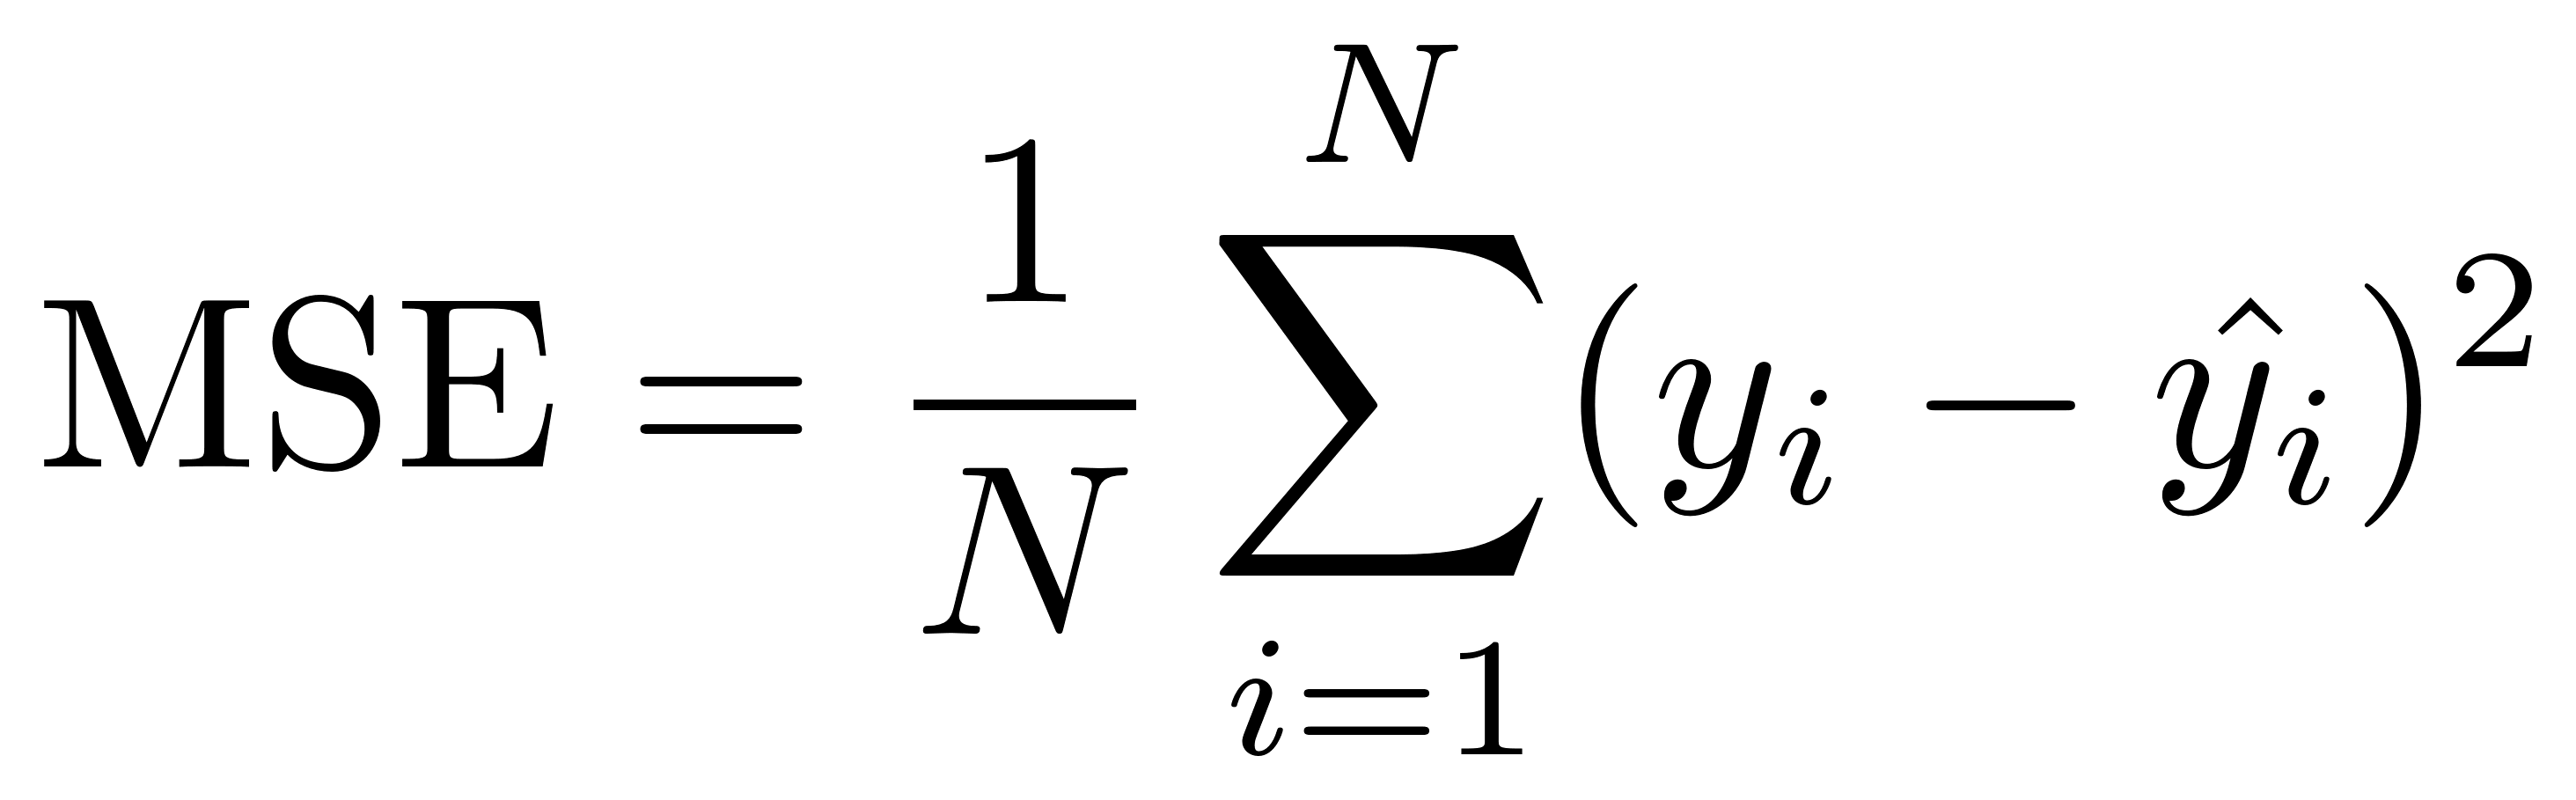
均方誤差損失函式

MSE = 「Mean Squared Error」(均方誤差)

使用 PySpark 的機器學習

損失函式:觀測值


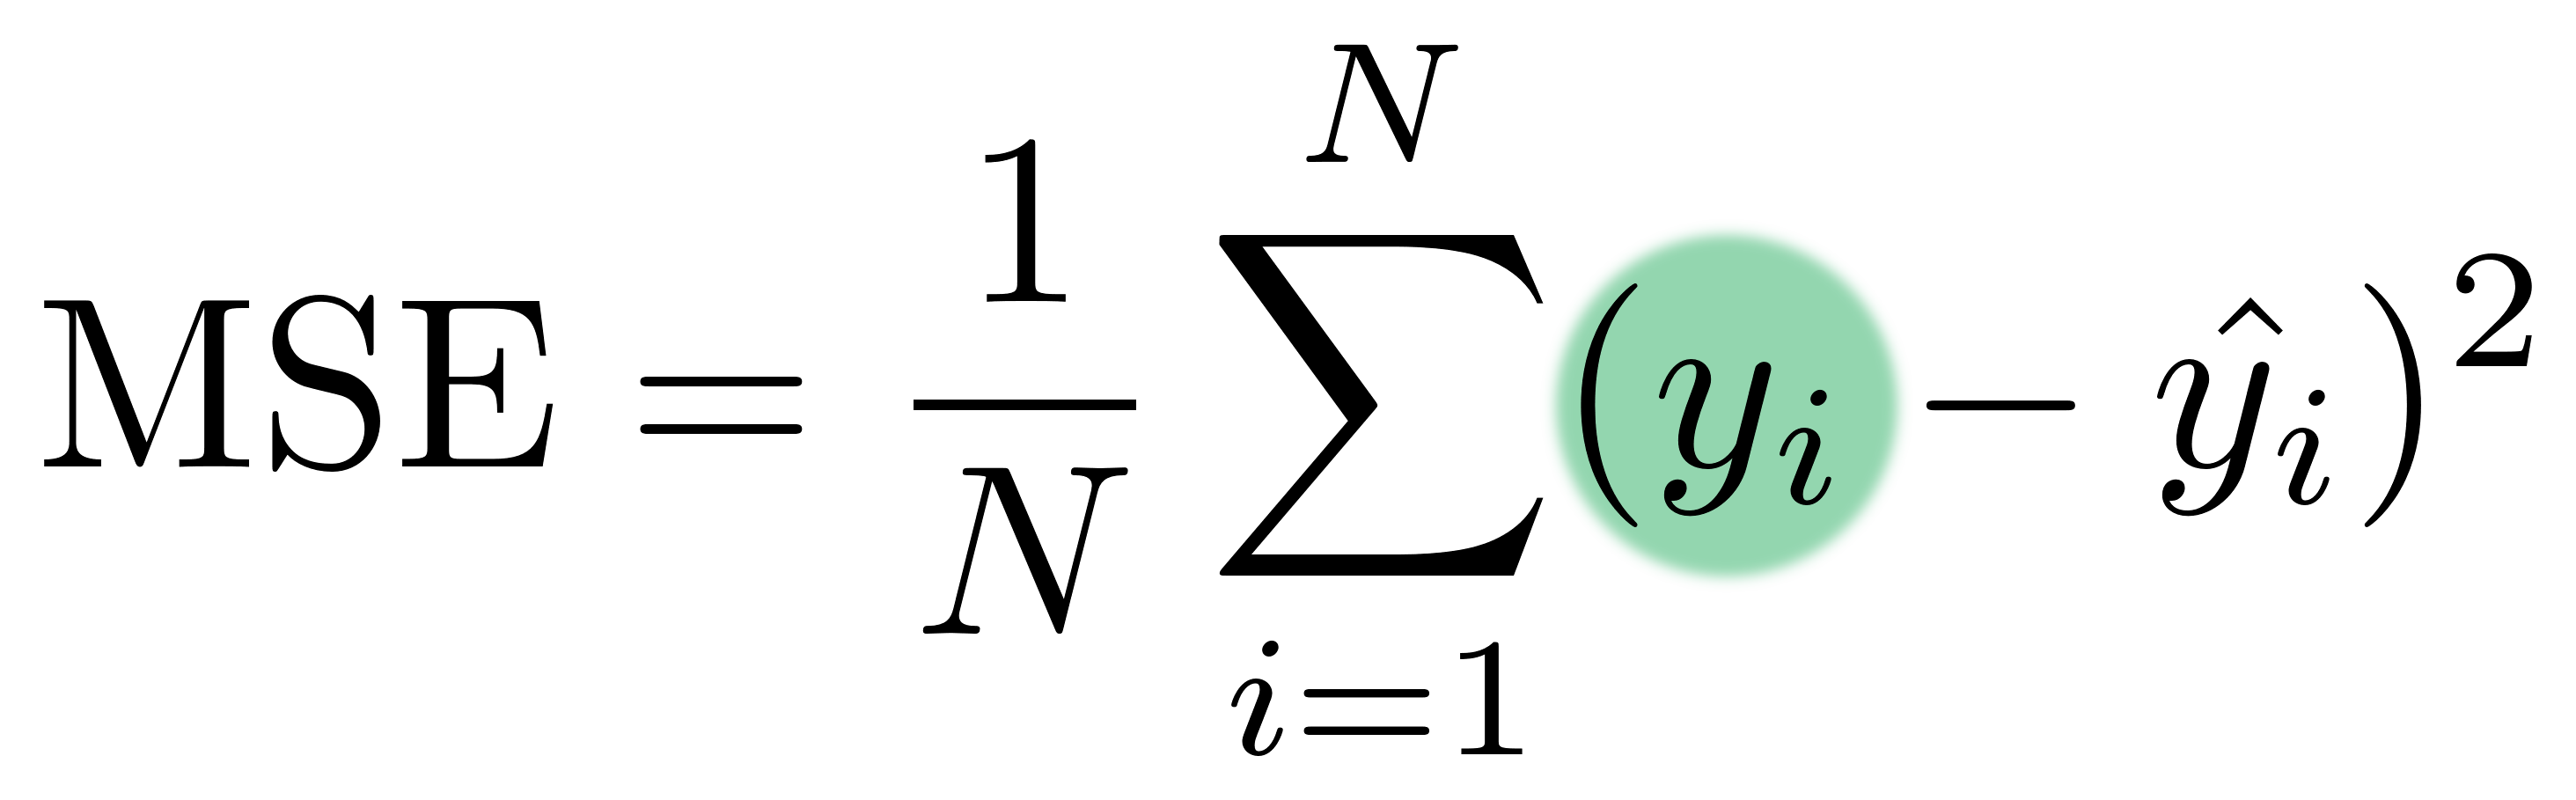
均方誤差損失函式

$y_i$ — 觀測值

使用 PySpark 的機器學習

損失函式:模型值


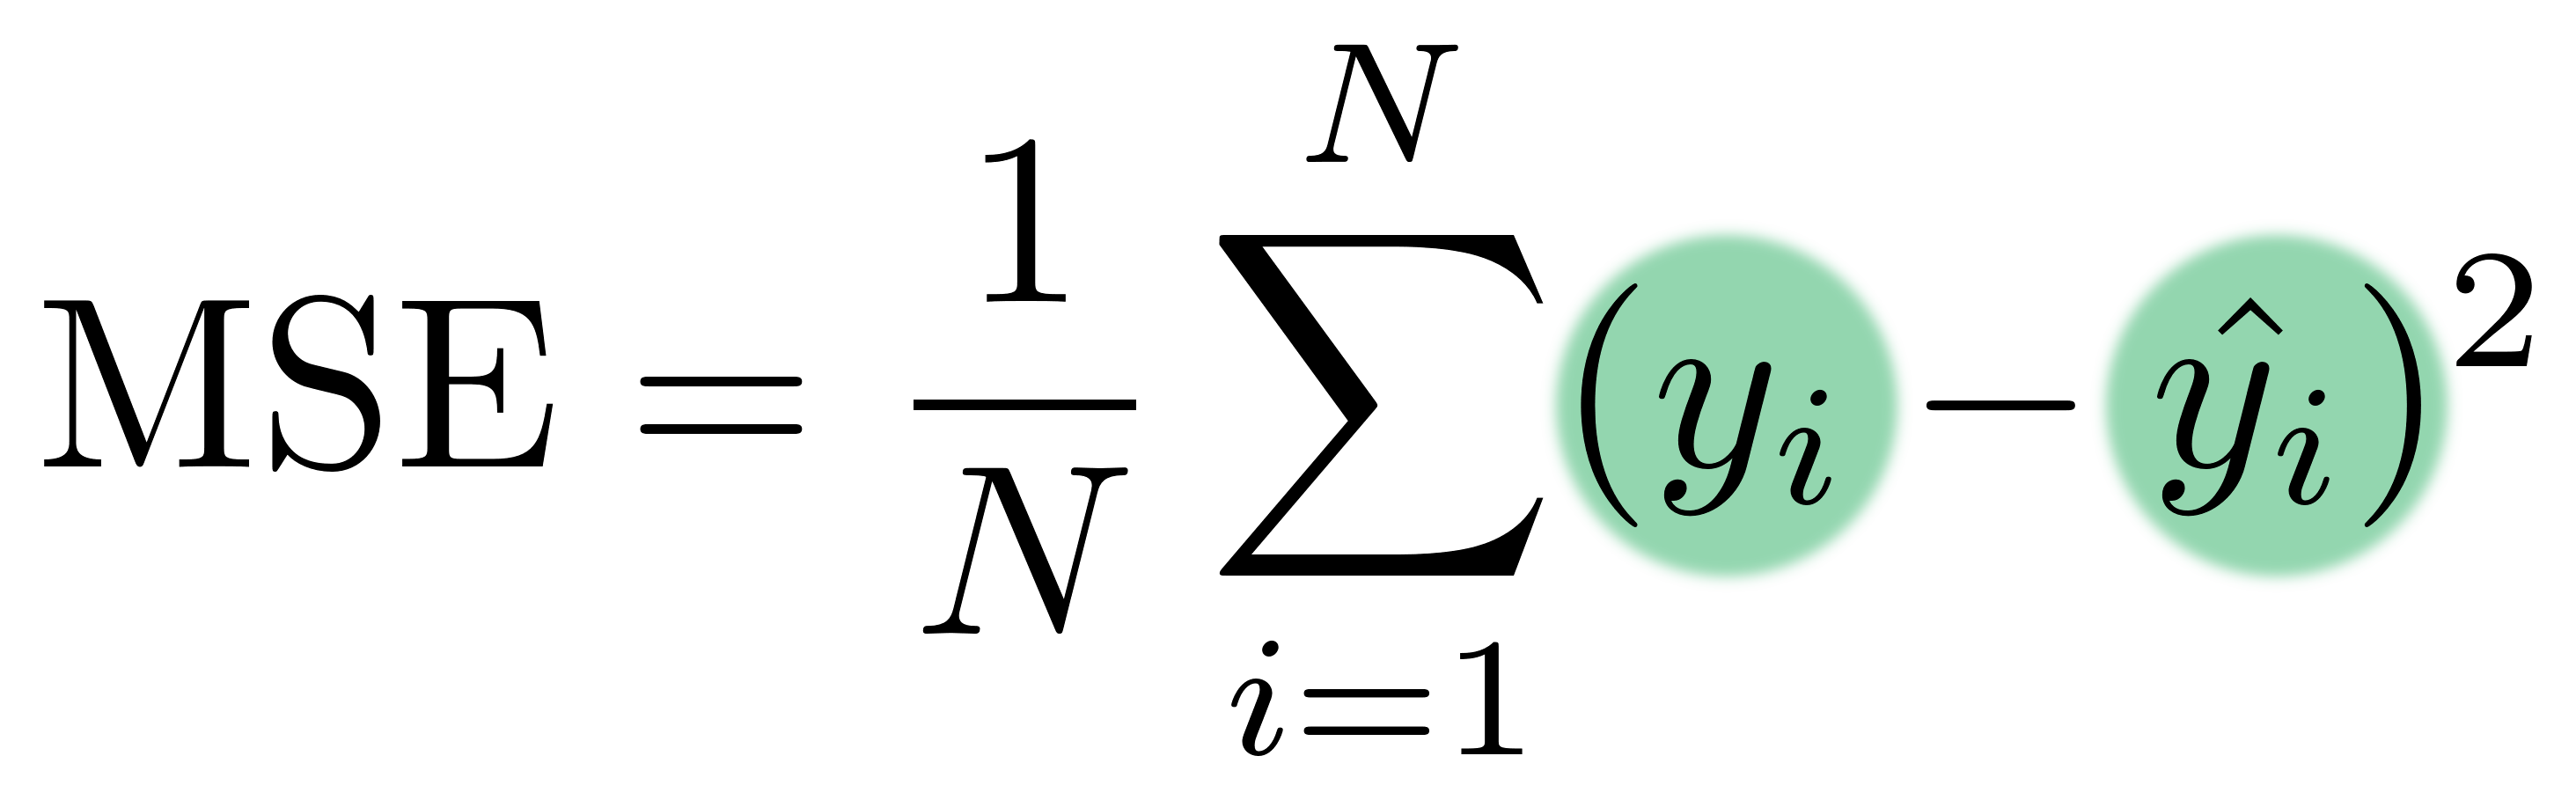
均方誤差損失函式

$y_i$ — 觀測值

$\hat{y_i}$ — 模型值

使用 PySpark 的機器學習

損失函式:平均


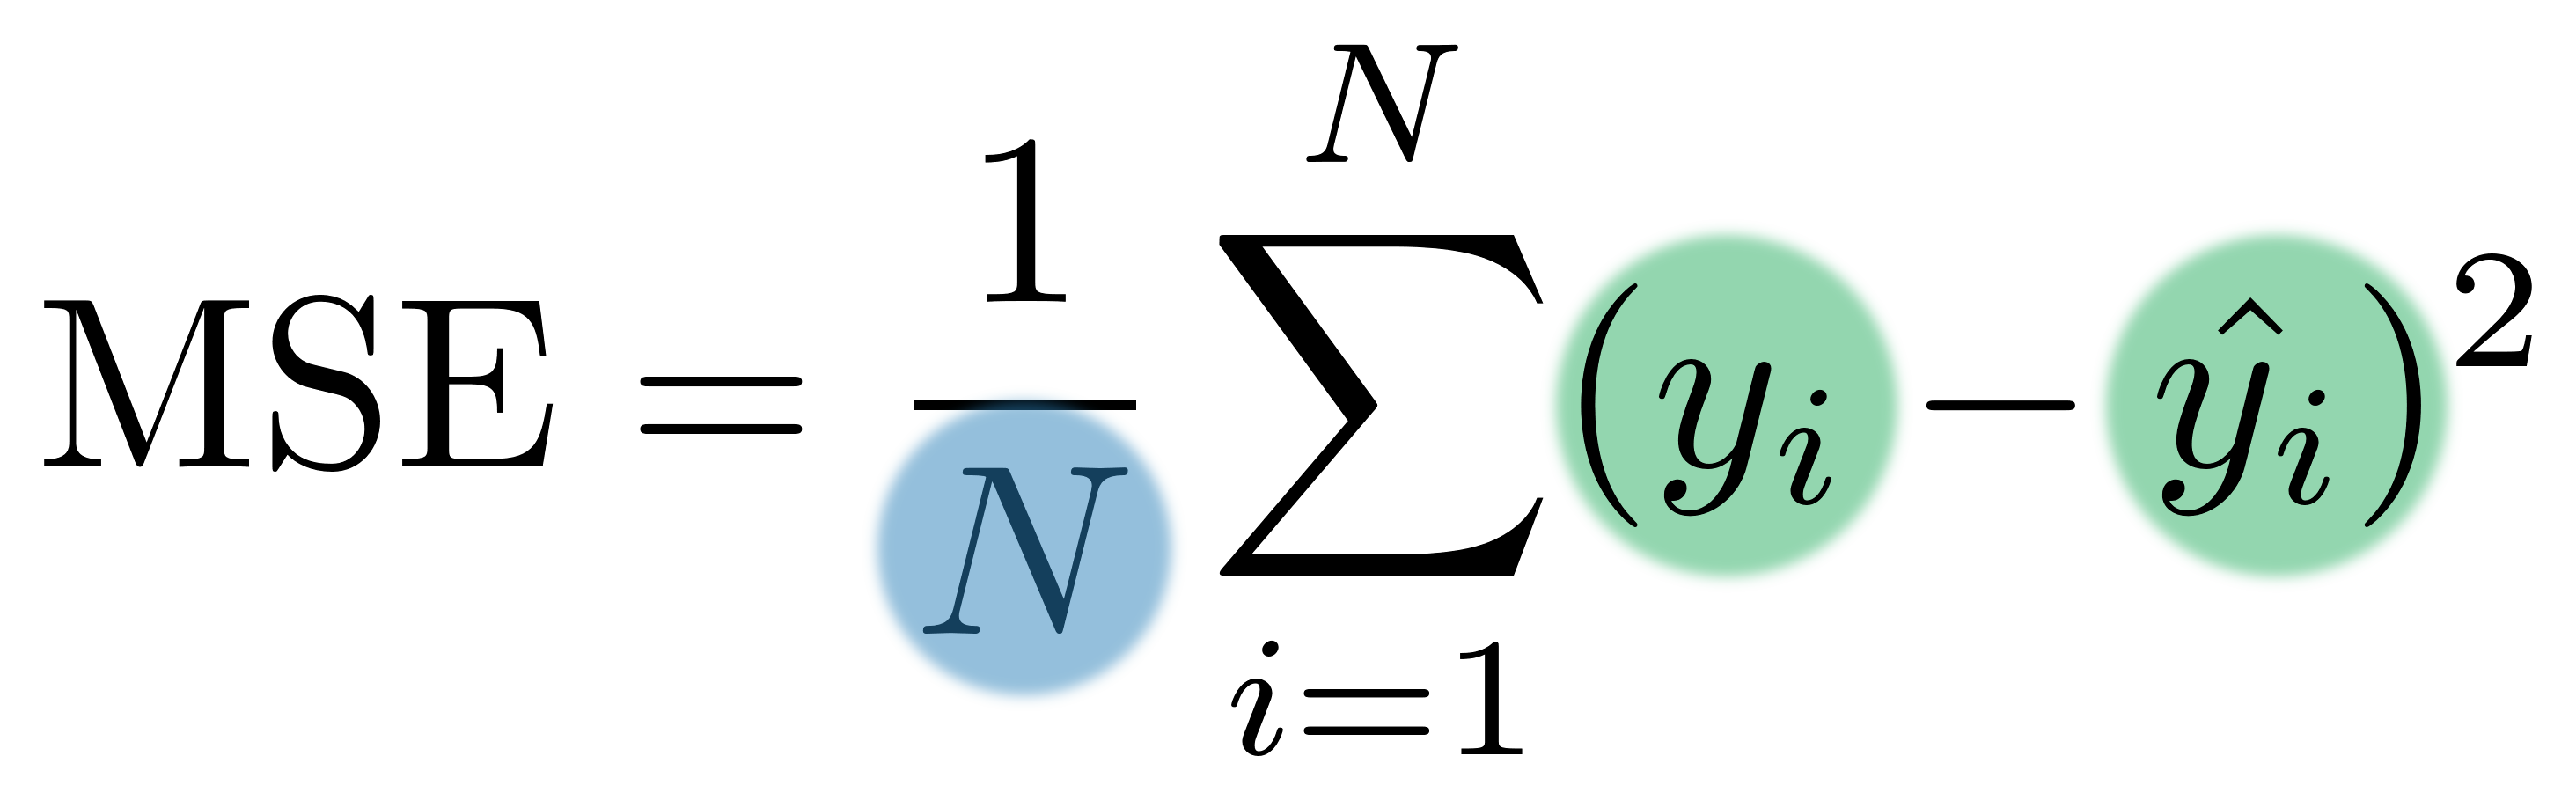
均方誤差損失函式

$y_i$ — 觀測值

$\hat{y_i}$ — 模型值

使用 PySpark 的機器學習

組裝預測變數

使用 masscyltype_dummy 預測 consumption

將預測變數整合為單一欄。

+------+---+-------------+----------------------------+-----------+
|mass  |cyl|type_dummy   |features                    |consumption|
+------+---+-------------+----------------------------+-----------+
|1451.0|6  |(5,[0],[1.0])|(7,[0,1,2],[1451.0,6.0,1.0])|9.05       |
|1129.0|4  |(5,[2],[1.0])|(7,[0,1,4],[1129.0,4.0,1.0])|6.53       |
|1399.0|4  |(5,[2],[1.0])|(7,[0,1,4],[1399.0,4.0,1.0])|7.84       |
|1147.0|4  |(5,[1],[1.0])|(7,[0,1,3],[1147.0,4.0,1.0])|7.84       |
|1111.0|4  |(5,[3],[1.0])|(7,[0,1,5],[1111.0,4.0,1.0])|9.05       |
+------+---+-------------+----------------------------+-----------+
使用 PySpark 的機器學習

建立迴歸模型

from pyspark.ml.regression import LinearRegression

regression = LinearRegression(labelCol='consumption')

cars_train(訓練資料)擬合。

regression = regression.fit(cars_train)

cars_test(測試資料)上做預測。

predictions = regression.transform(cars_test)
使用 PySpark 的機器學習

檢視預測

+-----------+------------------+
|consumption|prediction        |
+-----------+------------------+
|7.84       |8.92699470743403  |
|9.41       |9.379295891451353 |
|8.11       |7.23487264538364  |
|9.05       |9.409860194333735 |
|7.84       |7.059190923328711 |
|7.84       |7.785909738591766 |
|7.59       |8.129959405168547 |
|5.11       |6.836843743852942 |
|8.11       |7.17173702652015  |
+-----------+------------------+

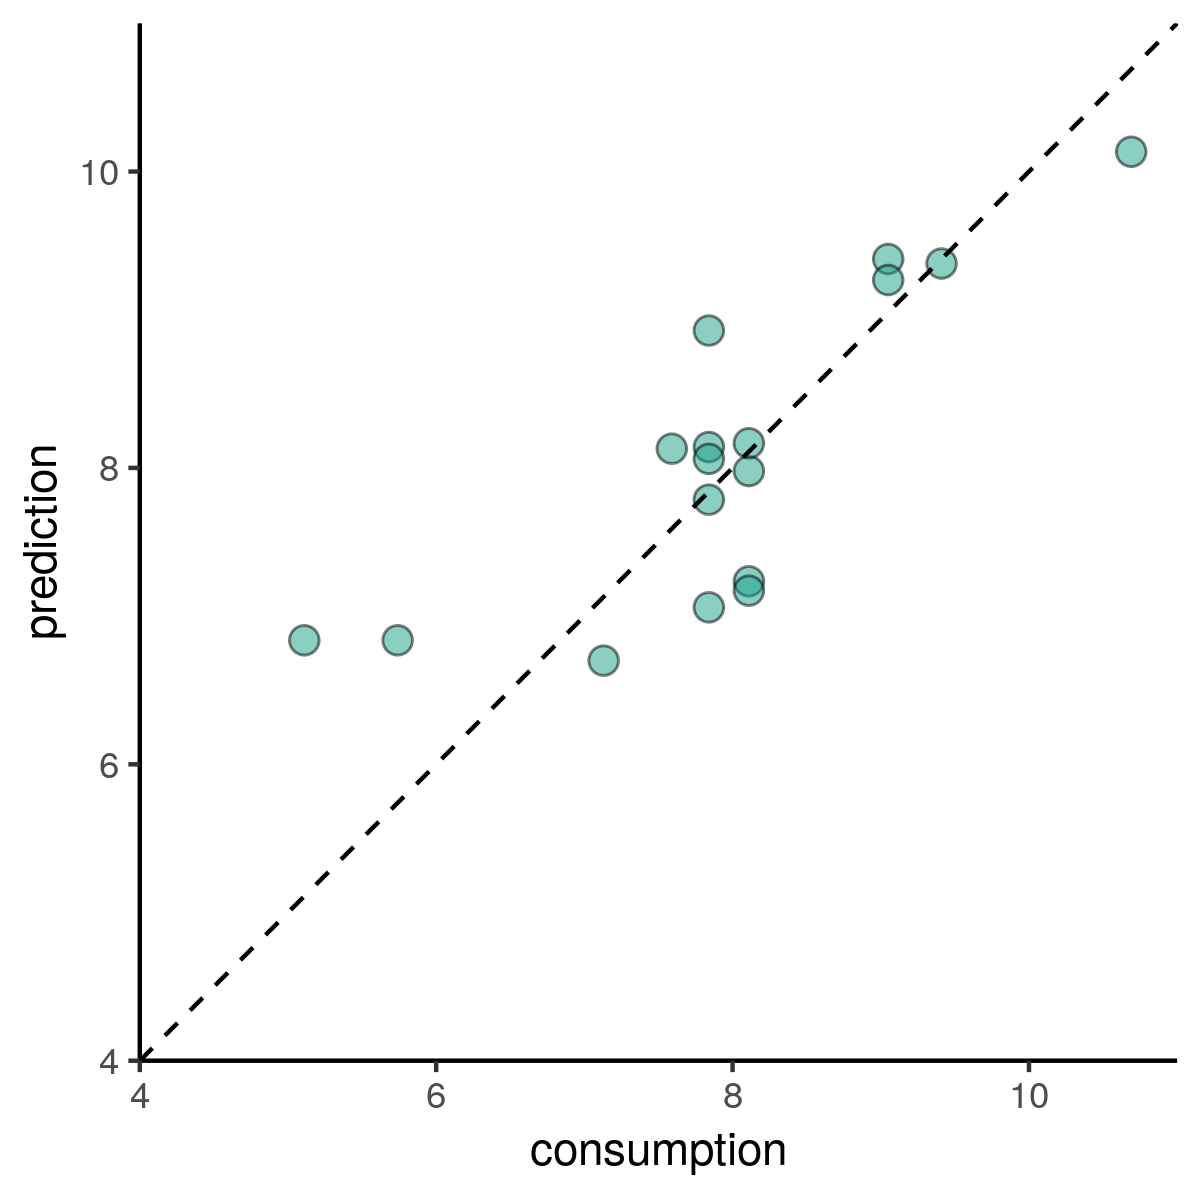
預測值對實際值的散佈圖

使用 PySpark 的機器學習

計算 RMSE

from pyspark.ml.evaluation import RegressionEvaluator

# 找出 RMSE(Root Mean Squared Error)
RegressionEvaluator(labelCol='consumption').evaluate(predictions)
0.708699086182001

RegressionEvaluator 也可計算以下指標:

  • mae(Mean Absolute Error)
  • r2($R^2$)
  • mse(Mean Squared Error)。
使用 PySpark 的機器學習

消耗 vs 質量:截距

顯示模型截距的圖

使用 PySpark 的機器學習

檢視截距

regression.intercept
4.9450616833727095

這是(假設情境下)的燃料消耗,當:

  • mass = 0
  • cyl = 0,且
  • 車種為「Van」。
使用 PySpark 的機器學習

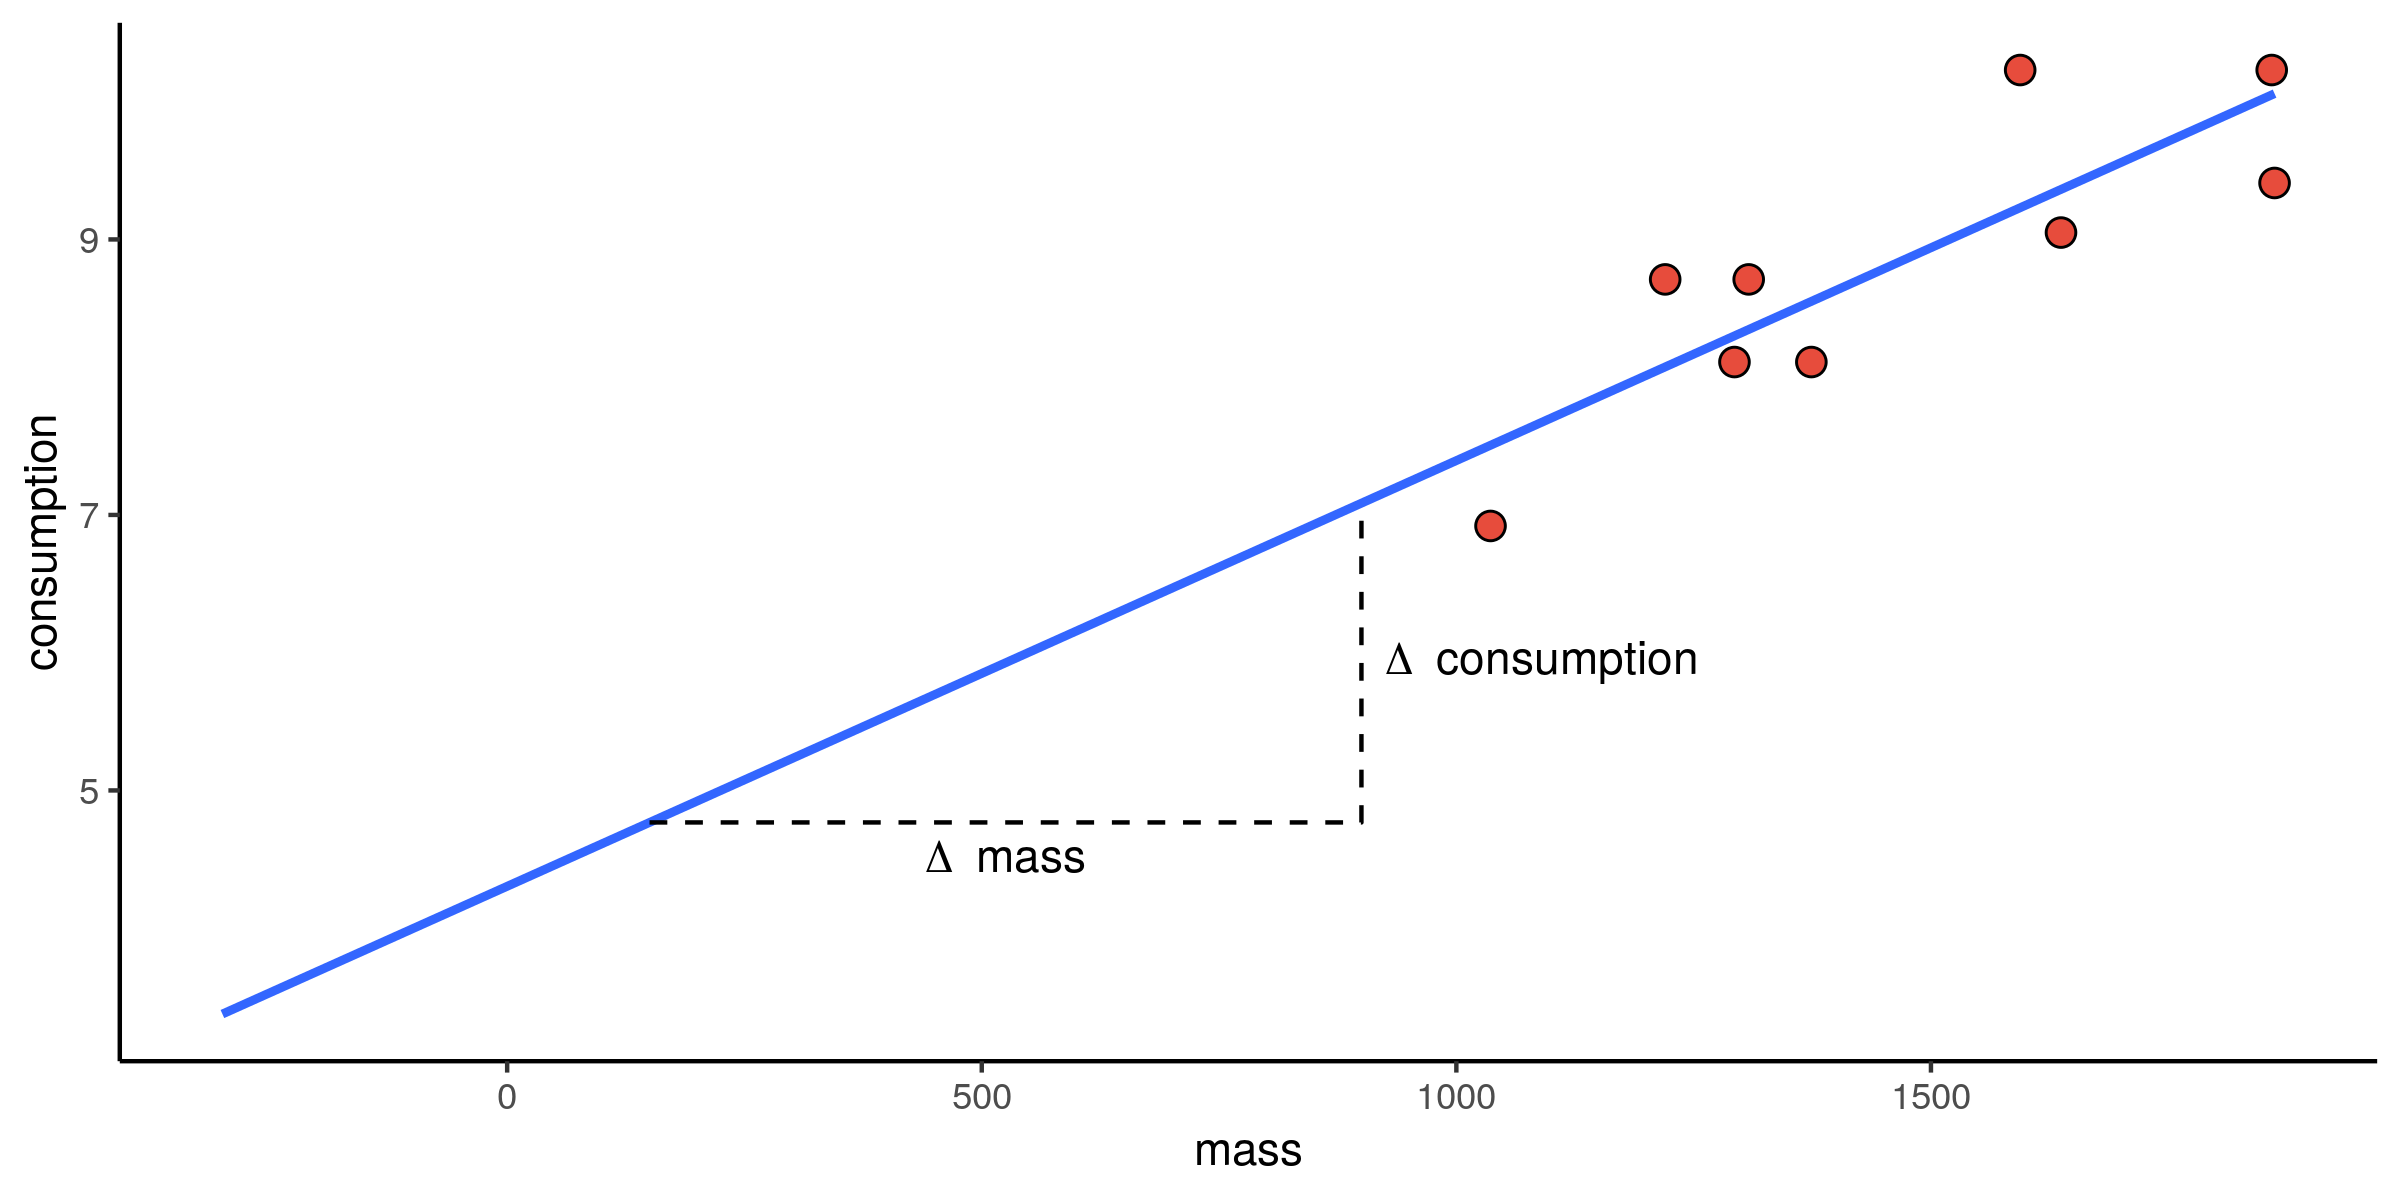
消耗 vs 質量:斜率

顯示模型斜率的圖

使用 PySpark 的機器學習

檢視係數

regression.coefficients
DenseVector([0.0027, 0.1897, -1.309, -1.7933, -1.3594, -1.2917, -1.9693])
mass        0.0027
cyl         0.1897

Midsize    -1.3090
Small      -1.7933
Compact    -1.3594
Sporty     -1.2917
Large      -1.9693
使用 PySpark 的機器學習

數值預測的迴歸

使用 PySpark 的機器學習

Preparing Video For Download...