Python 的降維
Jeroen Boeye
Head of Machine Learning, Faktion
df.shape
(1986, 99)
non_numeric = ['BMI_class', 'Height_class',
               'Gender',  'Component', 'Branch']

df_numeric = df.drop(non_numeric, axis=1)

df_numeric.shape
(1986, 94)
from sklearn.manifold import TSNE

m = TSNE(learning_rate=50)
tsne_features = m.fit_transform(df_numeric)

tsne_features[1:4,:]
array([[-37.962185,  15.066088],
       [-21.873512,  26.334448],
       [ 13.97476 ,  22.590828]], dtype=float32)
tsne_features[1:4,:]
df['x'] = tsne_features[:,0]

df['y'] = tsne_features[:,1]
import seaborn as sns

sns.scatterplot(x="x", y="y", data=df)

plt.show()
import seaborn as sns
import matplotlib.pyplot as plt

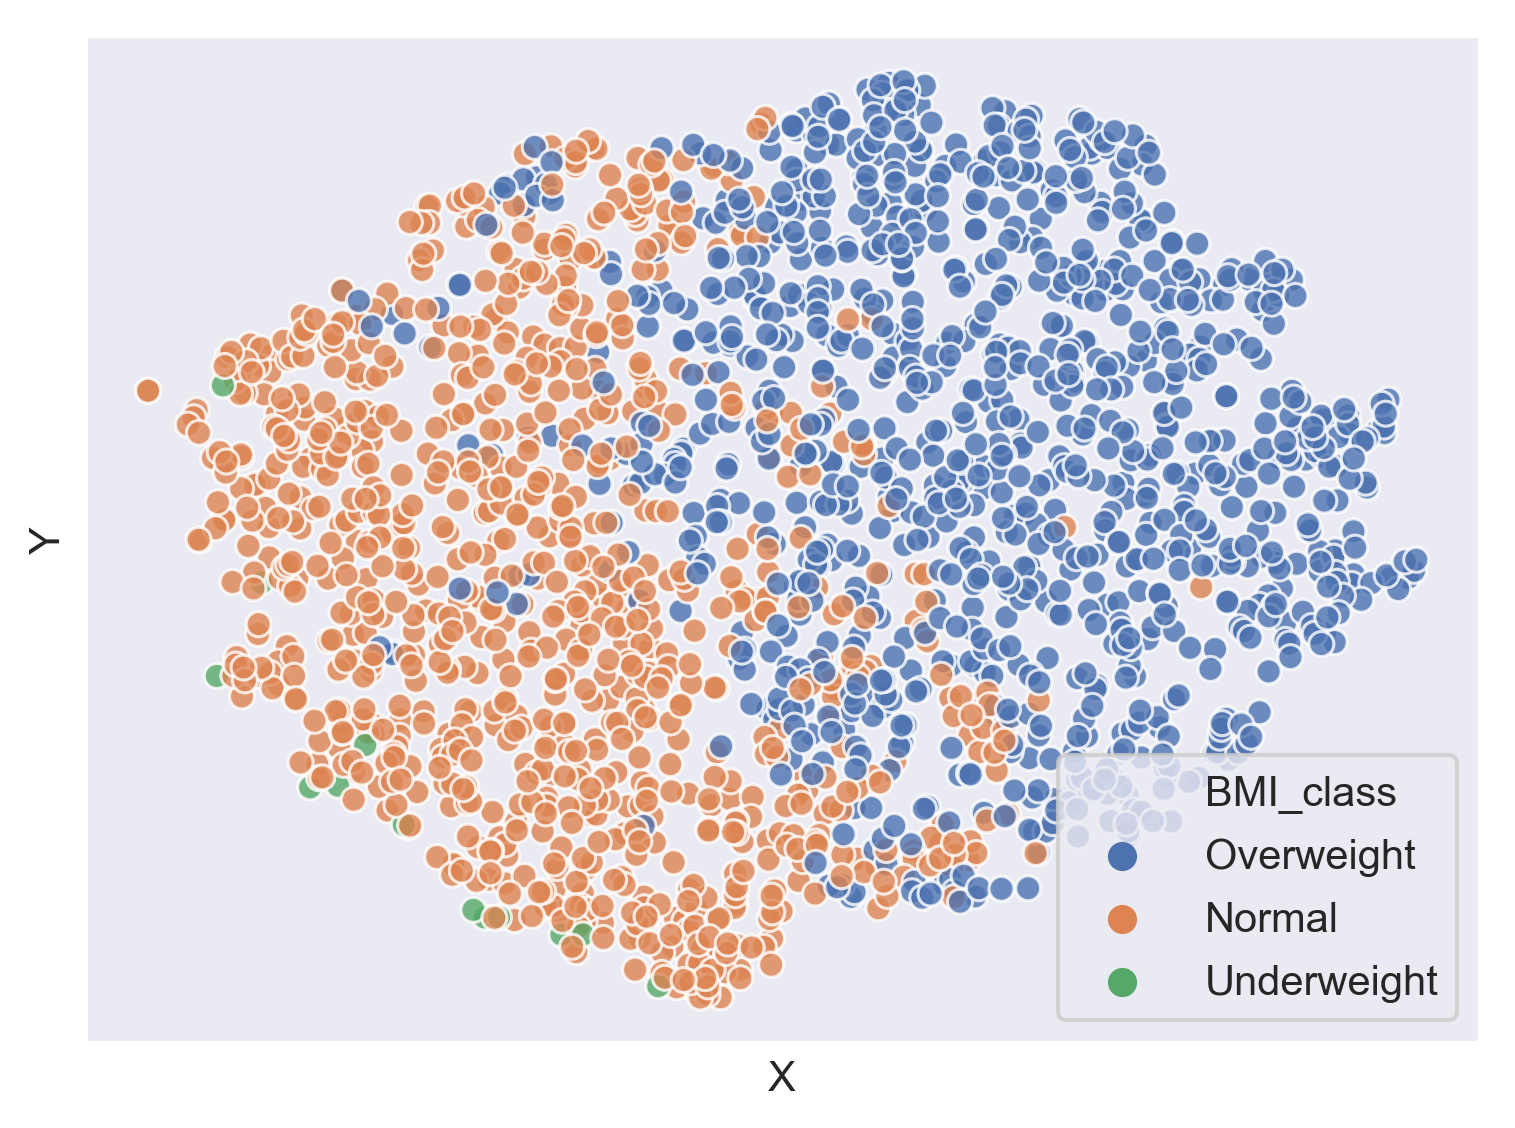
sns.scatterplot(x="x", y="y", hue='BMI_class', data=df)

plt.show()
import seaborn as sns

import matplotlib.pyplot as plt

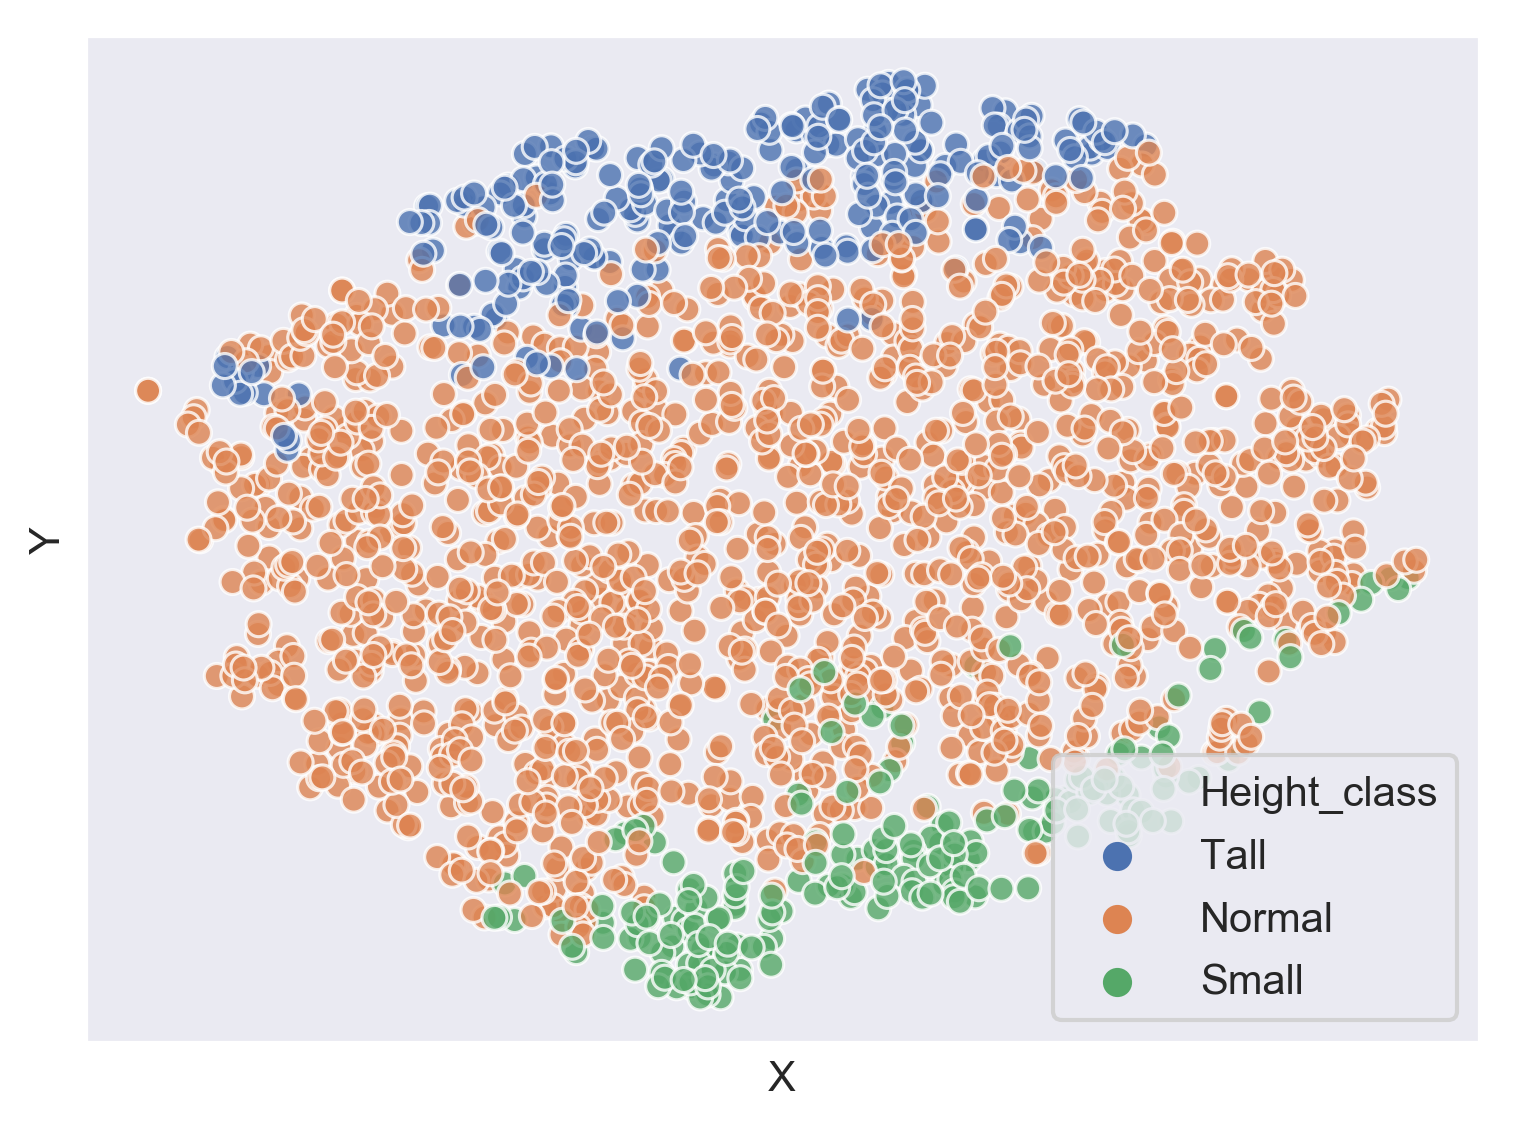
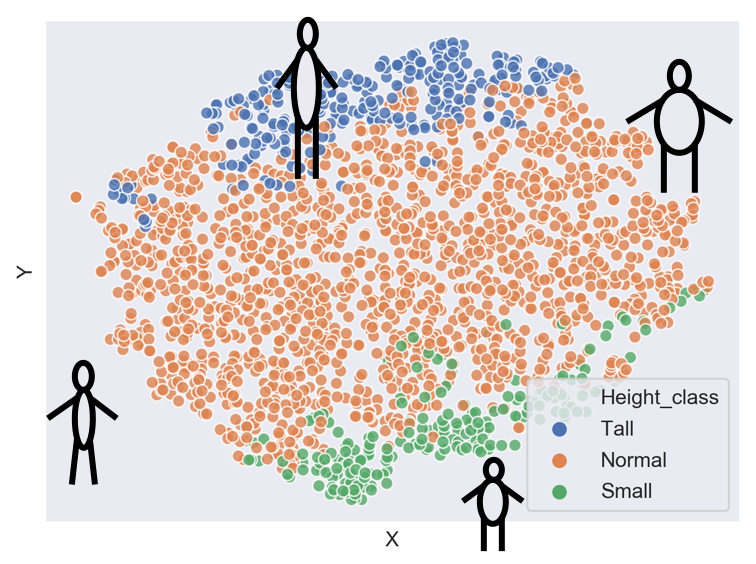
sns.scatterplot(x="x", y="y", hue='Height_class', data=df)

plt.show()