PCA 的應用

Python 的降維

Jeroen Boeye

Head of Machine Learning, Faktion

理解主成分

print(pca.components_)
array([[  0.71, 0.71],
       [ -0.71, 0.71]])

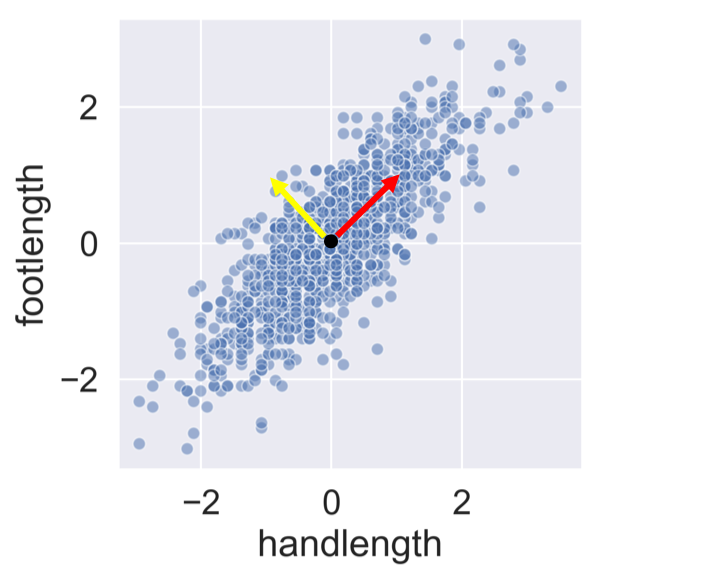
PC 1 = 0.71 x 手長 + 0.71 x 足長

PC 2 = -0.71 x 手長 + 0.71 x 足長

手長 vs. 足長(含向量)

Python 的降維

用 PCA 探索資料

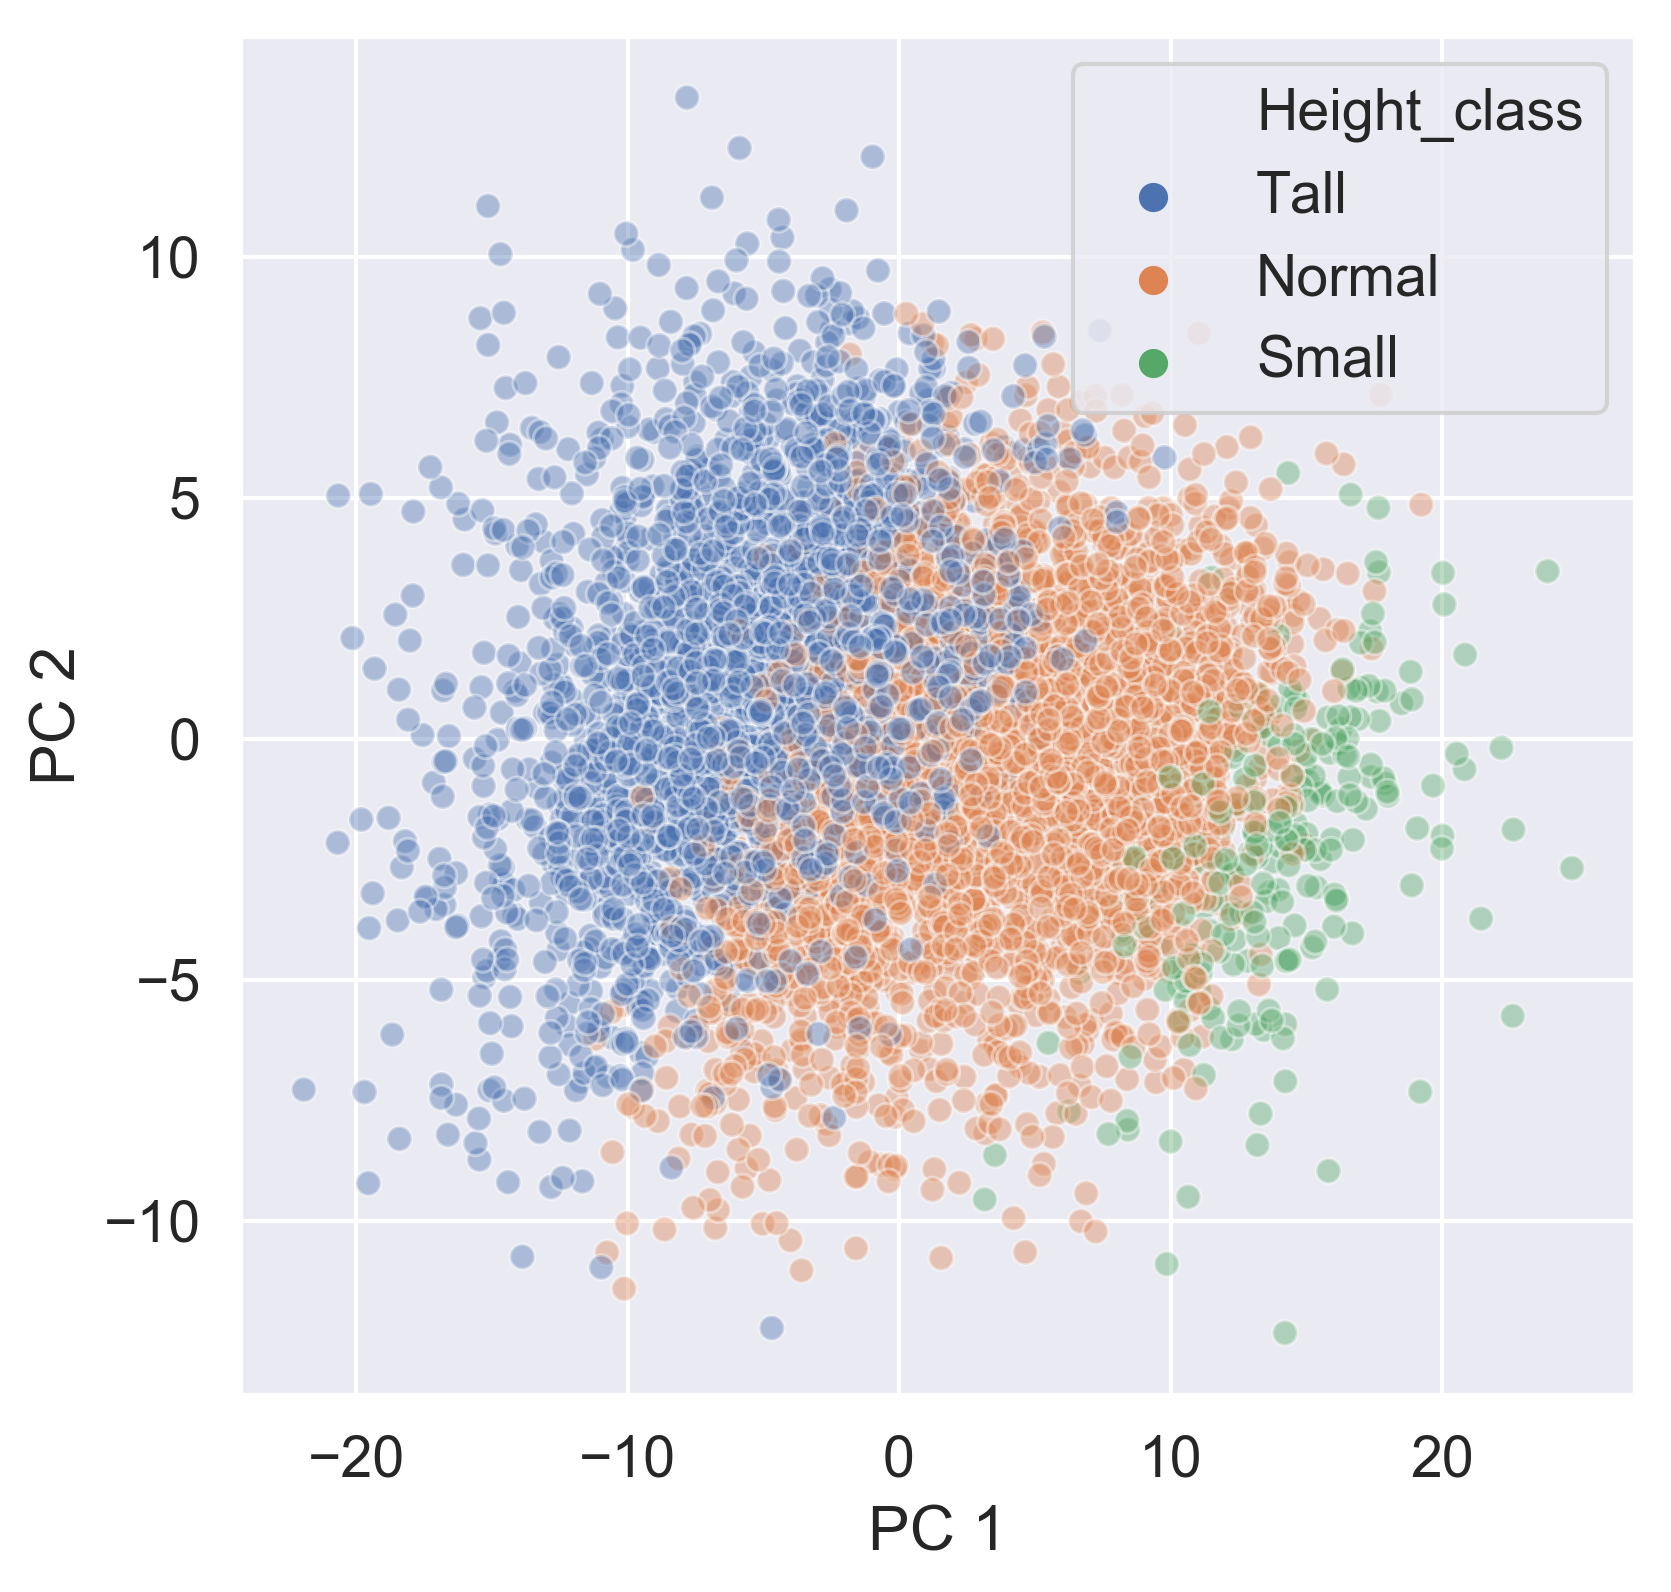
依身高分類的主成分

Python 的降維

在 pipeline 中使用 PCA

from sklearn.preprocessing import StandardScaler
from sklearn.decomposition import PCA
from sklearn.pipeline import Pipeline

pipe = Pipeline([
        ('scaler', StandardScaler()),
        ('reducer', PCA())])

pc = pipe.fit_transform(ansur_df) print(pc[:,:2])
array([[-3.46114925,  1.5785215 ],
       [ 0.90860615,  2.02379935],
       ...,
       [10.7569818 , -1.40222755],
       [ 7.64802025,  1.07406209]])
Python 的降維

檢視類別型特徵的影響

print(ansur_categories.head())
   Branch                  Component     Gender  BMI_class   Height_class
0  Combat Arms             Regular Army  Male    Overweight  Tall
1  Combat Support          Regular Army  Male    Overweight  Normal
2  Combat Support          Regular Army  Male    Overweight  Normal
3  Combat Service Support  Regular Army  Male    Overweight  Normal
4  Combat Service Support  Regular Army  Male    Overweight  Tall
Python 的降維

檢視類別型特徵的影響

ansur_categories['PC 1'] = pc[:,0]
ansur_categories['PC 2'] = pc[:,1]

sns.scatterplot(data=ansur_categories, x='PC 1', y='PC 2', hue='Height_class', alpha=0.4)

依身高分類的主成分

Python 的降維

檢視類別型特徵的影響

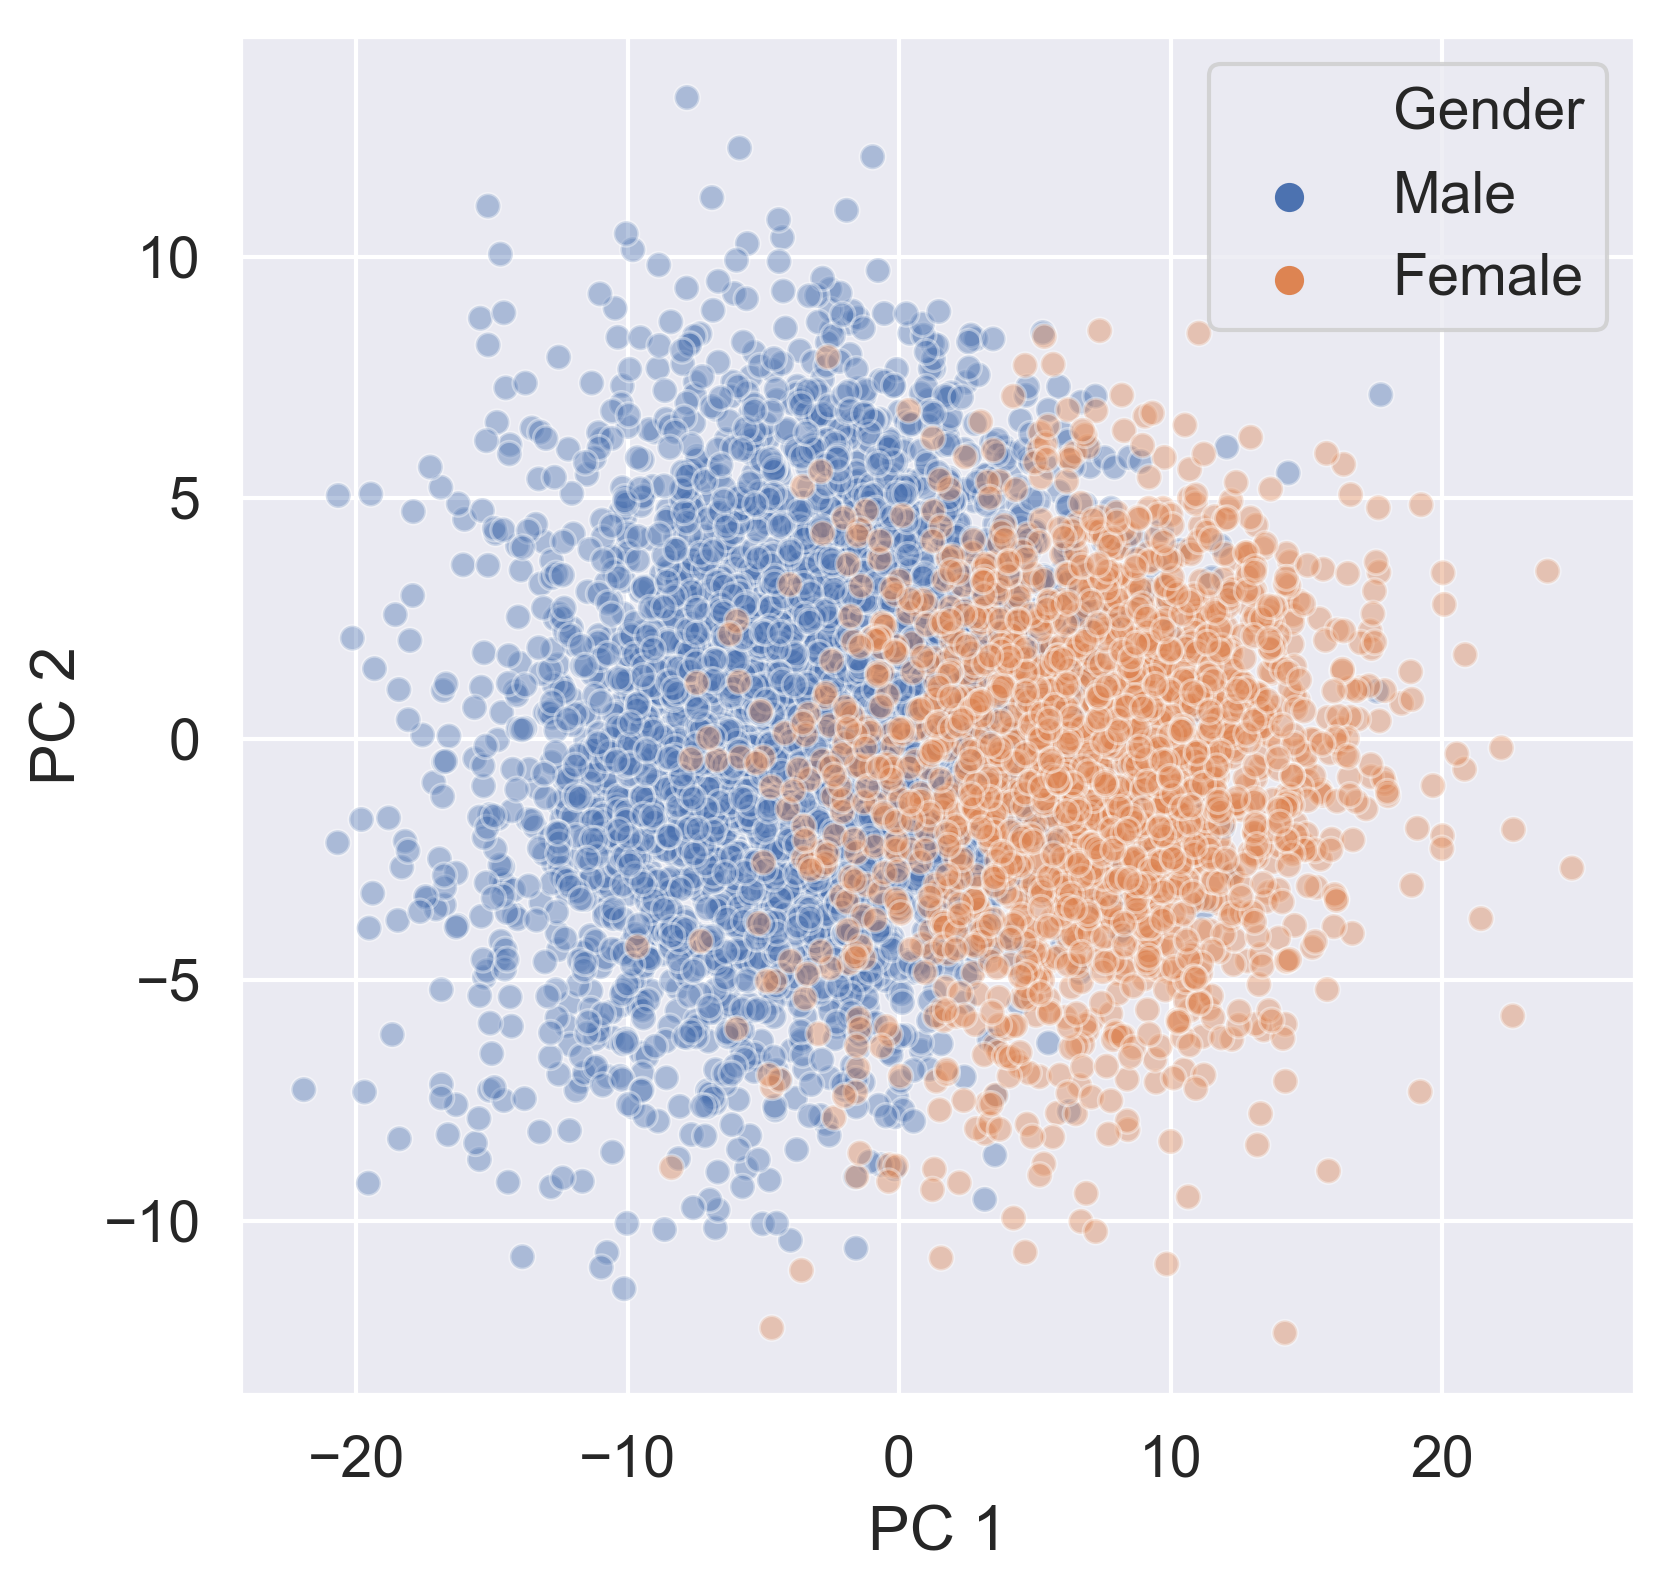
sns.scatterplot(data=ansur_categories, 
                x='PC 1', y='PC 2', 
                hue='Gender', alpha=0.4)

依性別分類的主成分

Python 的降維

檢視類別型特徵的影響

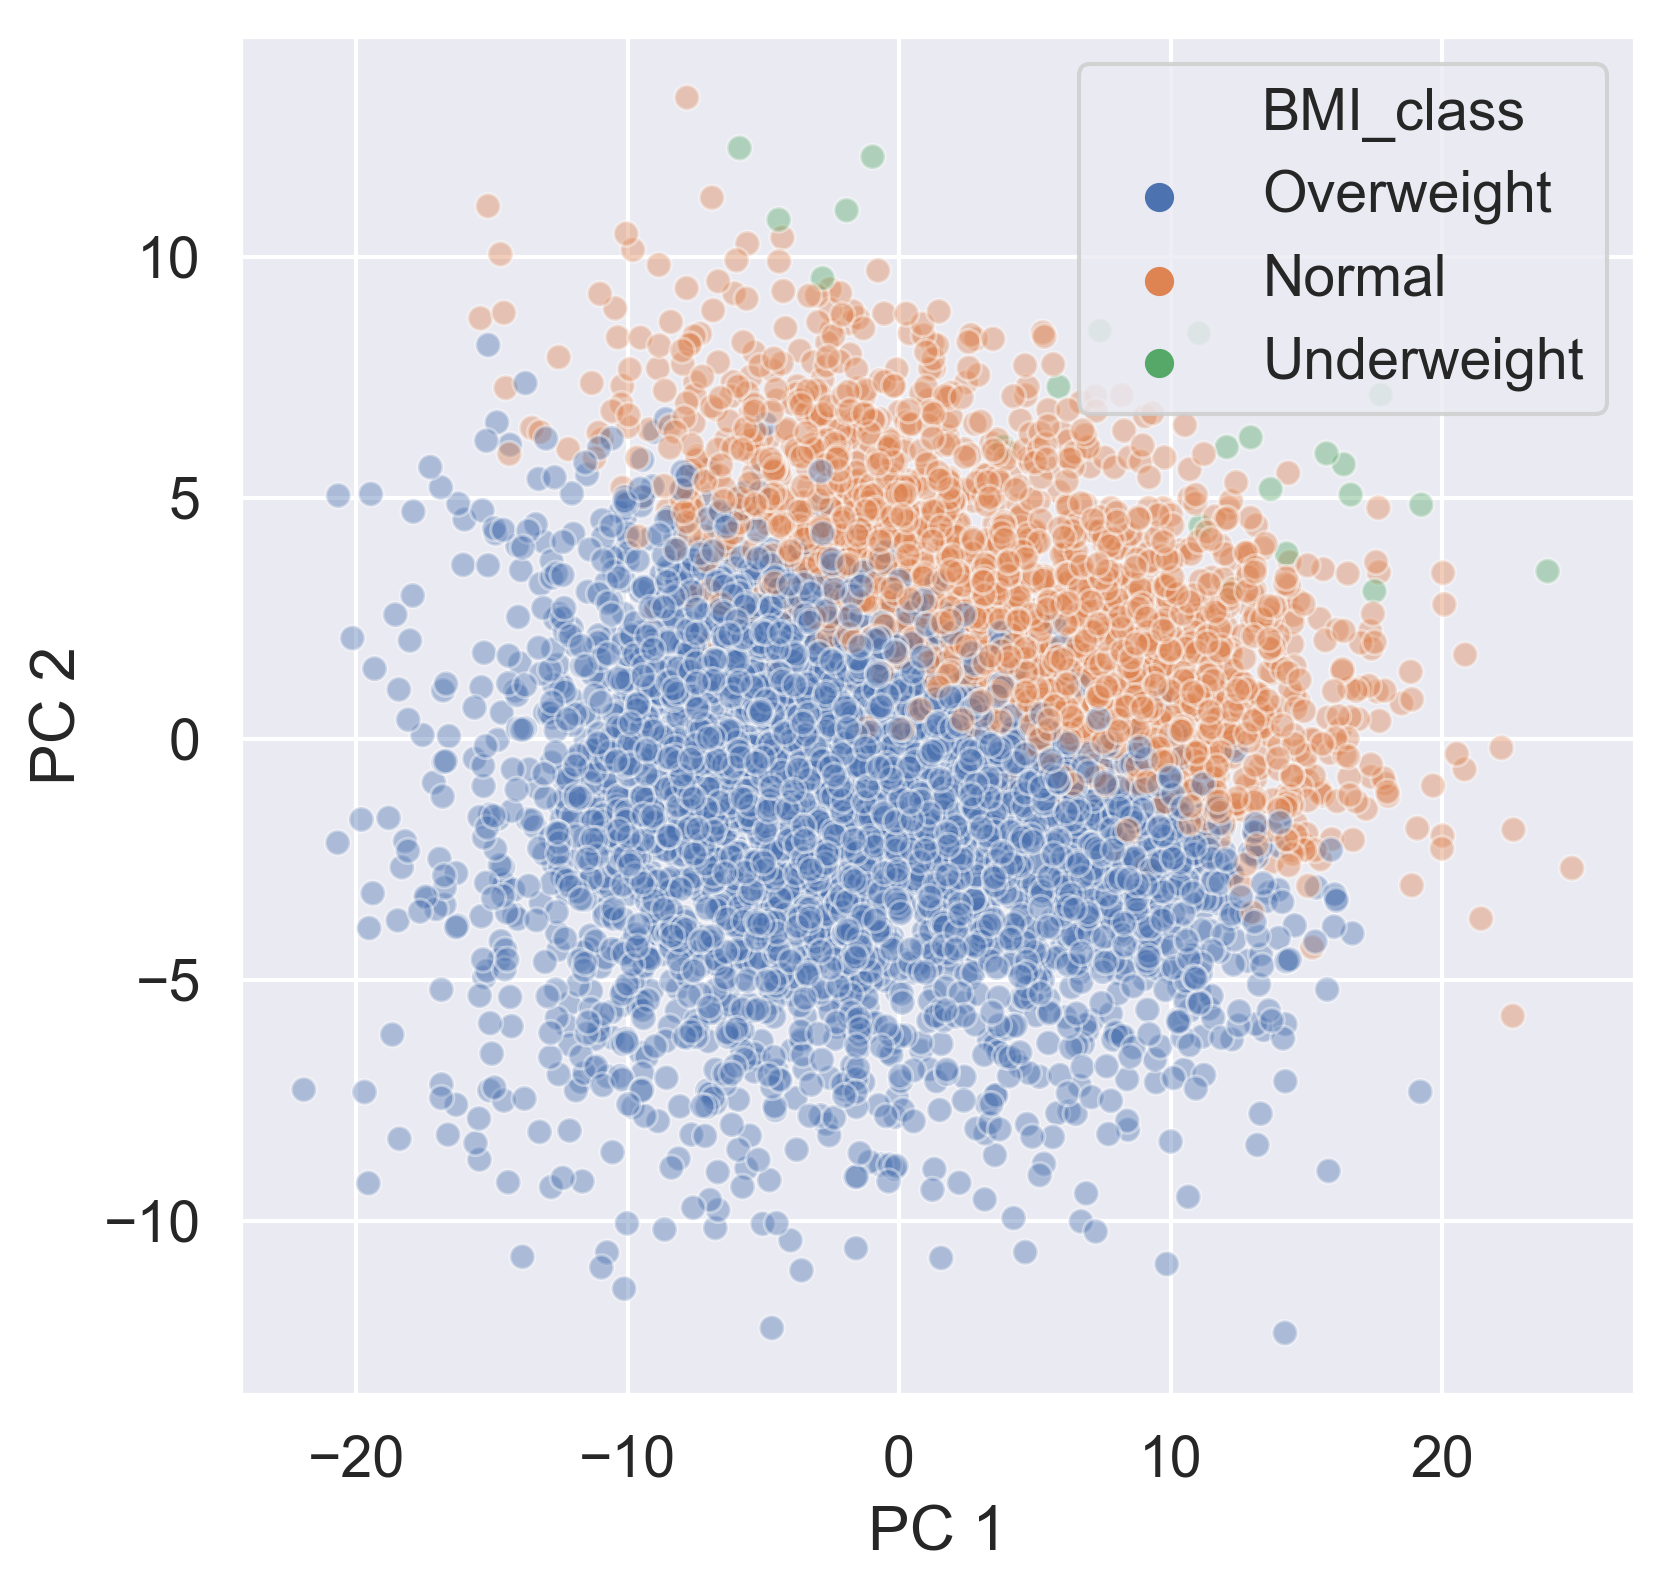
sns.scatterplot(data=ansur_categories, 
                x='PC 1', y='PC 2', 
                hue='BMI_class', alpha=0.4)

依 BMI 分類的主成分

Python 的降維

模型 pipeline 中的 PCA

pipe = Pipeline([
        ('scaler', StandardScaler()),
        ('reducer', PCA(n_components=3)),
        ('classifier', RandomForestClassifier())])

print(pipe['reducer'])
PCA(n_components=3)
Python 的降維

模型 pipeline 中的 PCA

pipe.fit(X_train, y_train)

pipe['reducer'].explained_variance_ratio_
array([0.56, 0.13, 0.05])
pipe['reducer'].explained_variance_ratio_.sum()
0.74
print(pipe.score(X_test, y_test))
0.986
Python 的降維

一起來練習吧!

Python 的降維

Preparing Video For Download...