便利抽樣

R 的抽樣

Richie Cotton

Data Evangelist at DataCamp

《Literary Digest》的選舉預測
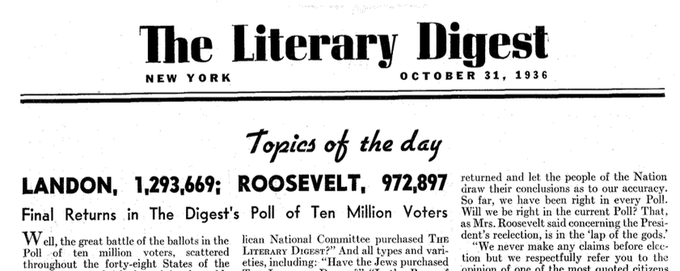
《Literary Digest》1936 年頭版,顯示選舉預測標題。預測 Landon 可得 130 萬票,Roosevelt 略低於 100 萬票。

  • 預測:Landon 57%;Roosevelt 43%
  • 實際:Landon 38%;Roosevelt 62%
  • 樣本不具代表性,造成「抽樣偏誤」。
  • 以最省事的方法蒐集資料稱為「便利抽樣」。
R 的抽樣

估計法國人的平均年齡

巴黎迪士尼樂園照片。

  • 在巴黎迪士尼訪談 10 人。
  • 他們的平均年齡為 24.6 歲。
  • 這能代表全法國的平均嗎?
1 Image by Sean MacEntee
R 的抽樣

這份調查有多準確?

年份 法國平均年齡
1975 31.6
1985 33.6
1995 36.2
2005 38.9
2015 41.2
  • 24.6 歲是個很差的估計。
  • 去迪士尼的人不代表整體人口。
R 的抽樣

便利抽樣的咖啡評分

coffee_ratings %>% 
  summarize(mean_cup_points = mean(total_cup_points))
  mean_cup_points
1           82.09
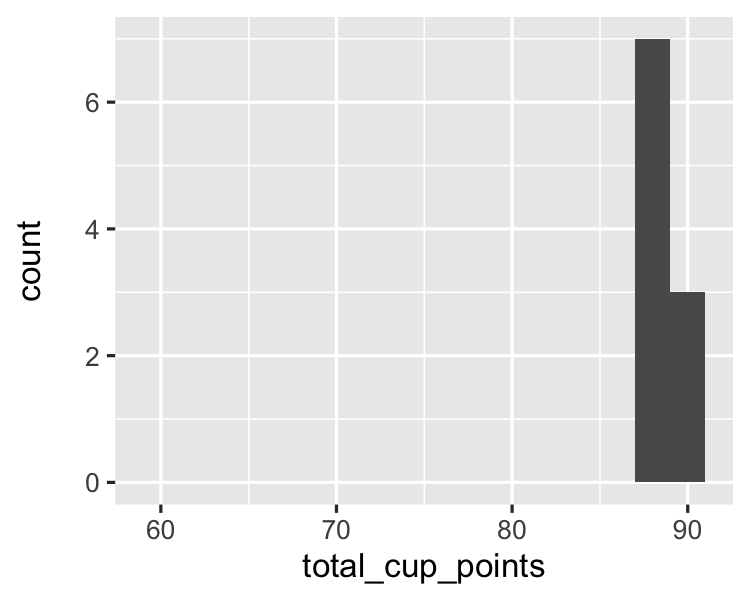
coffee_ratings_first10 <- coffee_ratings %>% 
  slice_head(n = 10)
coffee_ratings_first10 %>% 
  summarize(mean_cup_points = mean(total_cup_points))
  mean_cup_points
1            89.1
R 的抽樣

視覺化選擇偏差

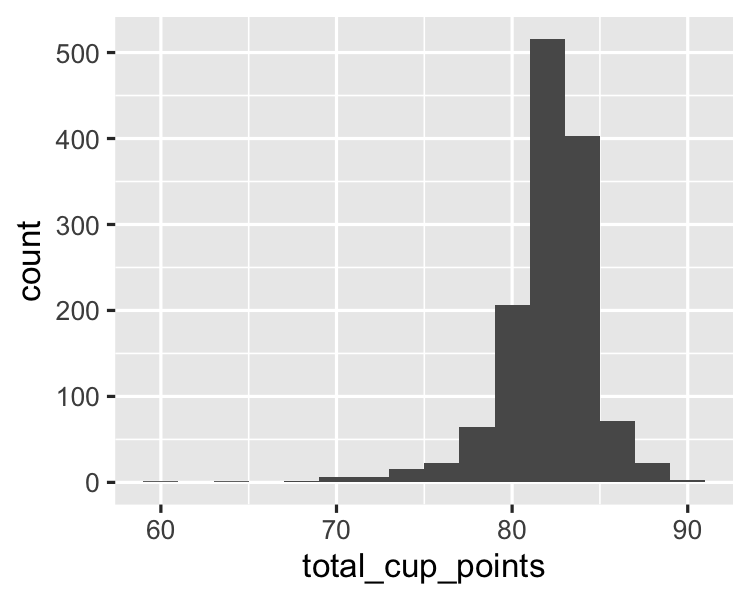
coffee_ratings %>%
  ggplot(aes(x = total_cup_points)) +
  geom_histogram(binwidth = 2)

母體的杯測分數直方圖。

coffee_ratings_first10 %>%
  ggplot(aes(x = total_cup_points)) +
  geom_histogram(binwidth = 2) +
  xlim(59, 91)

樣本的杯測分數直方圖。

R 的抽樣

視覺化選擇偏差 2

coffee_ratings %>%
  ggplot(aes(x = total_cup_points)) +
  geom_histogram(binwidth = 2) 

母體的杯測分數直方圖。

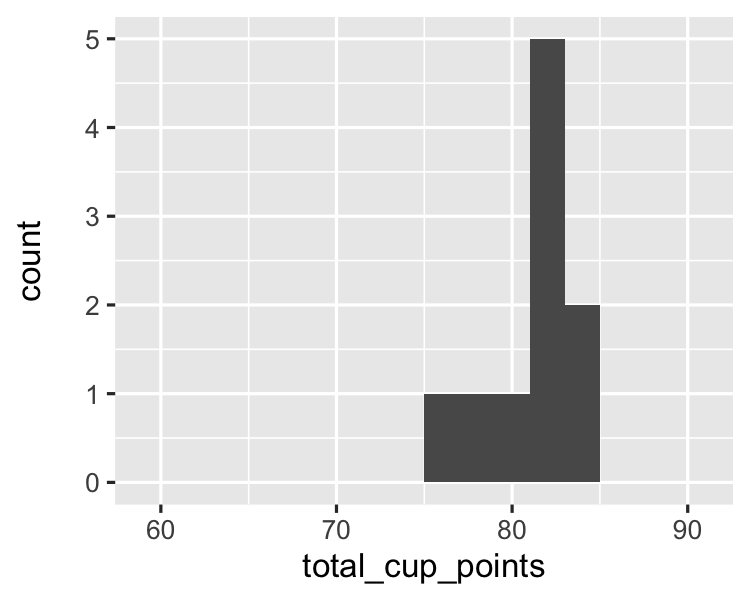
coffee_ratings %>%
  slice_sample(n = 10) %>% 
  ggplot(aes(x = total_cup_points)) +
  geom_histogram(binwidth = 2) +
  xlim(59, 91)

隨機樣本的杯測分數直方圖。

R 的抽樣

一起來練習吧!

R 的抽樣

Preparing Video For Download...