點估計的相對誤差

R 的抽樣

Richie Cotton

Data Evangelist at DataCamp

樣本是列數

coffee_ratings %>% 
  slice_sample(n = 300) %>% 
  nrow()
300
coffee_ratings %>% 
  slice_sample(prop = 0.25) %>% 
  nrow()
334
R 的抽樣

不同樣本大小

coffee_ratings %>% 
  summarize(mean_points = mean(total_cup_points)) %>% 
  pull(mean_points)

82.15
coffee_ratings %>% 
  slice_sample(n = 10) %>% 
  summarize(mean_points = mean(total_cup_points)) %>% 
  pull(mean_points)
82.82
coffee_ratings %>% 
  slice_sample(n = 100) %>% 
  summarize(mean_points = mean(total_cup_points)) %>% 
  pull(mean_points)
82.02
coffee_ratings %>% 
  slice_sample(n = 1000) %>% 
  summarize(mean_points = mean(total_cup_points)) %>% 
  pull(mean_points)
82.16
R 的抽樣

相對誤差

母體母數

population_mean <- coffee_ratings %>% 
  summarize(mean_points = mean(total_cup_points)) %>% 
  pull(mean_points)

點估計

sample_mean <- coffee_ratings %>% 
  slice_sample(n = sample_size) %>% 
  summarize(mean_points = mean(total_cup_points)) %>% 
  pull(mean_points)

百分比相對誤差

100 * abs(population_mean - sample_mean) / population_mean
R 的抽樣

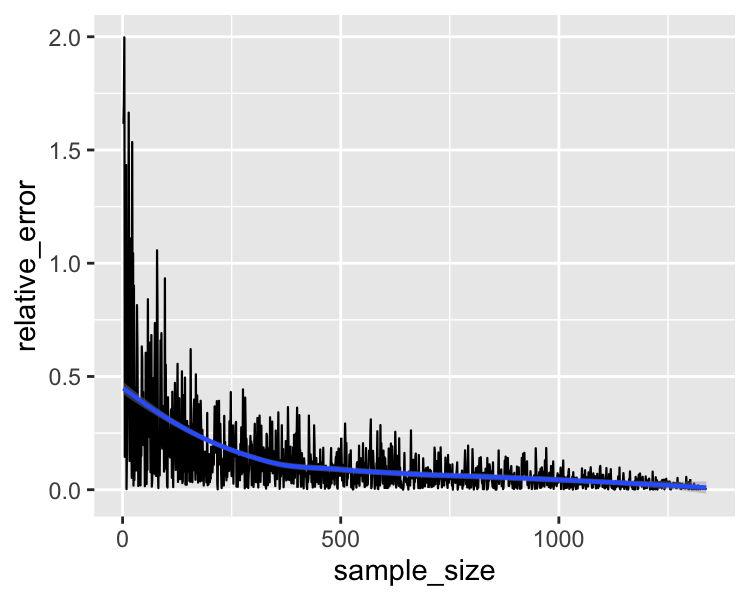
相對誤差 vs. 樣本大小

ggplot(errors, aes(sample_size, relative_error)) +
  geom_line() +
  geom_smooth(method = "loess")

相對誤差對樣本大小的散佈圖。

R 的抽樣

一起來練習吧!

R 的抽樣

Preparing Video For Download...