選擇 Seaborn 圖表
Seaborn 資料視覺化中級

Chris Moffitt
Instructor
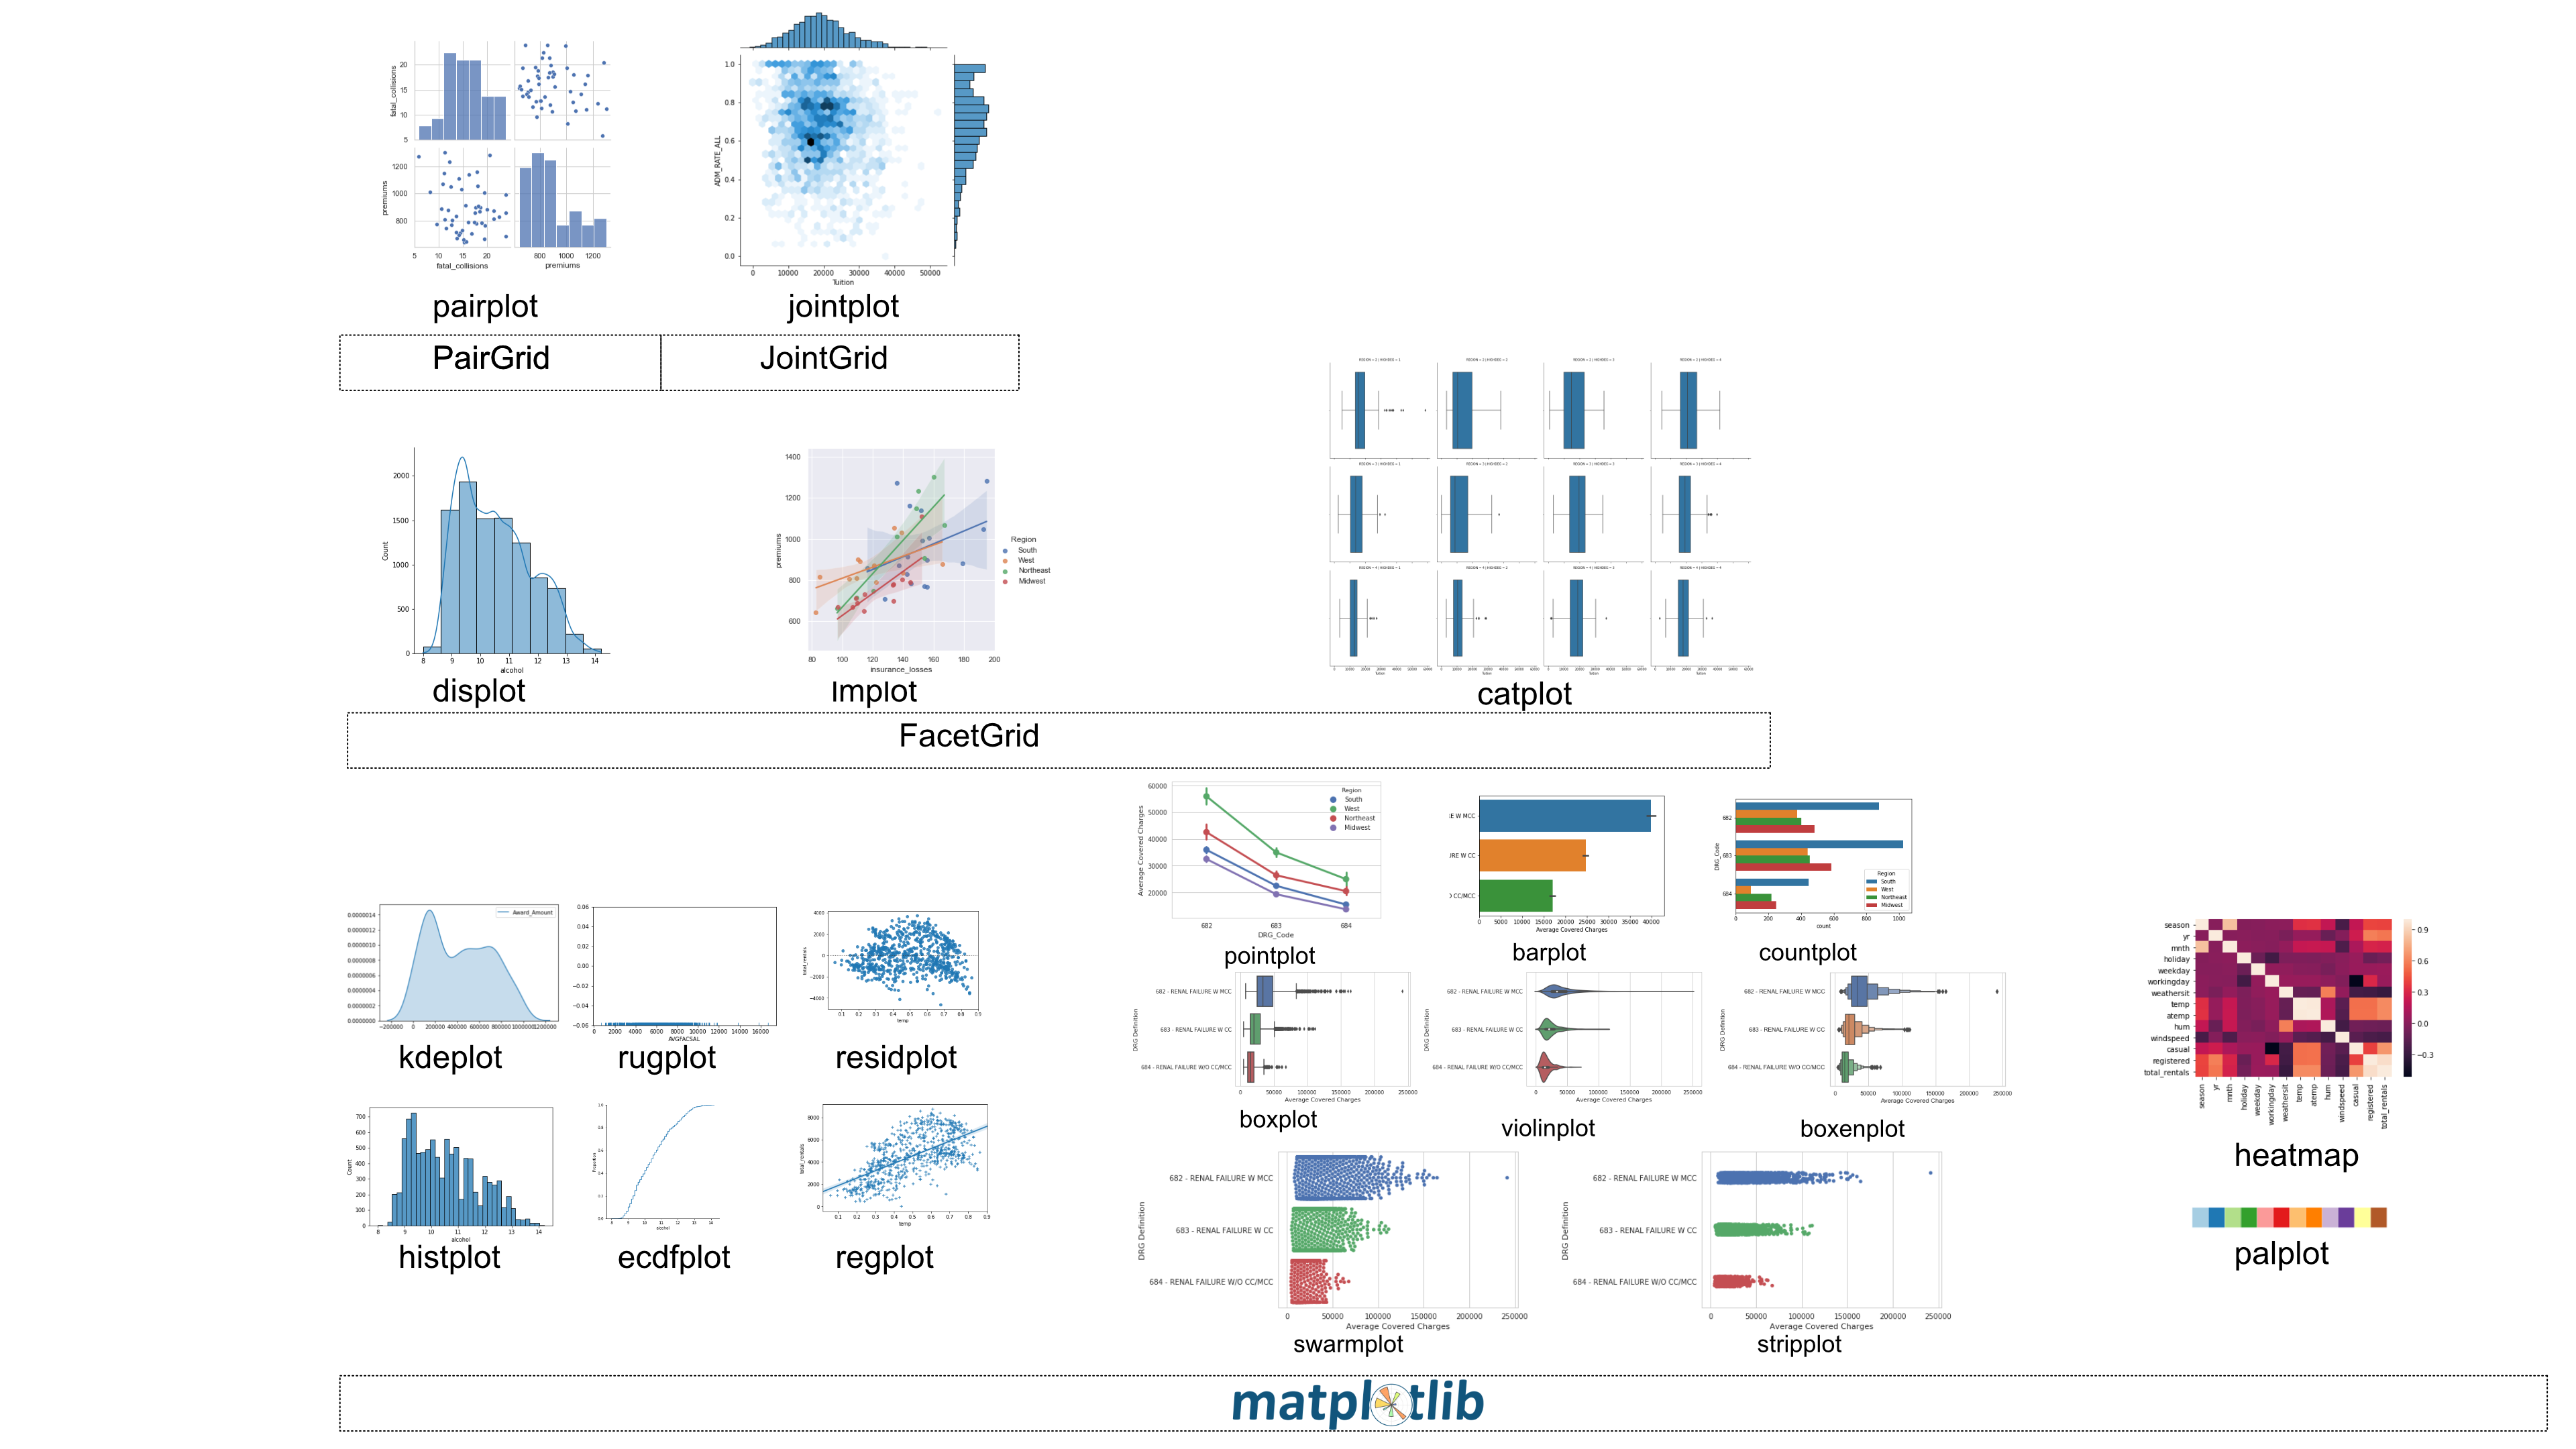
單變量分佈分析
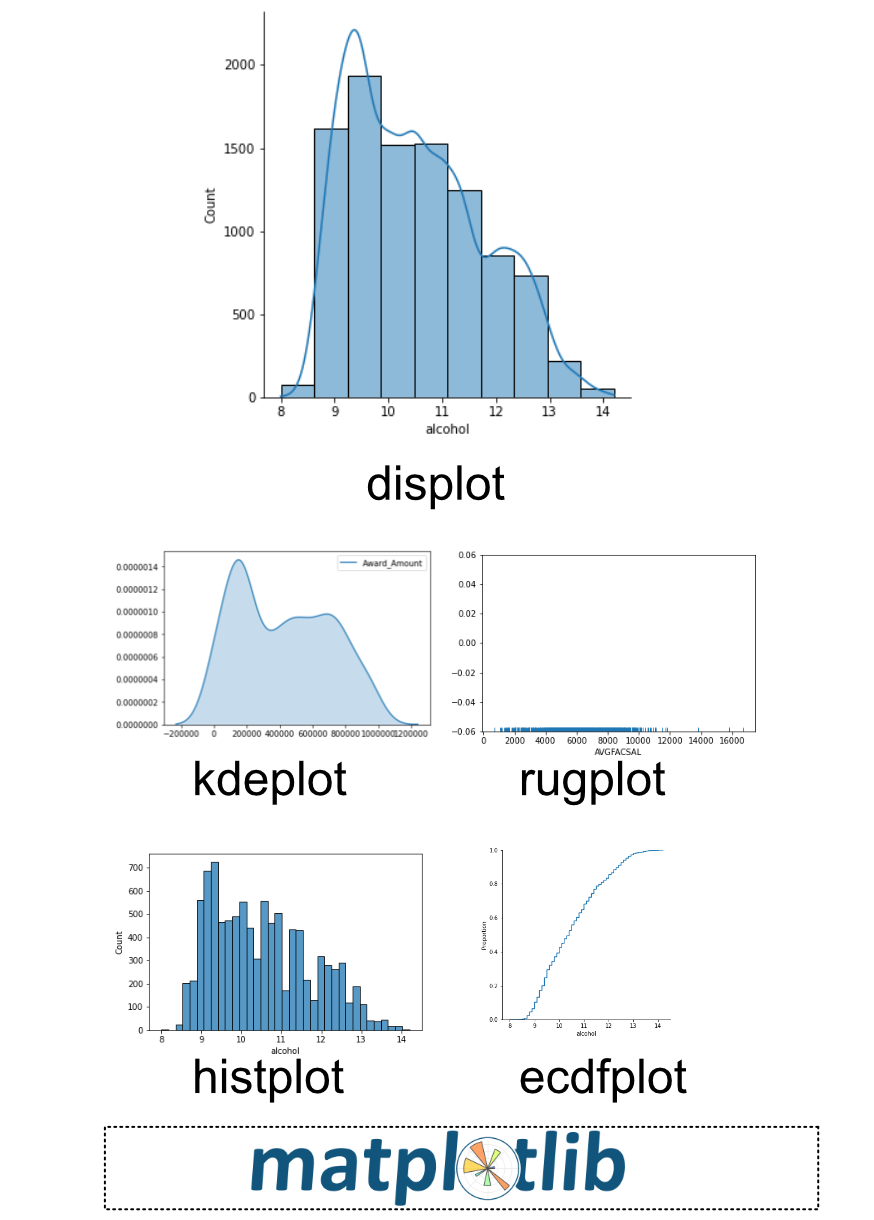
- 這個分析首選
displot() rugplot()、kdeplot()、ecdfplot()也是可用替代方案
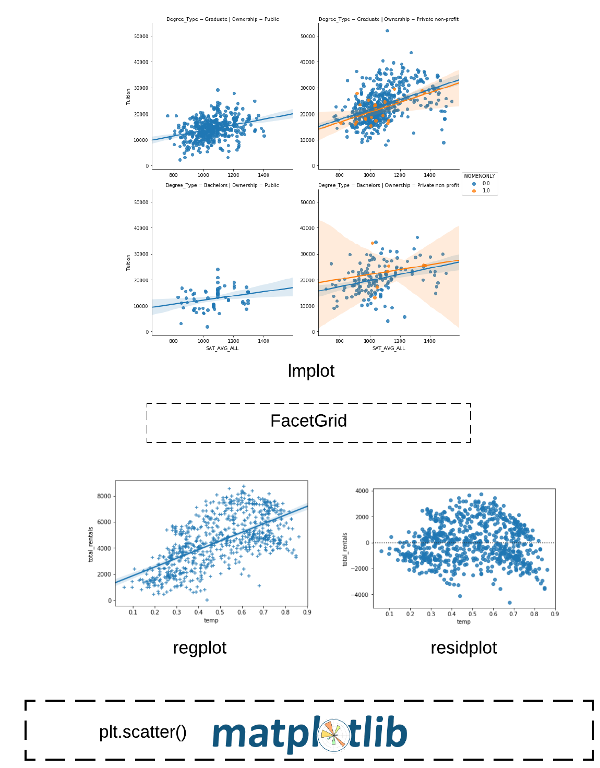
迴歸分析
lmplot()可做迴歸分析,並支援分面
類別圖
- 使用類別圖探索資料,並用
catplot分面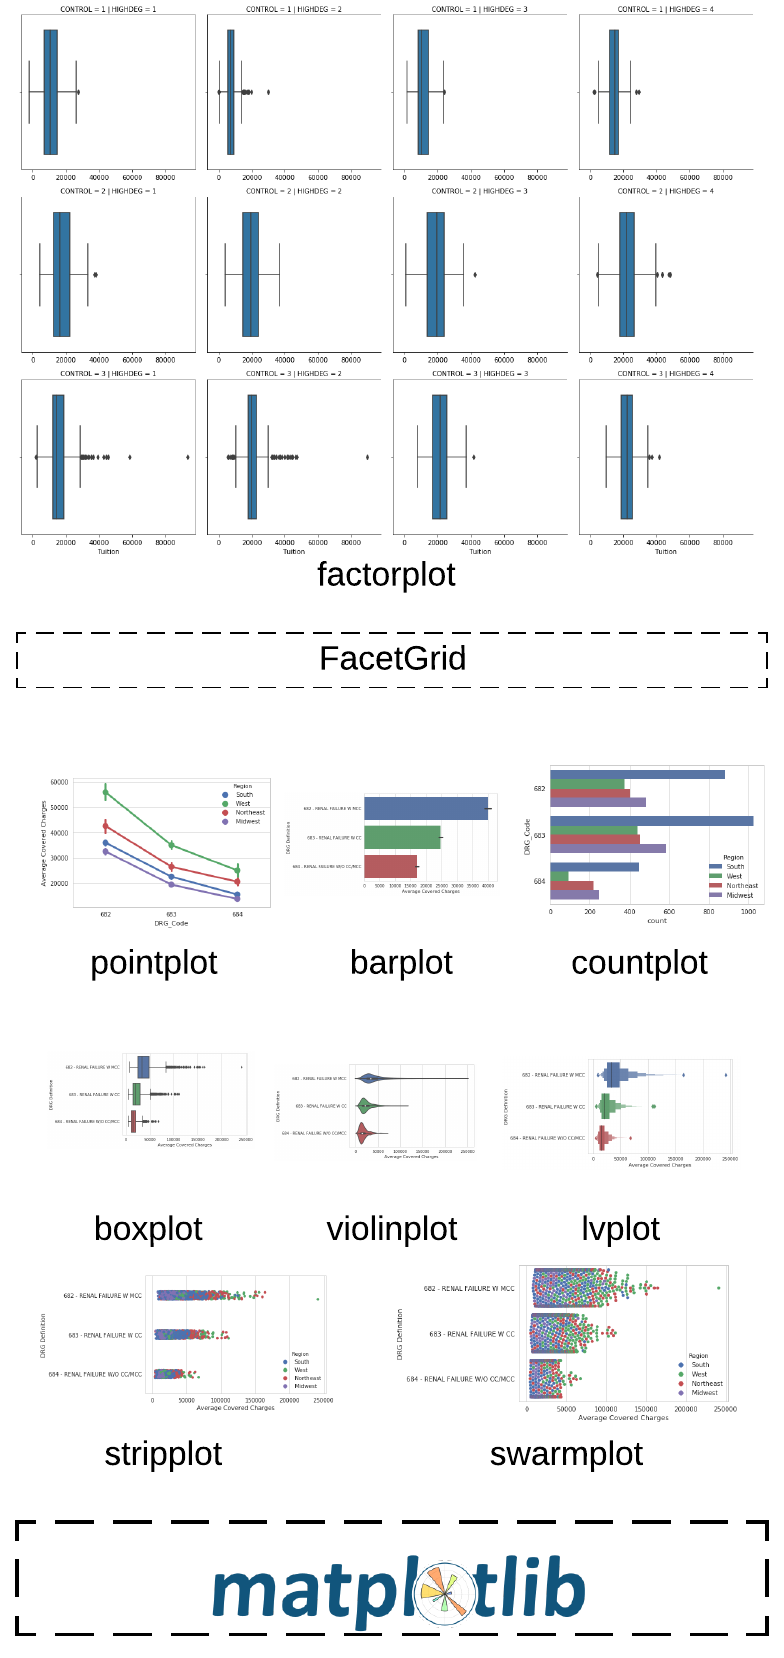
pairplot() 與 jointplot()
- 使用
lmplot進行迴歸分析 - 使用
displot分析分佈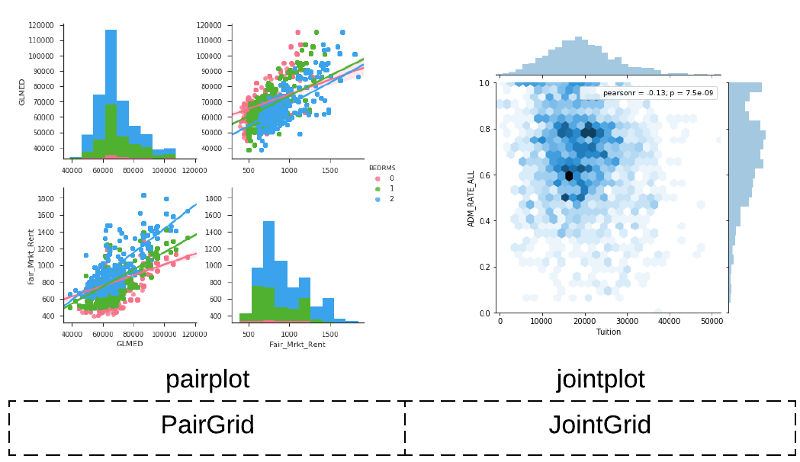
Seaborn 資料視覺化中級
Chris Moffitt
Instructor
displot()rugplot()、kdeplot()、ecdfplot() 也是可用替代方案
lmplot() 可做迴歸分析,並支援分面
catplot 分面
lmplot 進行迴歸分析displot 分析分佈

