使用 FacetGrid、catplot 和 lmplot
Seaborn 資料視覺化中級

Chris Moffitt
Instructor
Tidy data(整潔資料)
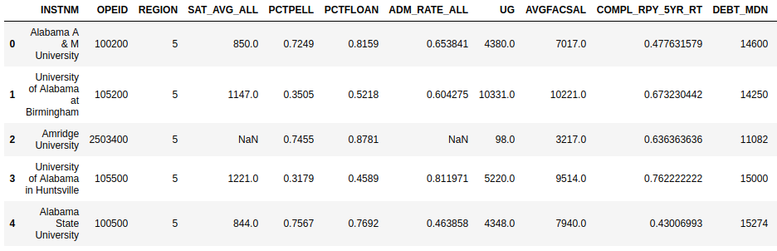
- Seaborn 的網格圖需要「tidy format」資料
- 每列代表 1 筆觀測
FacetGrid 分類範例
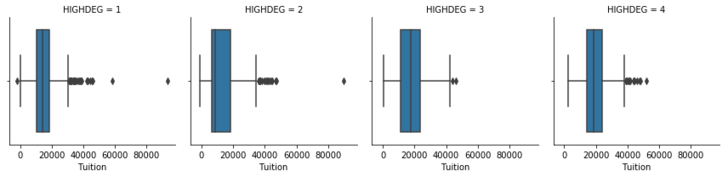
g = sns.FacetGrid(df, col='HIGHDEG')
g.map(sns.boxplot, 'Tuition',
      order=['1', '2', '3', '4'])
catplot()
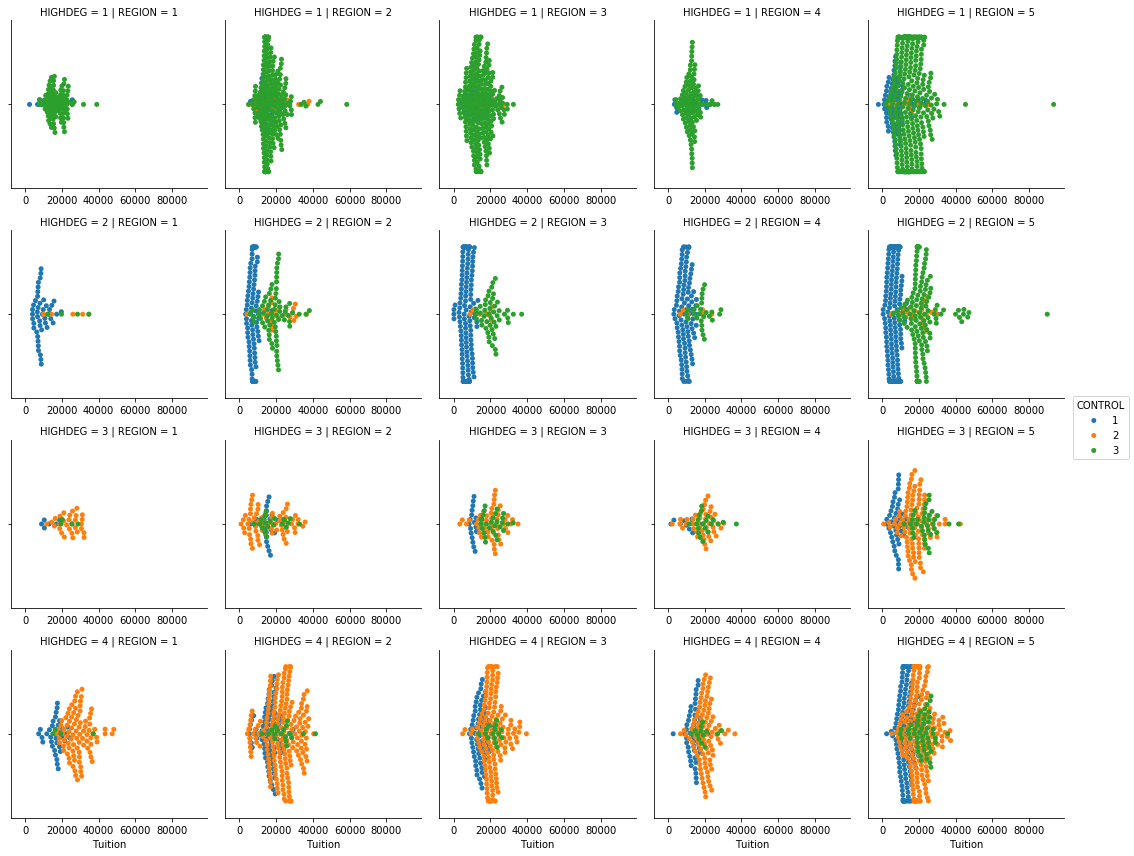
catplot以更簡單方式在FacetGrid上畫分類資料- 將分面與對應合併為 1 個函式
sns.catplot(x="Tuition", data=df,
            col="HIGHDEG", kind="box")
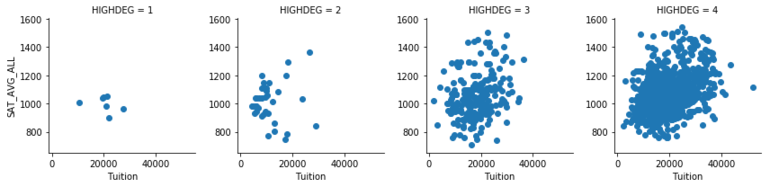
用 FacetGrid 畫迴歸
FacetGrid()也可用於散佈圖或迴歸圖
g = sns.FacetGrid(df, col='HIGHDEG')
g.map(plt.scatter, 'Tuition', 'SAT_AVG_ALL')
lmplot
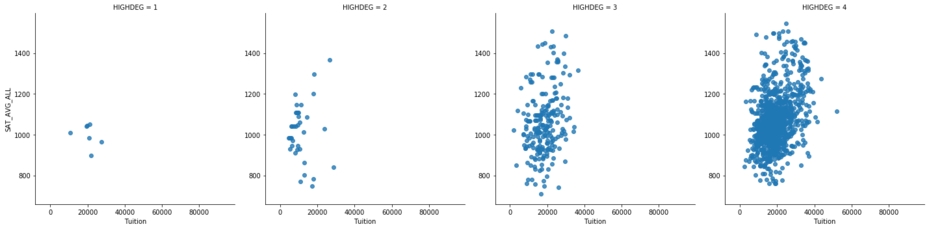
lmplot在FacetGrid上繪製散佈與迴歸圖
sns.lmplot(data=df, x="Tuition", y="SAT_AVG_ALL",
           col="HIGHDEG", fit_reg=False)
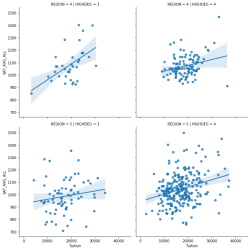
含迴歸的 lmplot
sns.lmplot(data=df, x="Tuition", y="SAT_AVG_ALL",
           col="HIGHDEG", row="REGION")