類別型圖表
Seaborn 資料視覺化中級

Chris Moffitt
Instructor
圖表類型-逐筆觀測
圖表類型-抽象表徵
圖表類型-統計估計
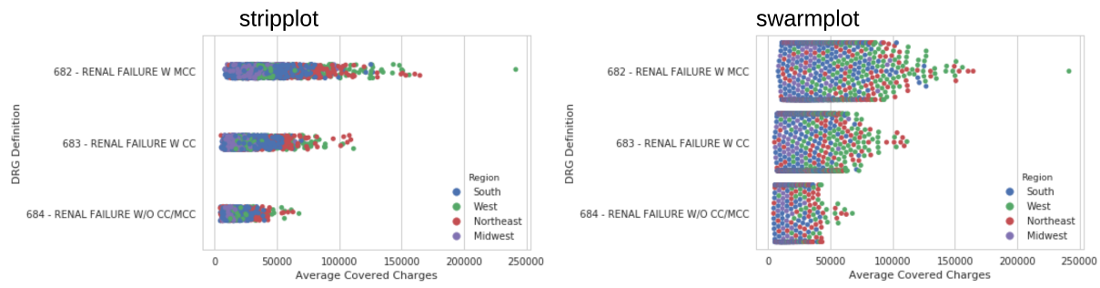
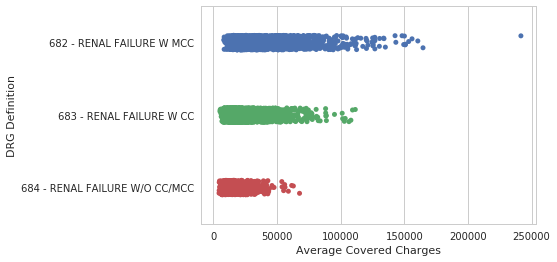
逐筆觀測圖-stripplot
sns.stripplot(data=df, y="DRG Definition",
              x="Average Covered Charges",
              jitter=True)
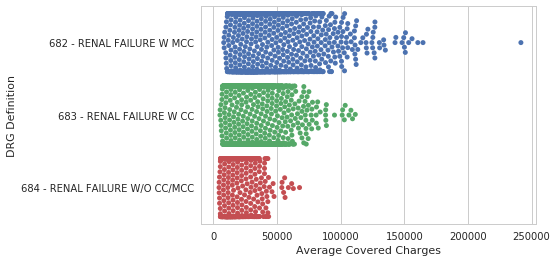
逐筆觀測圖-swarmplot
sns.swarmplot(data=df, y="DRG Definition",
              x="Average Covered Charges")
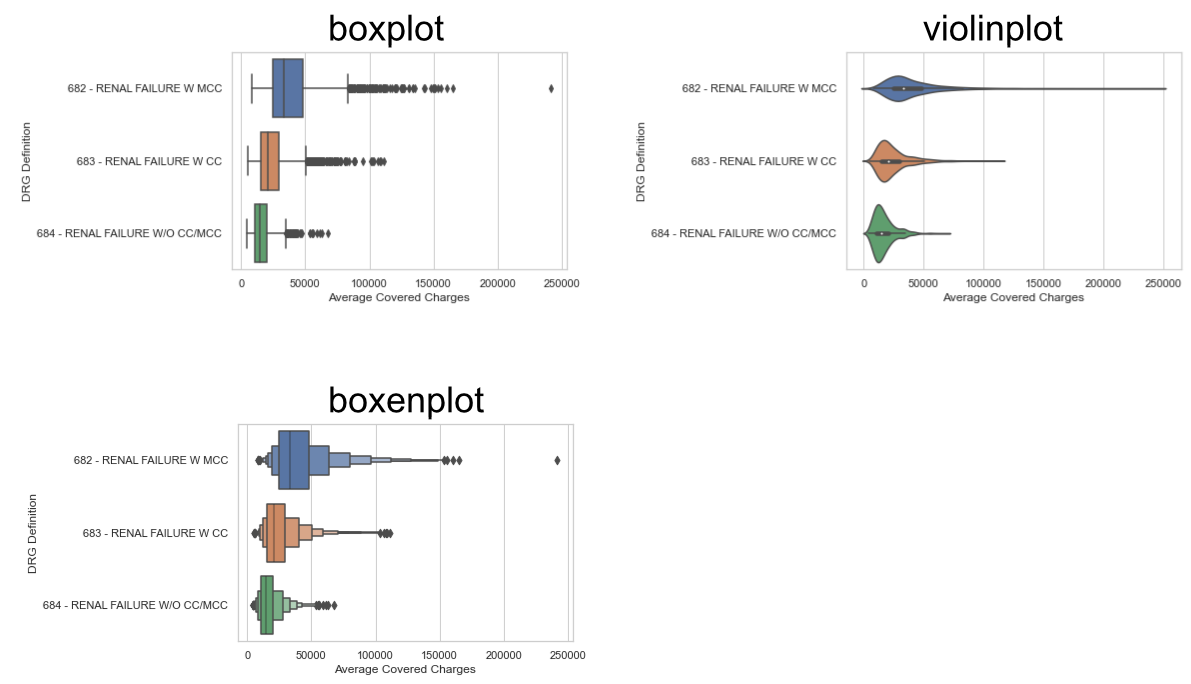
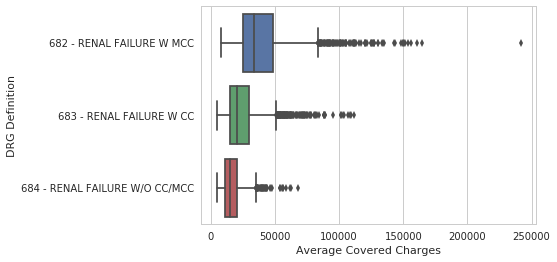
抽象表徵-boxplot
sns.boxplot(data=df, y="DRG Definition",
            x="Average Covered Charges")
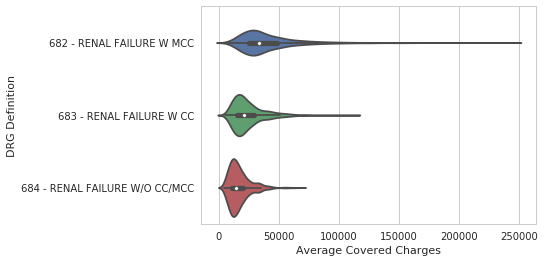
抽象表徵-violinplot
sns.violinplot(data=df, y="DRG Definition",
               x="Average Covered Charges")
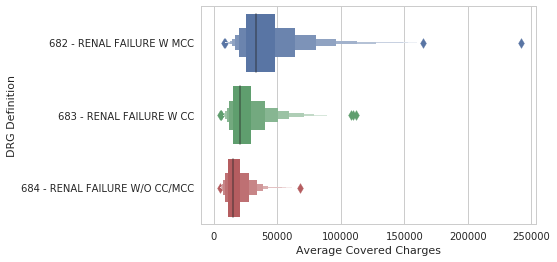
抽象表徵-boxenplot
sns.boxenplot(data=df, y="DRG Definition",
              x="Average Covered Charges")
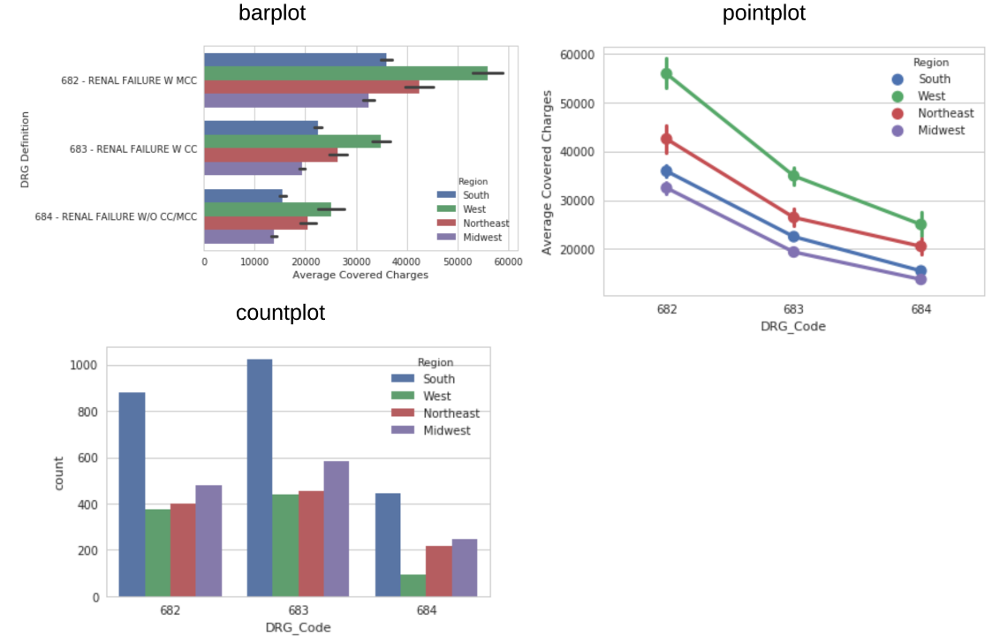
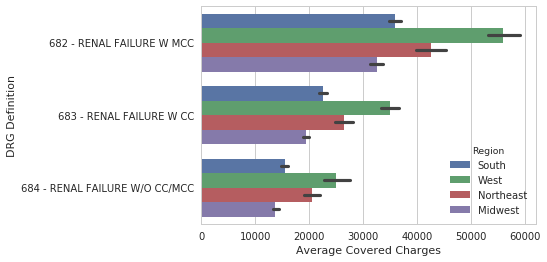
統計估計-barplot
sns.barplot(data=df, y="DRG Definition",
            x="Average Covered Charges",
            hue="Region")
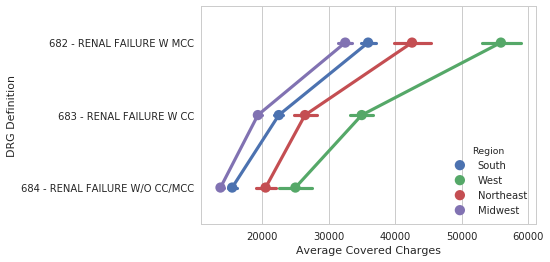
統計估計-pointplot
sns.pointplot(data=df, y="DRG Definition",
              x="Average Covered Charges",
              hue="Region")
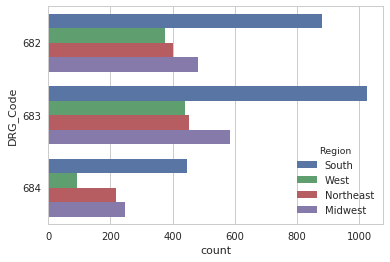
統計估計-countplot
sns.countplot(data=df, y="DRG_Code", hue="Region")