Seaborn 的迴歸圖
Seaborn 資料視覺化中級

Chris Moffitt
Instructor
regplot 入門
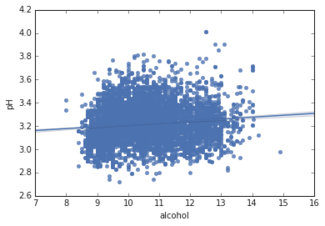
regplot會繪製散佈圖並加上迴歸線- 用法與
displot類似 - 必須設定
data、x、y變數
sns.regplot(data=df, x="alcohol", y="pH" )
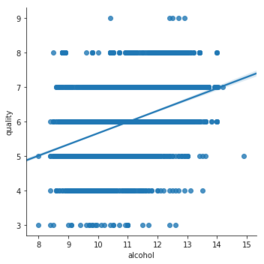
lmplot() 建立在基礎的 regplot() 之上
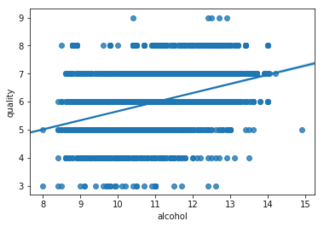
regplot-低階
sns.regplot(data=df,
            x="alcohol",
            y="quality")
lmplot-高階
sns.lmplot(data=df,
           x="alcohol",
           y="quality")
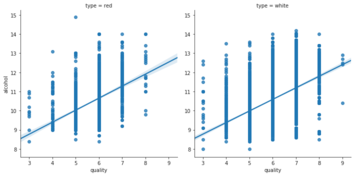
lmplot 分面
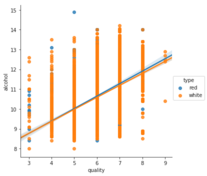
- 以顏色分組(
hue)
sns.lmplot(data=df,
           x="quality",
           y="alcohol",
           hue="type")
- 以欄分面(
col)
sns.lmplot(data=df,
           x="quality",
           y="alcohol",
           col="type")