迴歸圖
Seaborn 資料視覺化中級

Chris Moffitt
Instructor
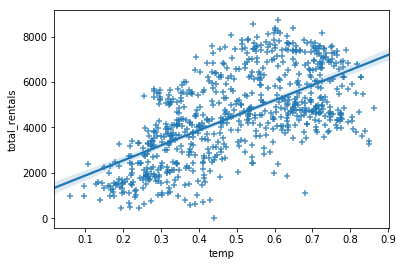
使用 regplot() 繪圖
sns.regplot(data=df, x='temp',
            y='total_rentals', marker='+')
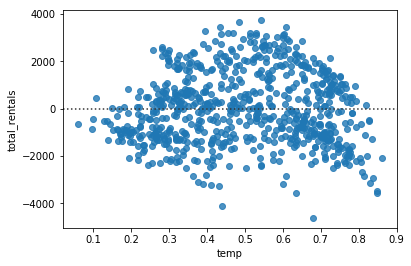
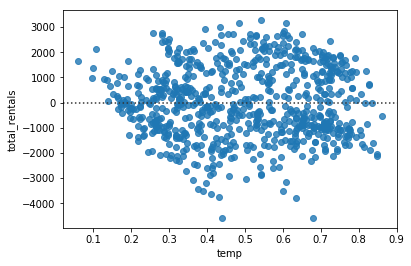
用 residplot() 評估迴歸
- 殘差圖可用來評估模型擬合
- Seaborn 透過
residplot提供支援
sns.residplot(data=df, x='temp', y='total_rentals')
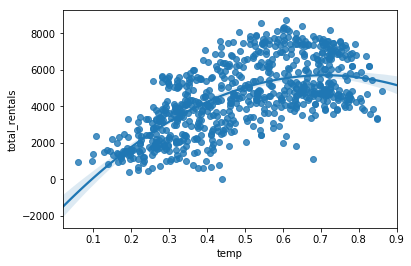
多項式迴歸
- Seaborn 透過
order參數支援多項式迴歸
sns.regplot(data=df, x='temp',
            y='total_rentals', order=2)
多項式迴歸下的 residplot
sns.residplot(data=df, x='temp',
              y='total_rentals', order=2)
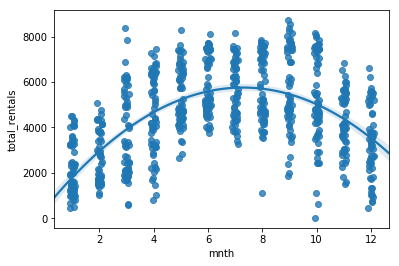
類別型數值
sns.regplot(data=df, x='mnth', y='total_rentals',
            x_jitter=.1, order=2)
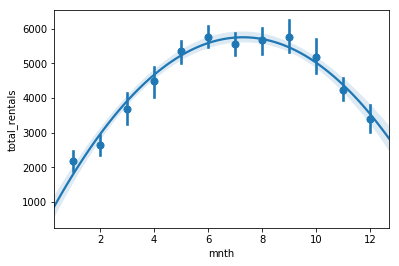
估計量
- 在某些情況,
x_estimator有助於凸顯趨勢
sns.regplot(data=df, x='mnth', y='total_rentals',
            x_estimator=np.mean, order=2)
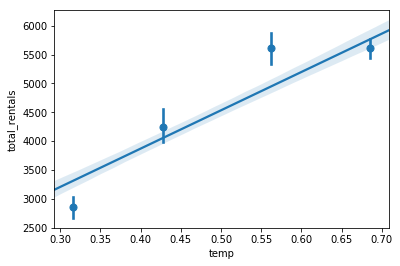
資料分箱
- 可用
x_bins將資料切成數個離散箱 - 迴歸線仍對所有資料擬合
sns.regplot(data=df,x='temp',y='total_rentals',
            x_bins=4)