探索式資料分析入門

Statistical Thinking in Python (Part 1)

Justin Bois

Teaching Professor at the California Institute of Technology

探索式資料分析

  • 組織、繪圖與摘要資料集的流程
Statistical Thinking in Python (Part 1)


「探索式資料分析不會是全部的答案,但沒有其他東西能作為基石。」—John Tukey

Statistical Thinking in Python (Part 1)

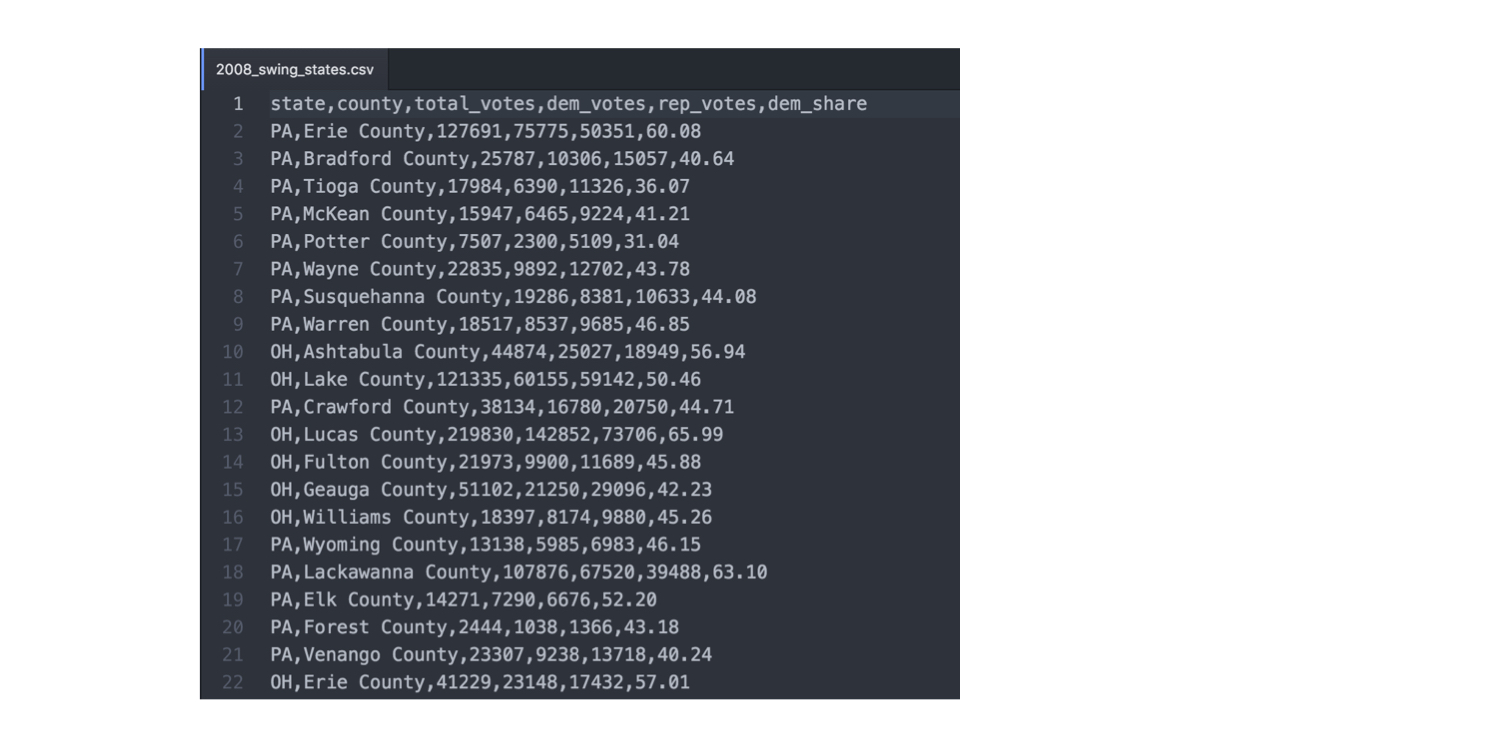
2008 年美國搖擺州選舉結果

第 1 章圖 1.006

1 資料取自 Data.gov (https://www.data.gov/)
Statistical Thinking in Python (Part 1)

2008 年美國搖擺州選舉結果

import pandas as pd
df_swing = pd.read_csv('2008_swing_states.csv')
df_swing[['state', 'county', 'dem_share']]
    state              county  dem_share
0      PA         Erie County      60.08
1      PA     Bradford County      40.64
2      PA        Tioga County      36.07
3      PA       McKean County      41.21
4      PA       Potter County      31.04
5      PA        Wayne County      43.78
6      PA  Susquehanna County      44.08
7      PA       Warren County      46.85
8      OH    Ashtabula County      56.94
1 資料取自 Data.gov (https://www.data.gov/)
Statistical Thinking in Python (Part 1)

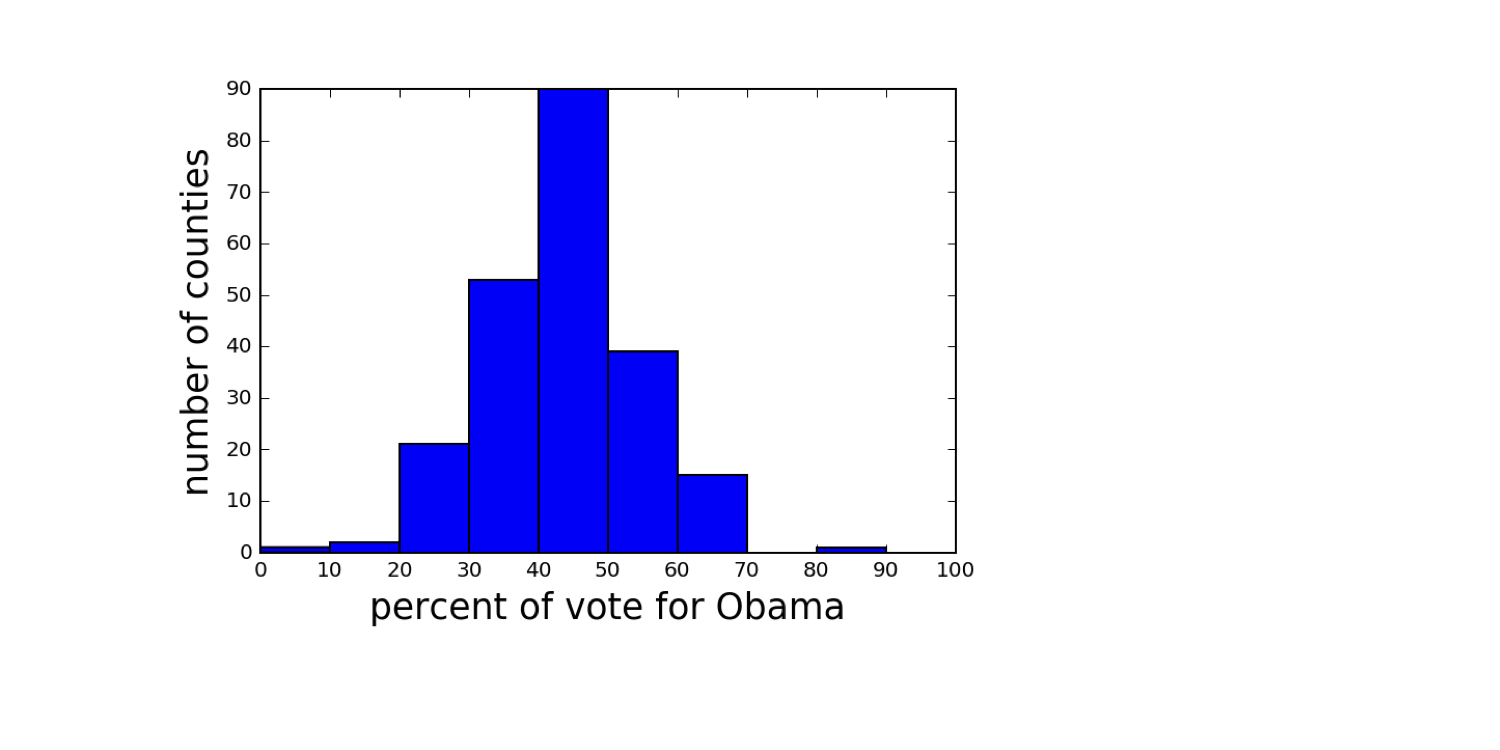
2008 年美國搖擺州選舉結果

第 1 章圖 1.009

1 資料取自 Data.gov (https://www.data.gov/)
Statistical Thinking in Python (Part 1)

一起來練習吧!

Statistical Thinking in Python (Part 1)

Preparing Video For Download...