完整呈現資料:ECDF

Statistical Thinking in Python (Part 1)

Justin Bois

Teaching Professor at the California Institute of Technology

2008 年美國搖擺州選舉結果
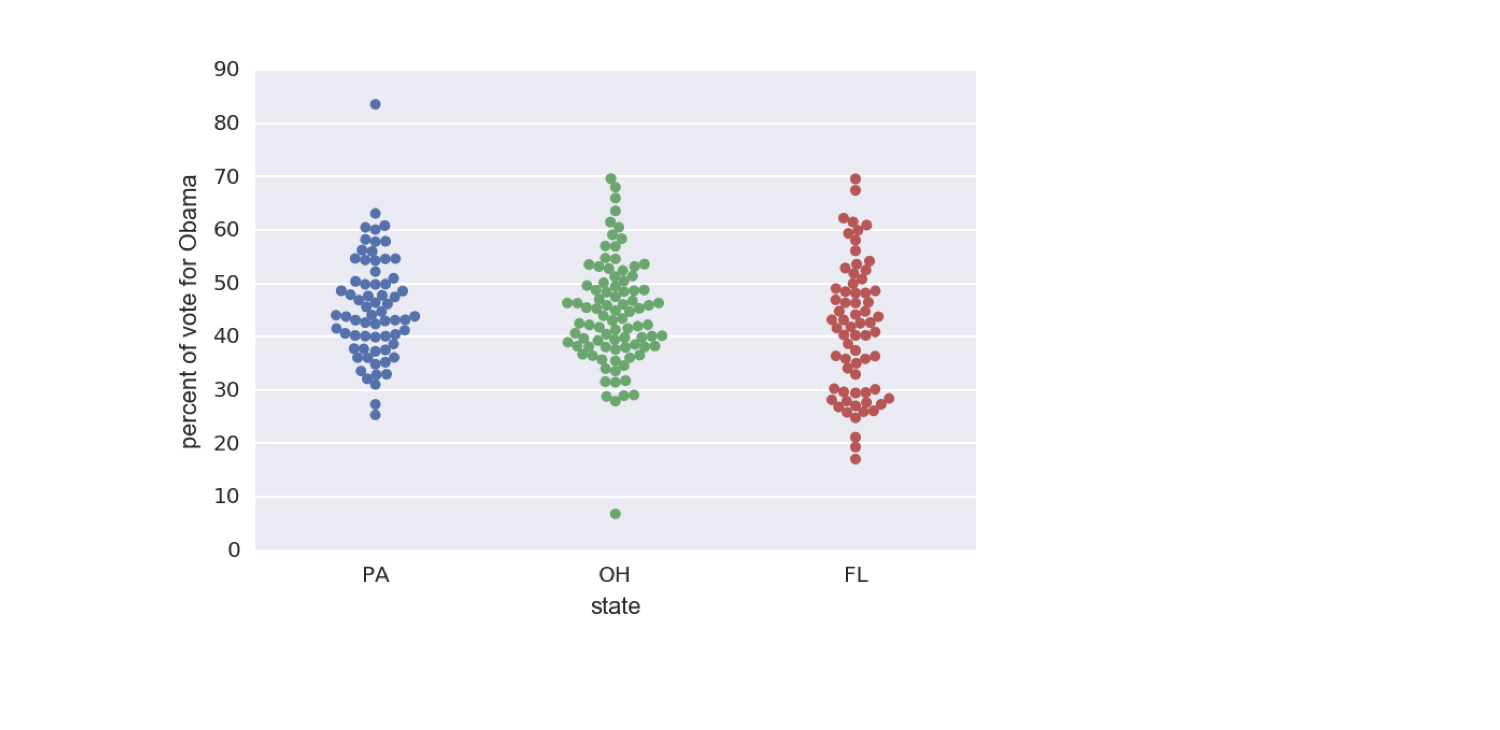
ch1-4_v2.003.png

1 資料取自 Data.gov (https://www.data.gov/)
Statistical Thinking in Python (Part 1)

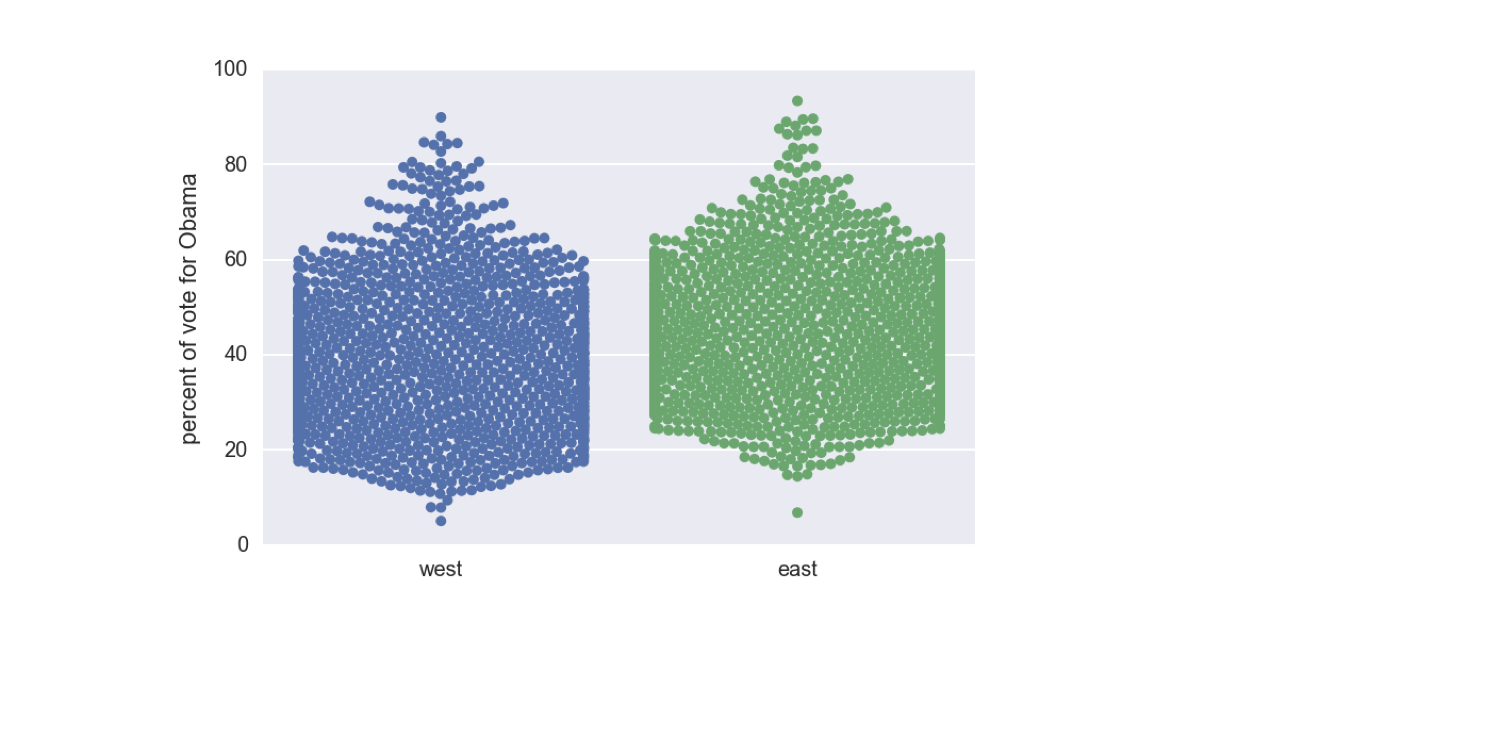
2008 年美國選舉:東岸與西岸

ch1-4_v2.005.png

1 資料取自 Data.gov (https://www.data.gov/)
Statistical Thinking in Python (Part 1)

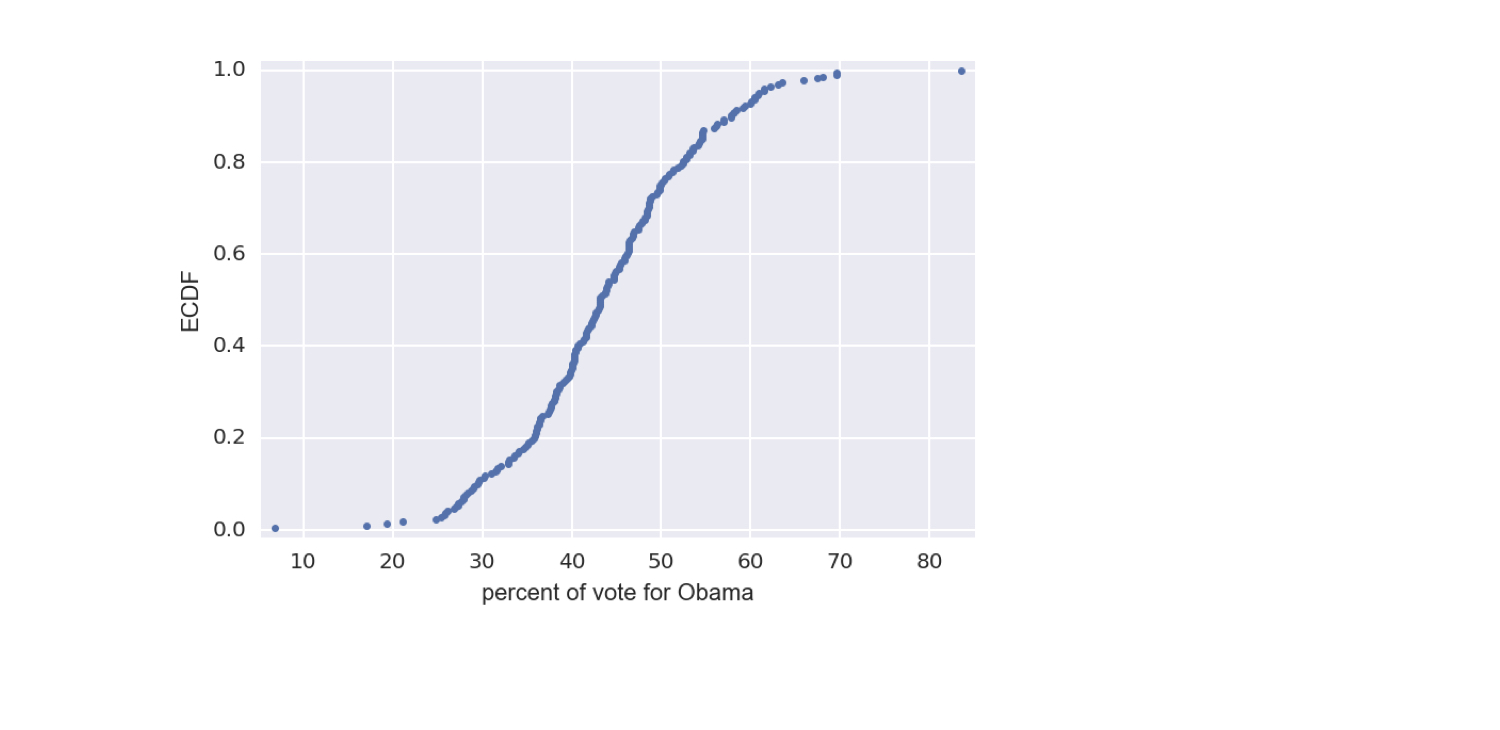
經驗累積分佈函數(ECDF)

ch1-4_v2.007.png

1 資料取自 Data.gov (https://www.data.gov/)
Statistical Thinking in Python (Part 1)

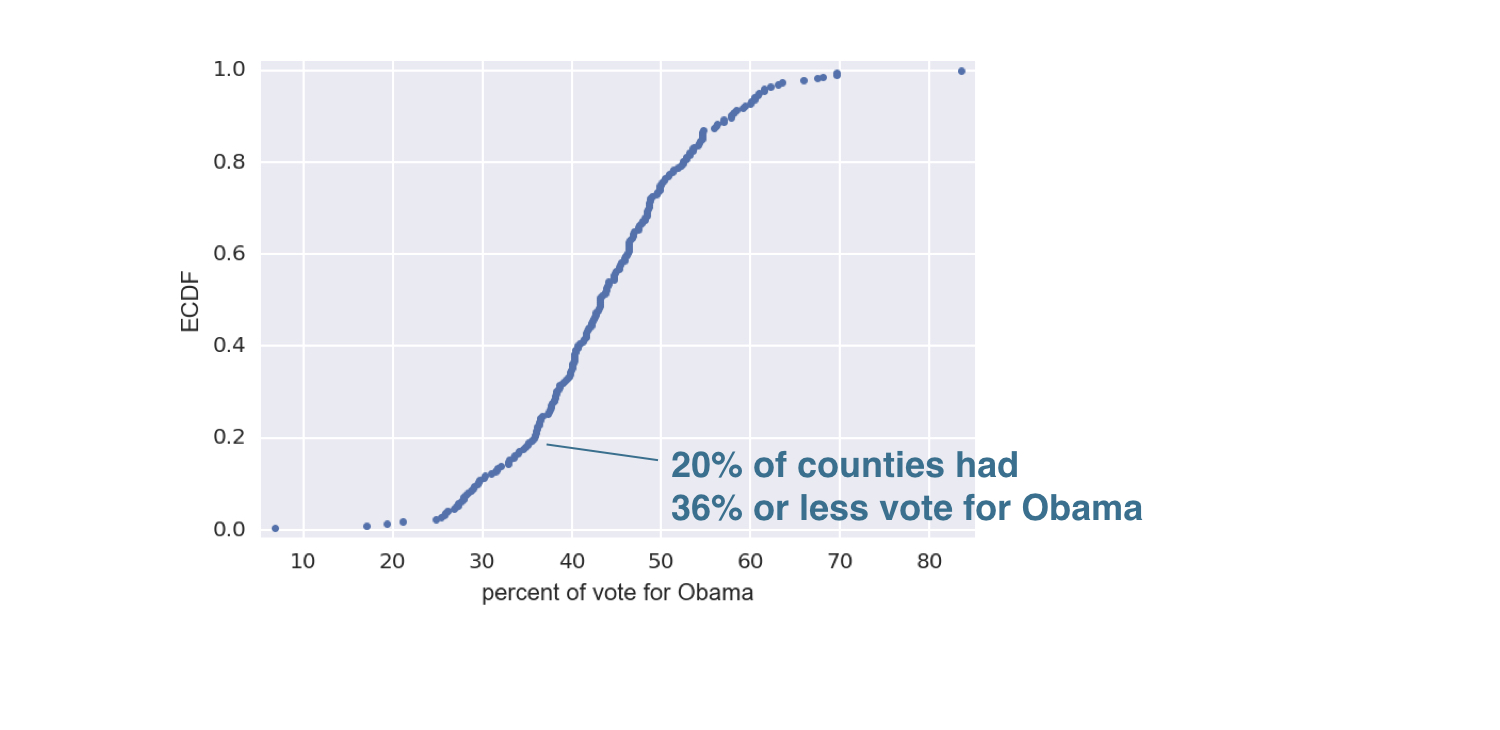
經驗累積分佈函數(ECDF)

ch1-4_v2.008.png

1 資料取自 Data.gov (https://www.data.gov/)
Statistical Thinking in Python (Part 1)

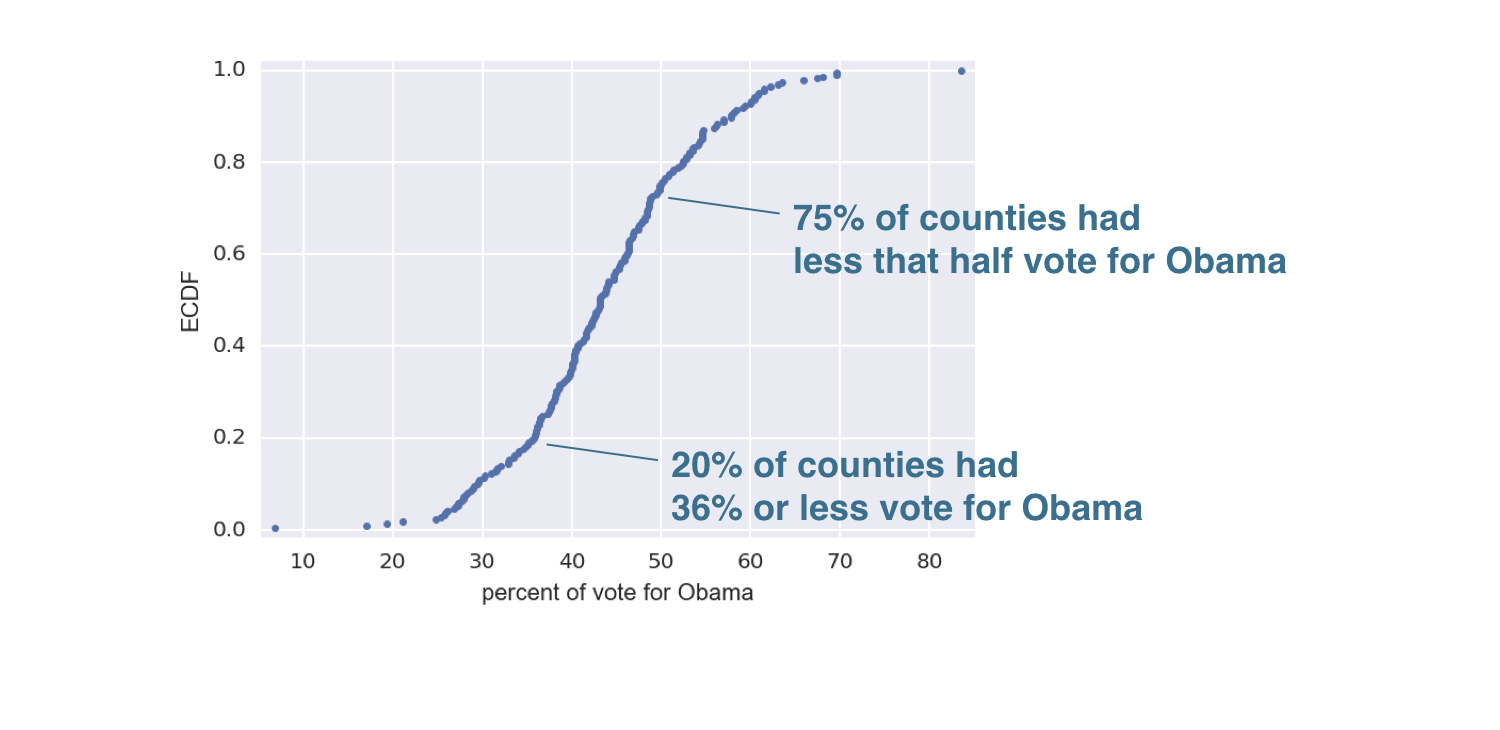
經驗累積分佈函數(ECDF)

ch1-4_v2.009.png

1 資料取自 Data.gov (https://www.data.gov/)
Statistical Thinking in Python (Part 1)

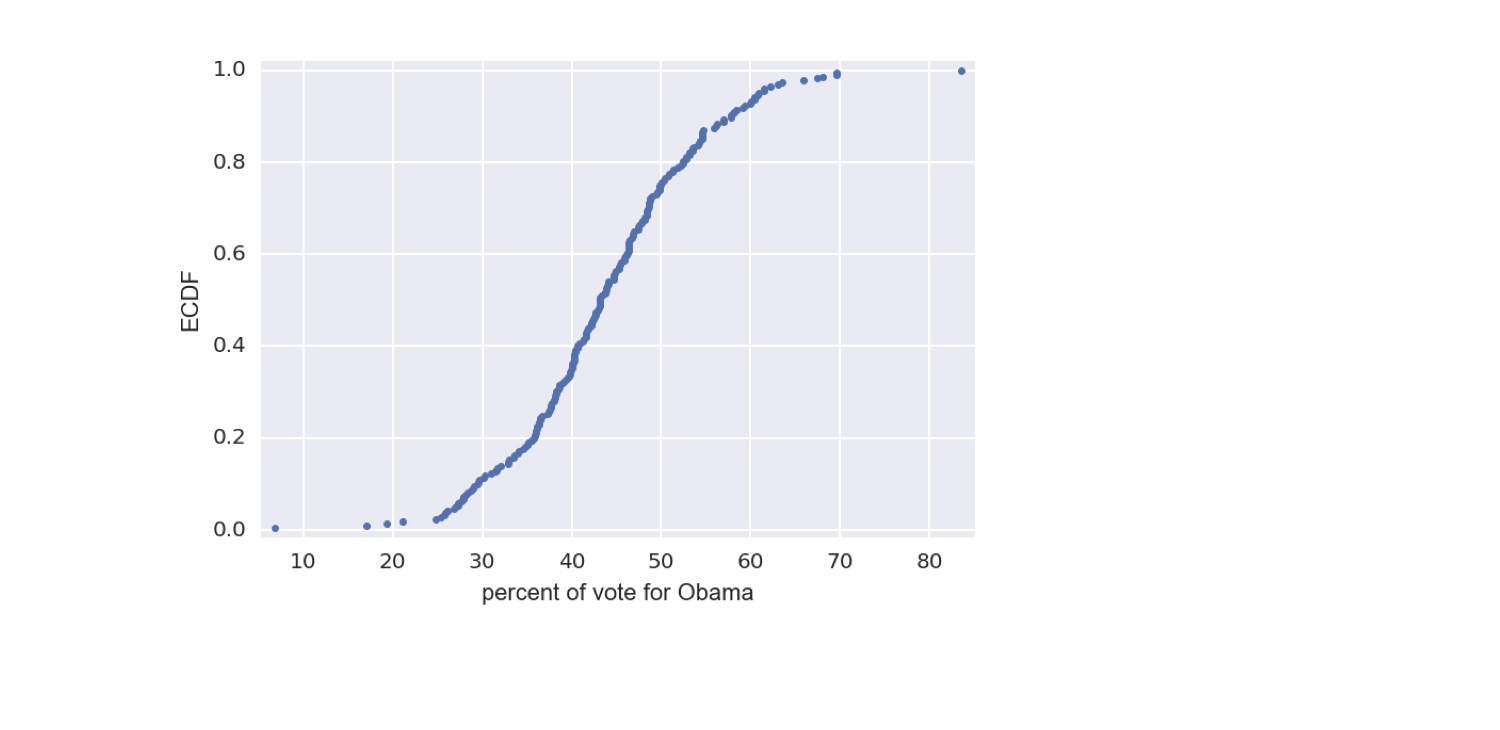
建立 ECDF

import numpy as np

x = np.sort(df_swing['dem_share'])
y = np.arange(1, len(x)+1) / len(x)
_ = plt.plot(x, y, marker='.', linestyle='none')
_ = plt.xlabel('percent of vote for Obama') _ = plt.ylabel('ECDF')
plt.margins(0.02) # Keeps data off plot edges plt.show()
Statistical Thinking in Python (Part 1)

2008 年美國搖擺州選舉的 ECDF

ch1-4_v2.022.png

1 資料取自 Data.gov (https://www.data.gov/)
Statistical Thinking in Python (Part 1)

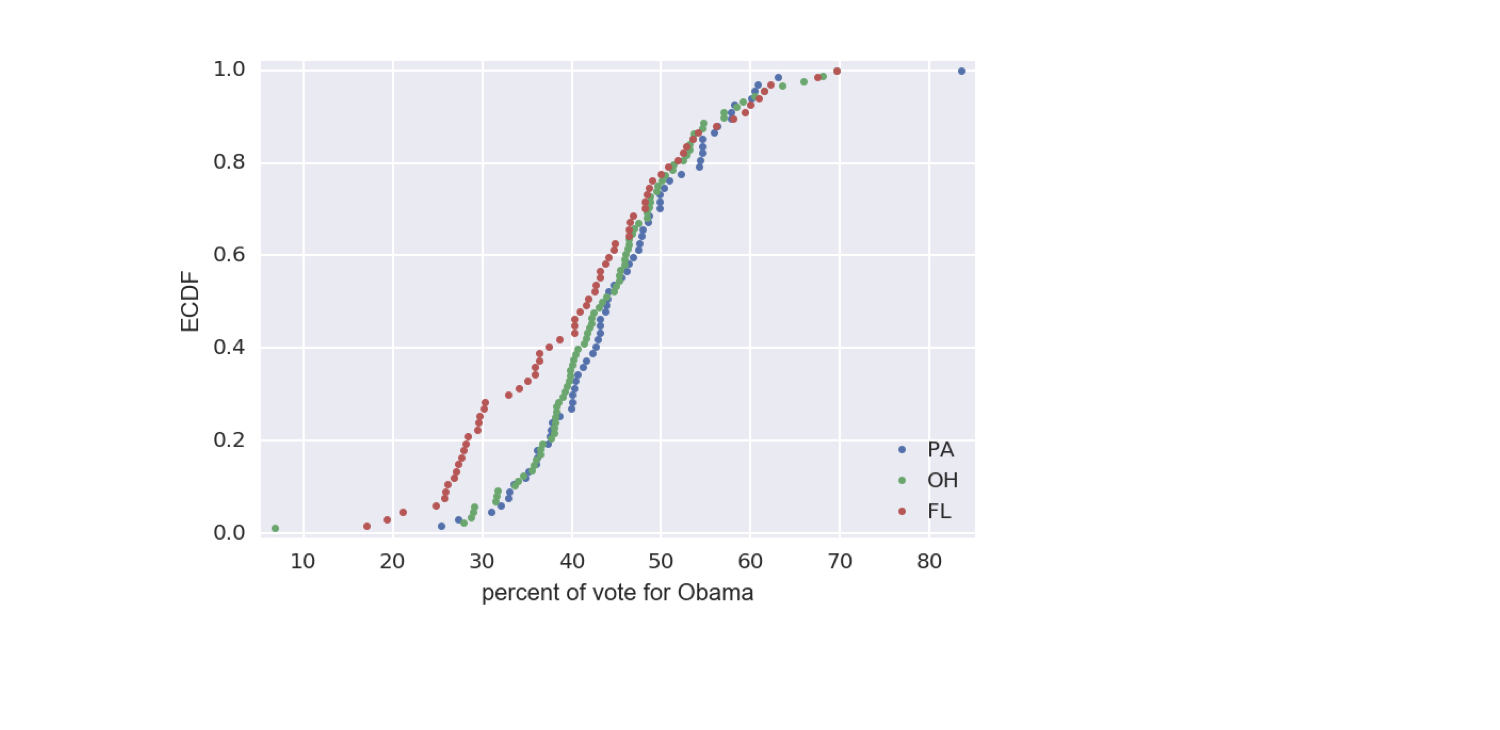
2008 年美國搖擺州選舉的 ECDFs

ch1-4_v2.024.png

1 資料取自 Data.gov (https://www.data.gov/)
Statistical Thinking in Python (Part 1)

一起來練習吧!

Statistical Thinking in Python (Part 1)

Preparing Video For Download...