分面標籤與順序

ggplot2 中級資料視覺化

Rick Scavetta

Founder, Scavetta Academy

新的 dataframe
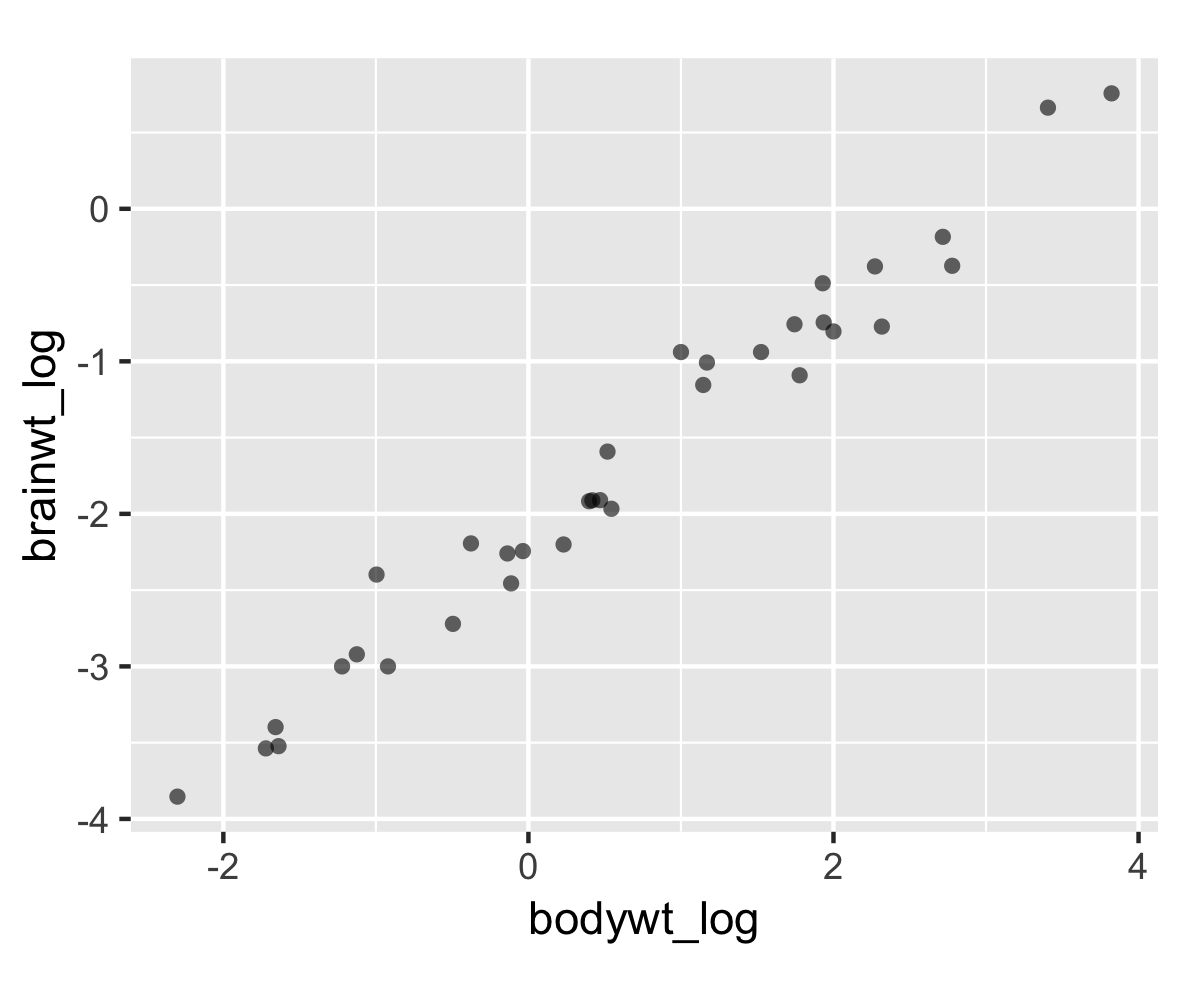
# Plot
p <- ggplot(msleep2, aes(bodywt_log,
                         brainwt_log)) +
  geom_point(alpha = 0.6, shape = 16) +
  coord_fixed()

p

ggplot2 中級資料視覺化

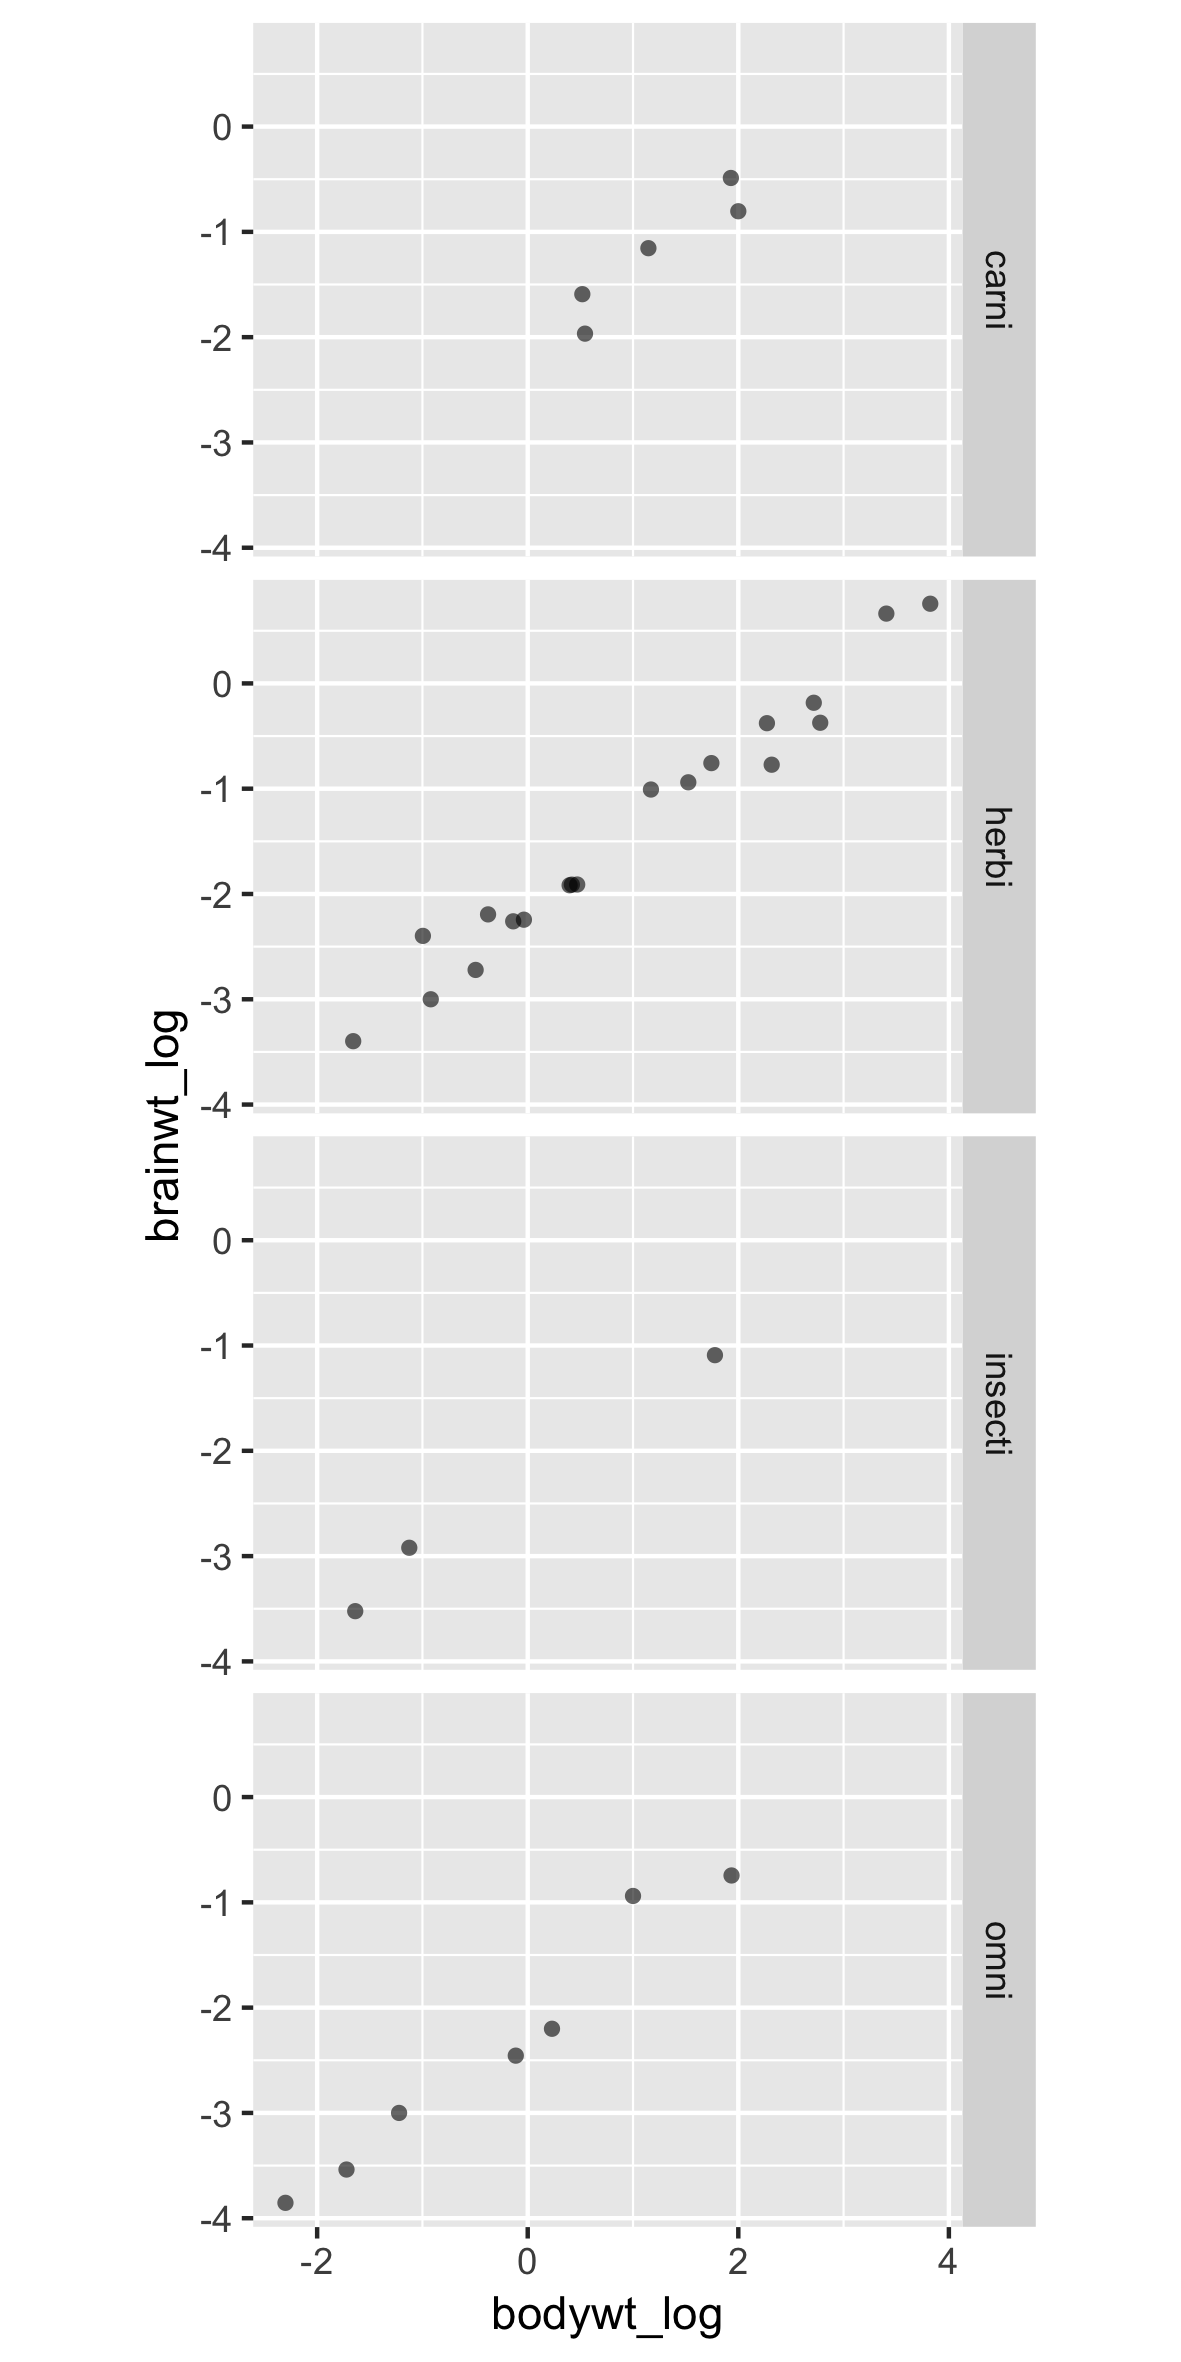
新的 dataframe(含分面)

p +
  facet_grid(rows = vars(vore))

ggplot2 中級資料視覺化

新的 dataframe(含分面)

p +
  facet_grid(rows = vars(vore))

ggplot2 中級資料視覺化

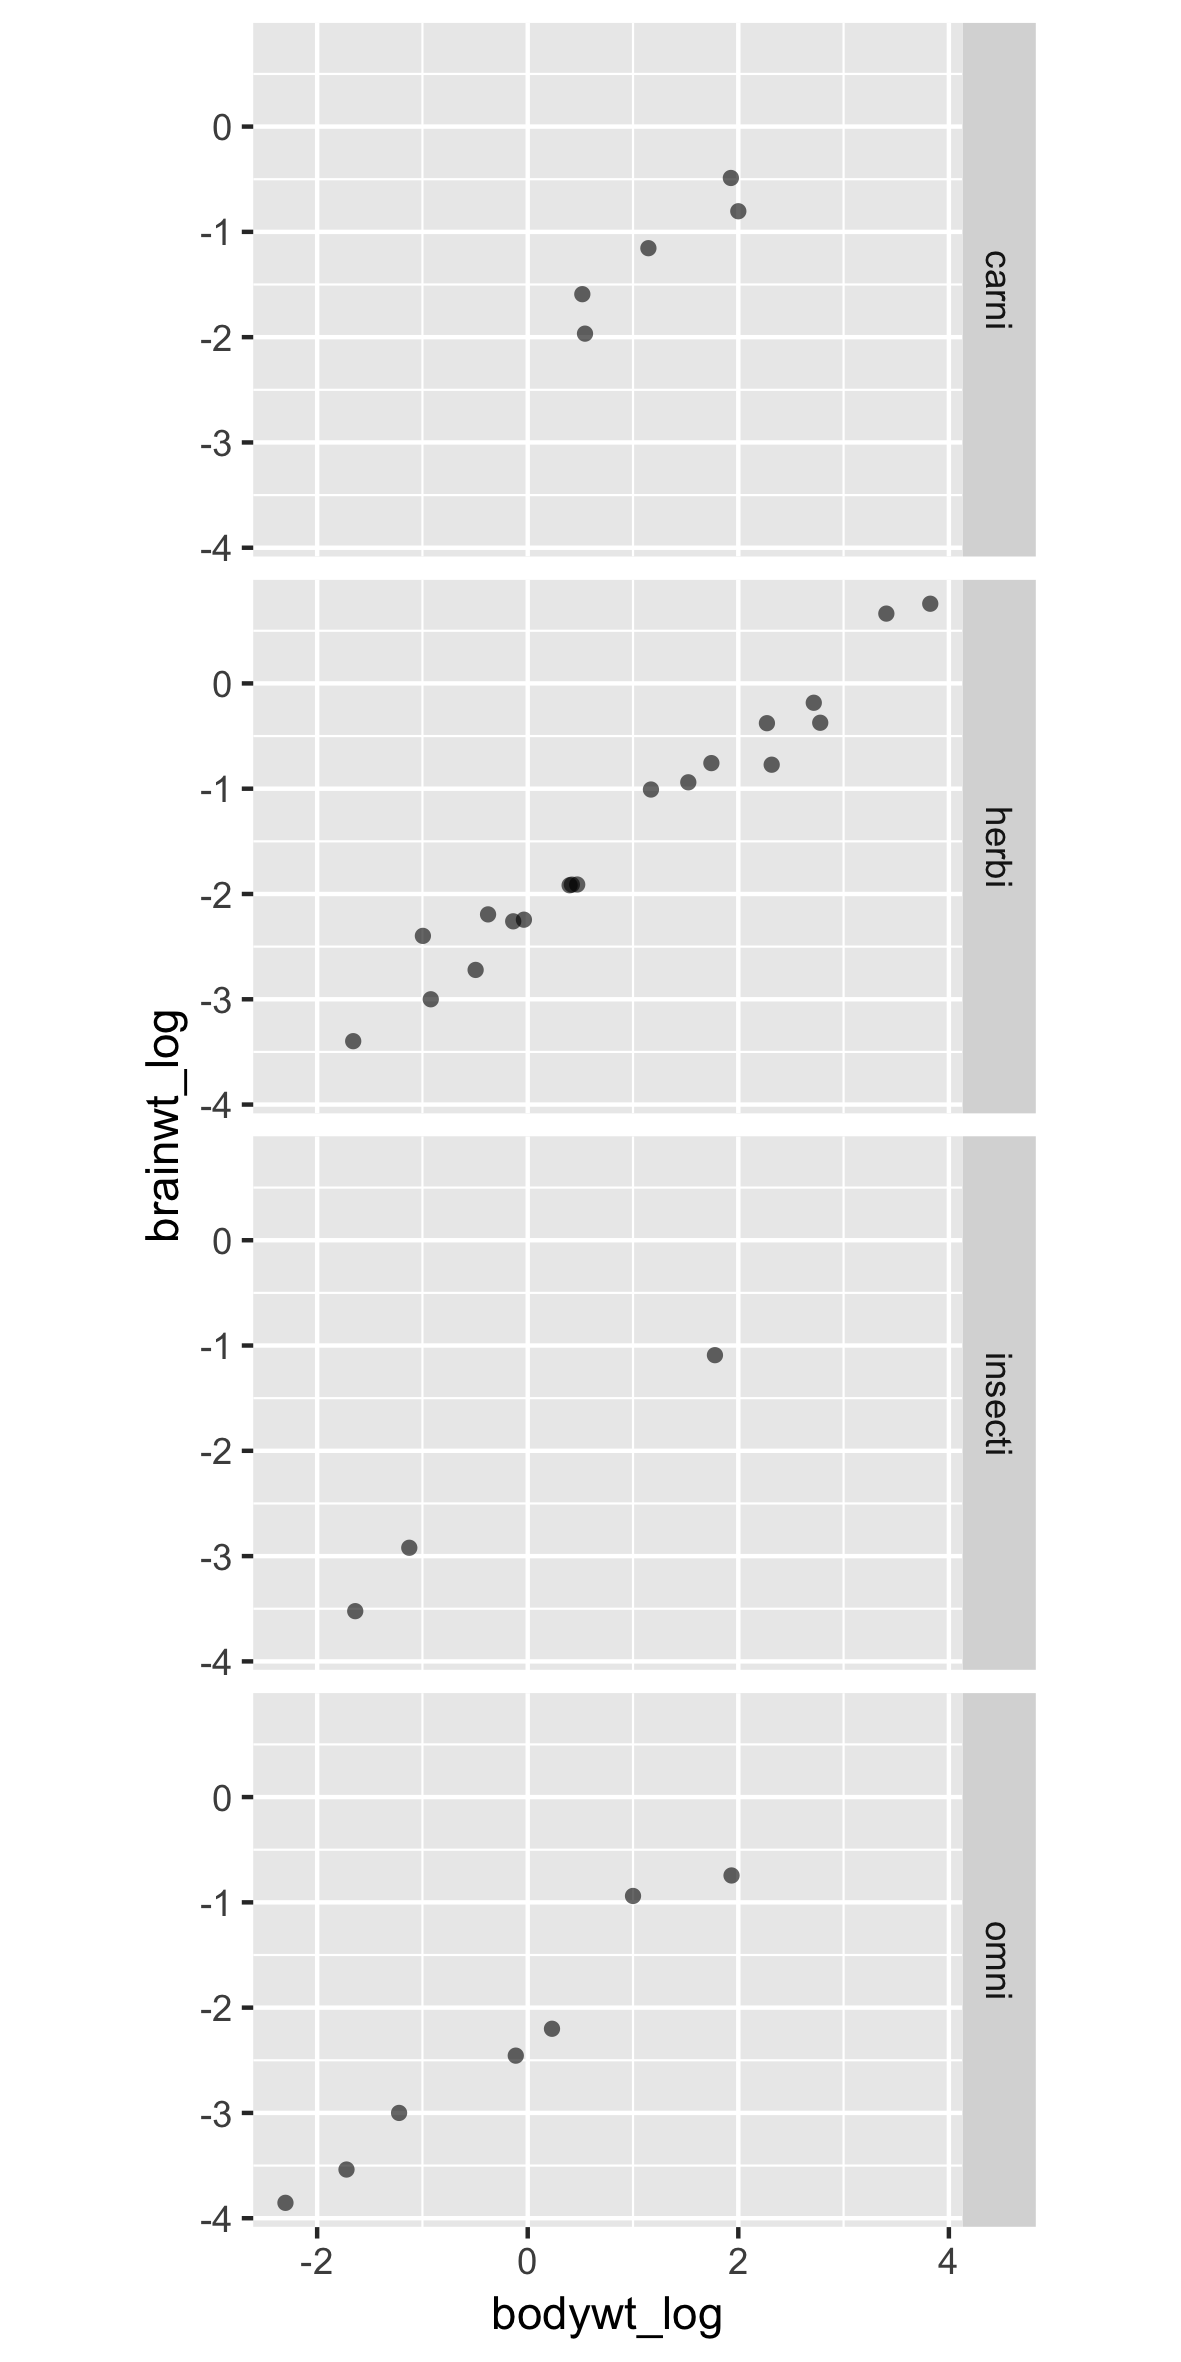
標籤與順序不佳

p +
  facet_grid(rows = vars(vore))

分面常見兩個問題:

  • 標籤不清楚(例如無描述性)
  • 順序錯誤或不合適

ggplot2 中級資料視覺化

標籤與順序不佳

p +
  facet_grid(rows = vars(vore))

解法:

  • 簡單:在 ggplot 中加入標籤
  • 更好:在 dataframe 中重新命名並調整因子變數順序

ggplot2 中級資料視覺化

labeller 參數

# 預設只顯示值
p +
  facet_grid(rows = vars(vore), 
             labeller = label_value)

ggplot2 中級資料視覺化

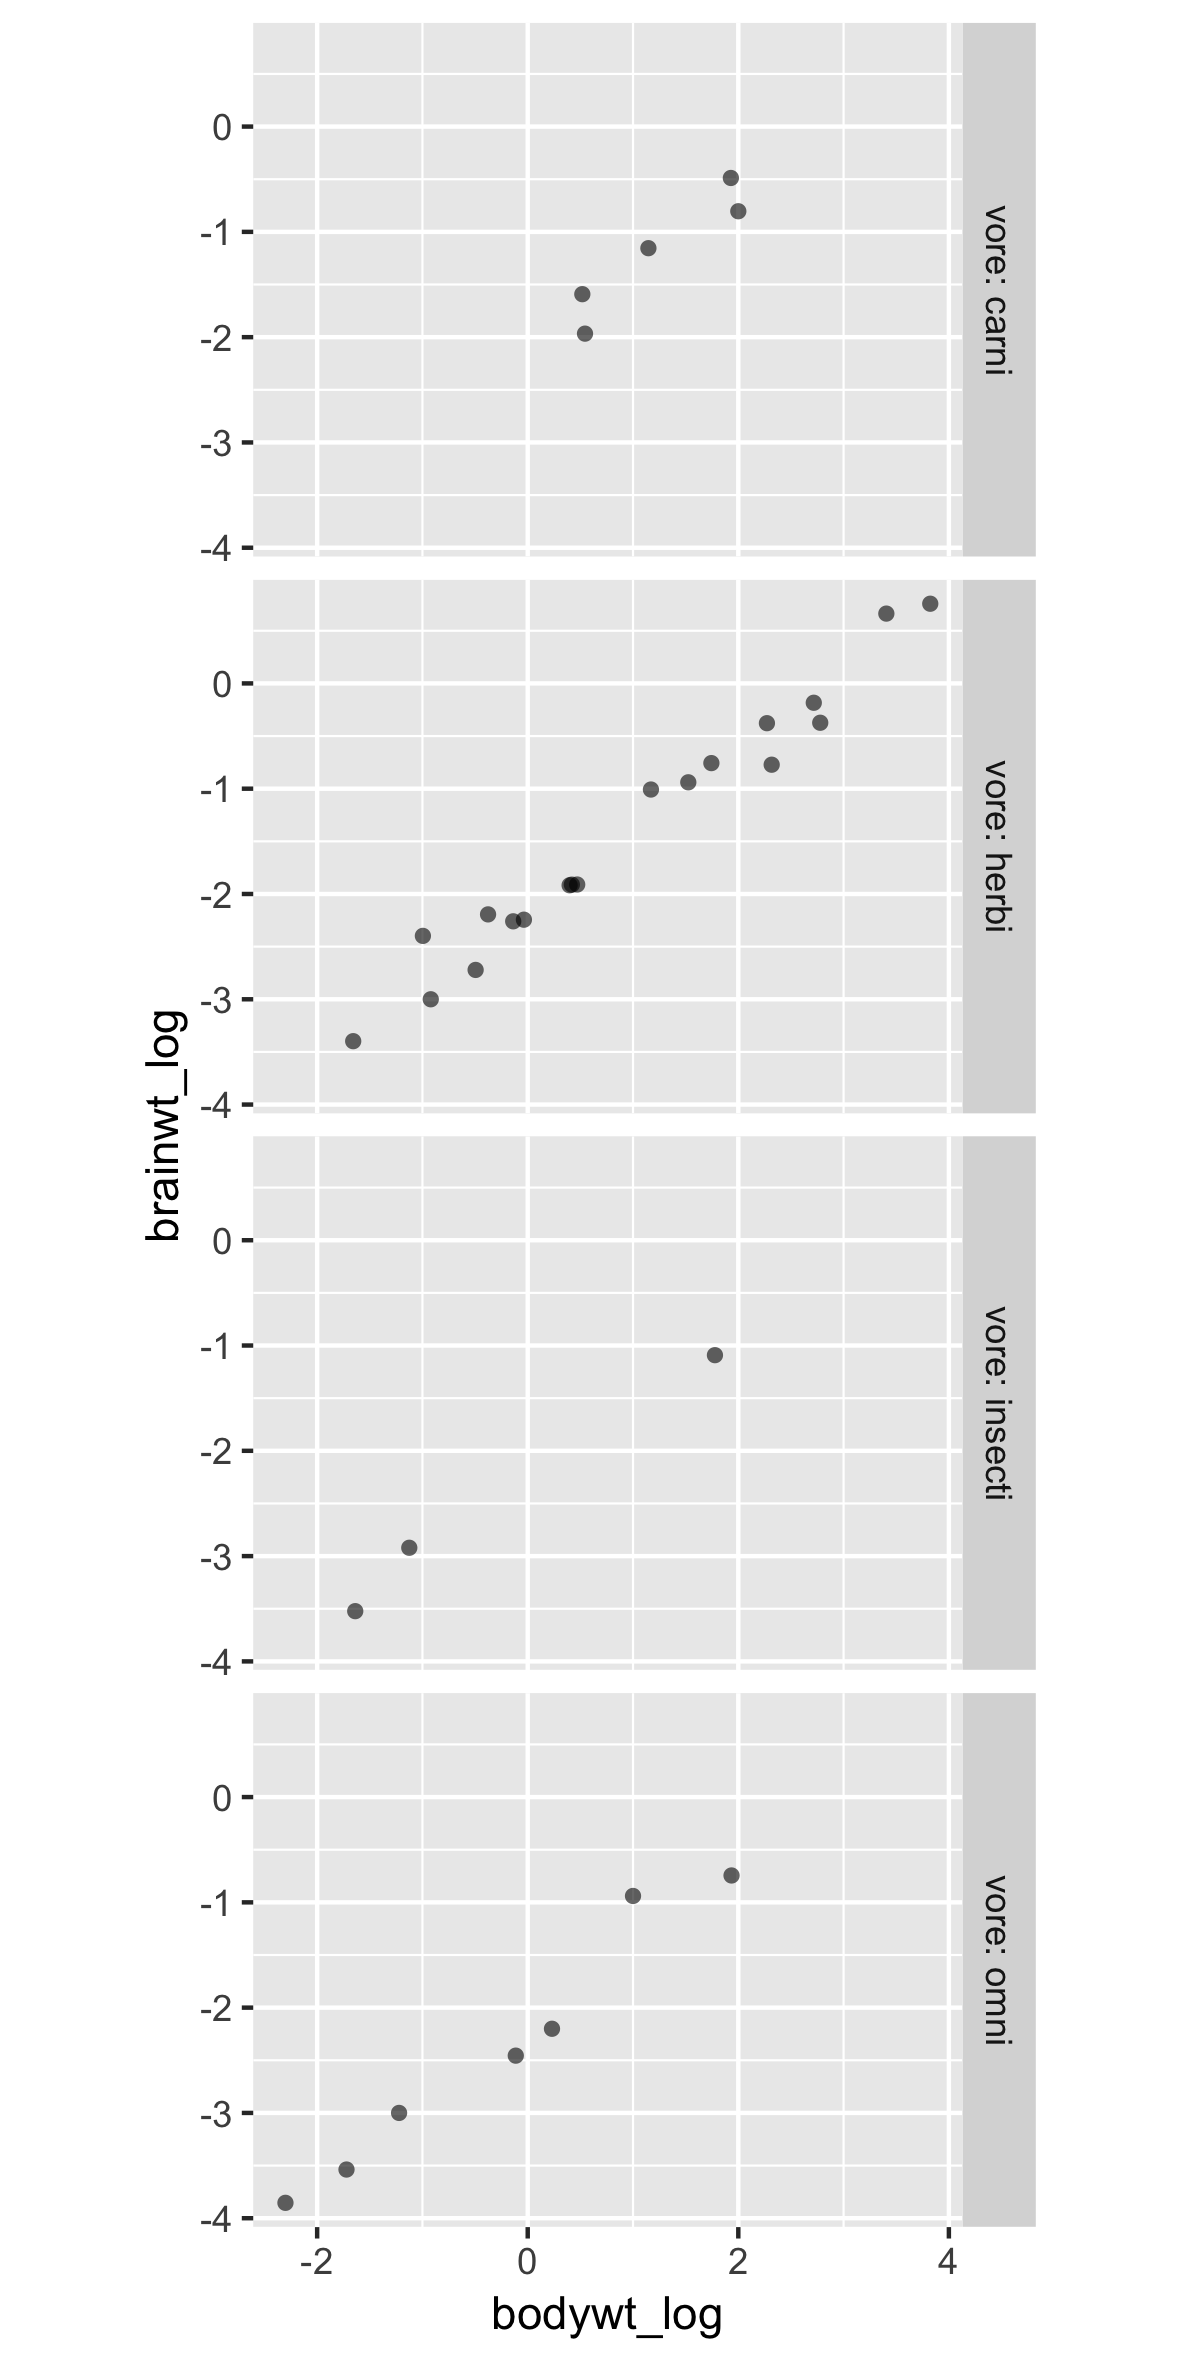
使用 label_both 會加入變數名稱

# 同時顯示變數名稱
p +
  facet_grid(rows = vars(vore), 
               labeller = label_both)

ggplot2 中級資料視覺化

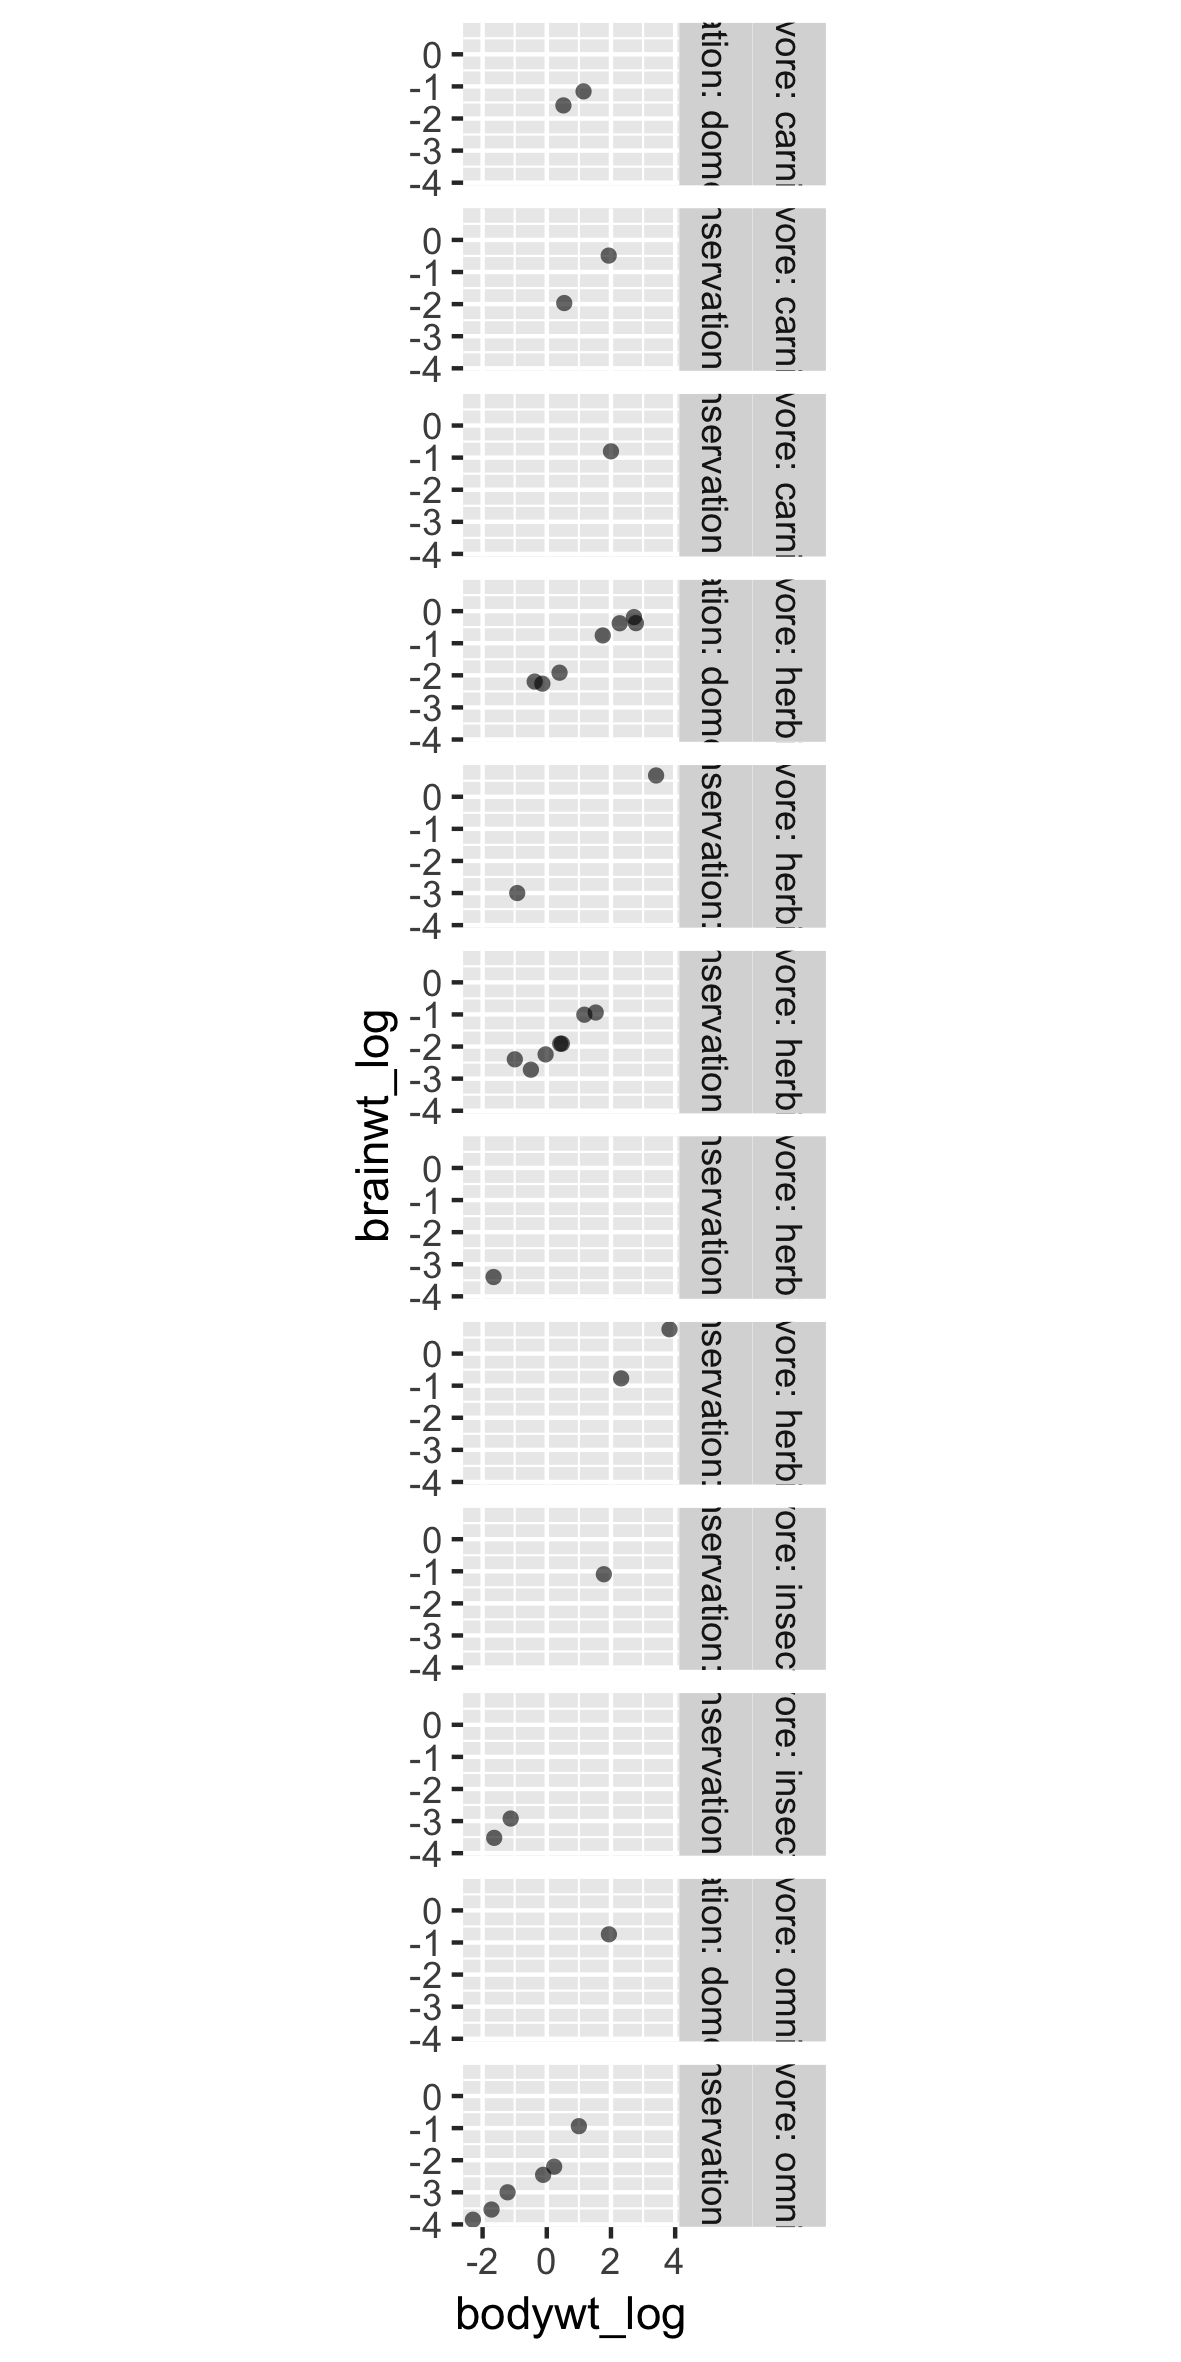
同側使用兩個變數

p +
  facet_grid(rows = vars(vore, 
                         conservation))

ggplot2 中級資料視覺化

使用 label_context 避免混淆

p +
  facet_grid(rows = vars(vore,
                         conservation),
               labeller = label_context)

ggplot2 中級資料視覺化

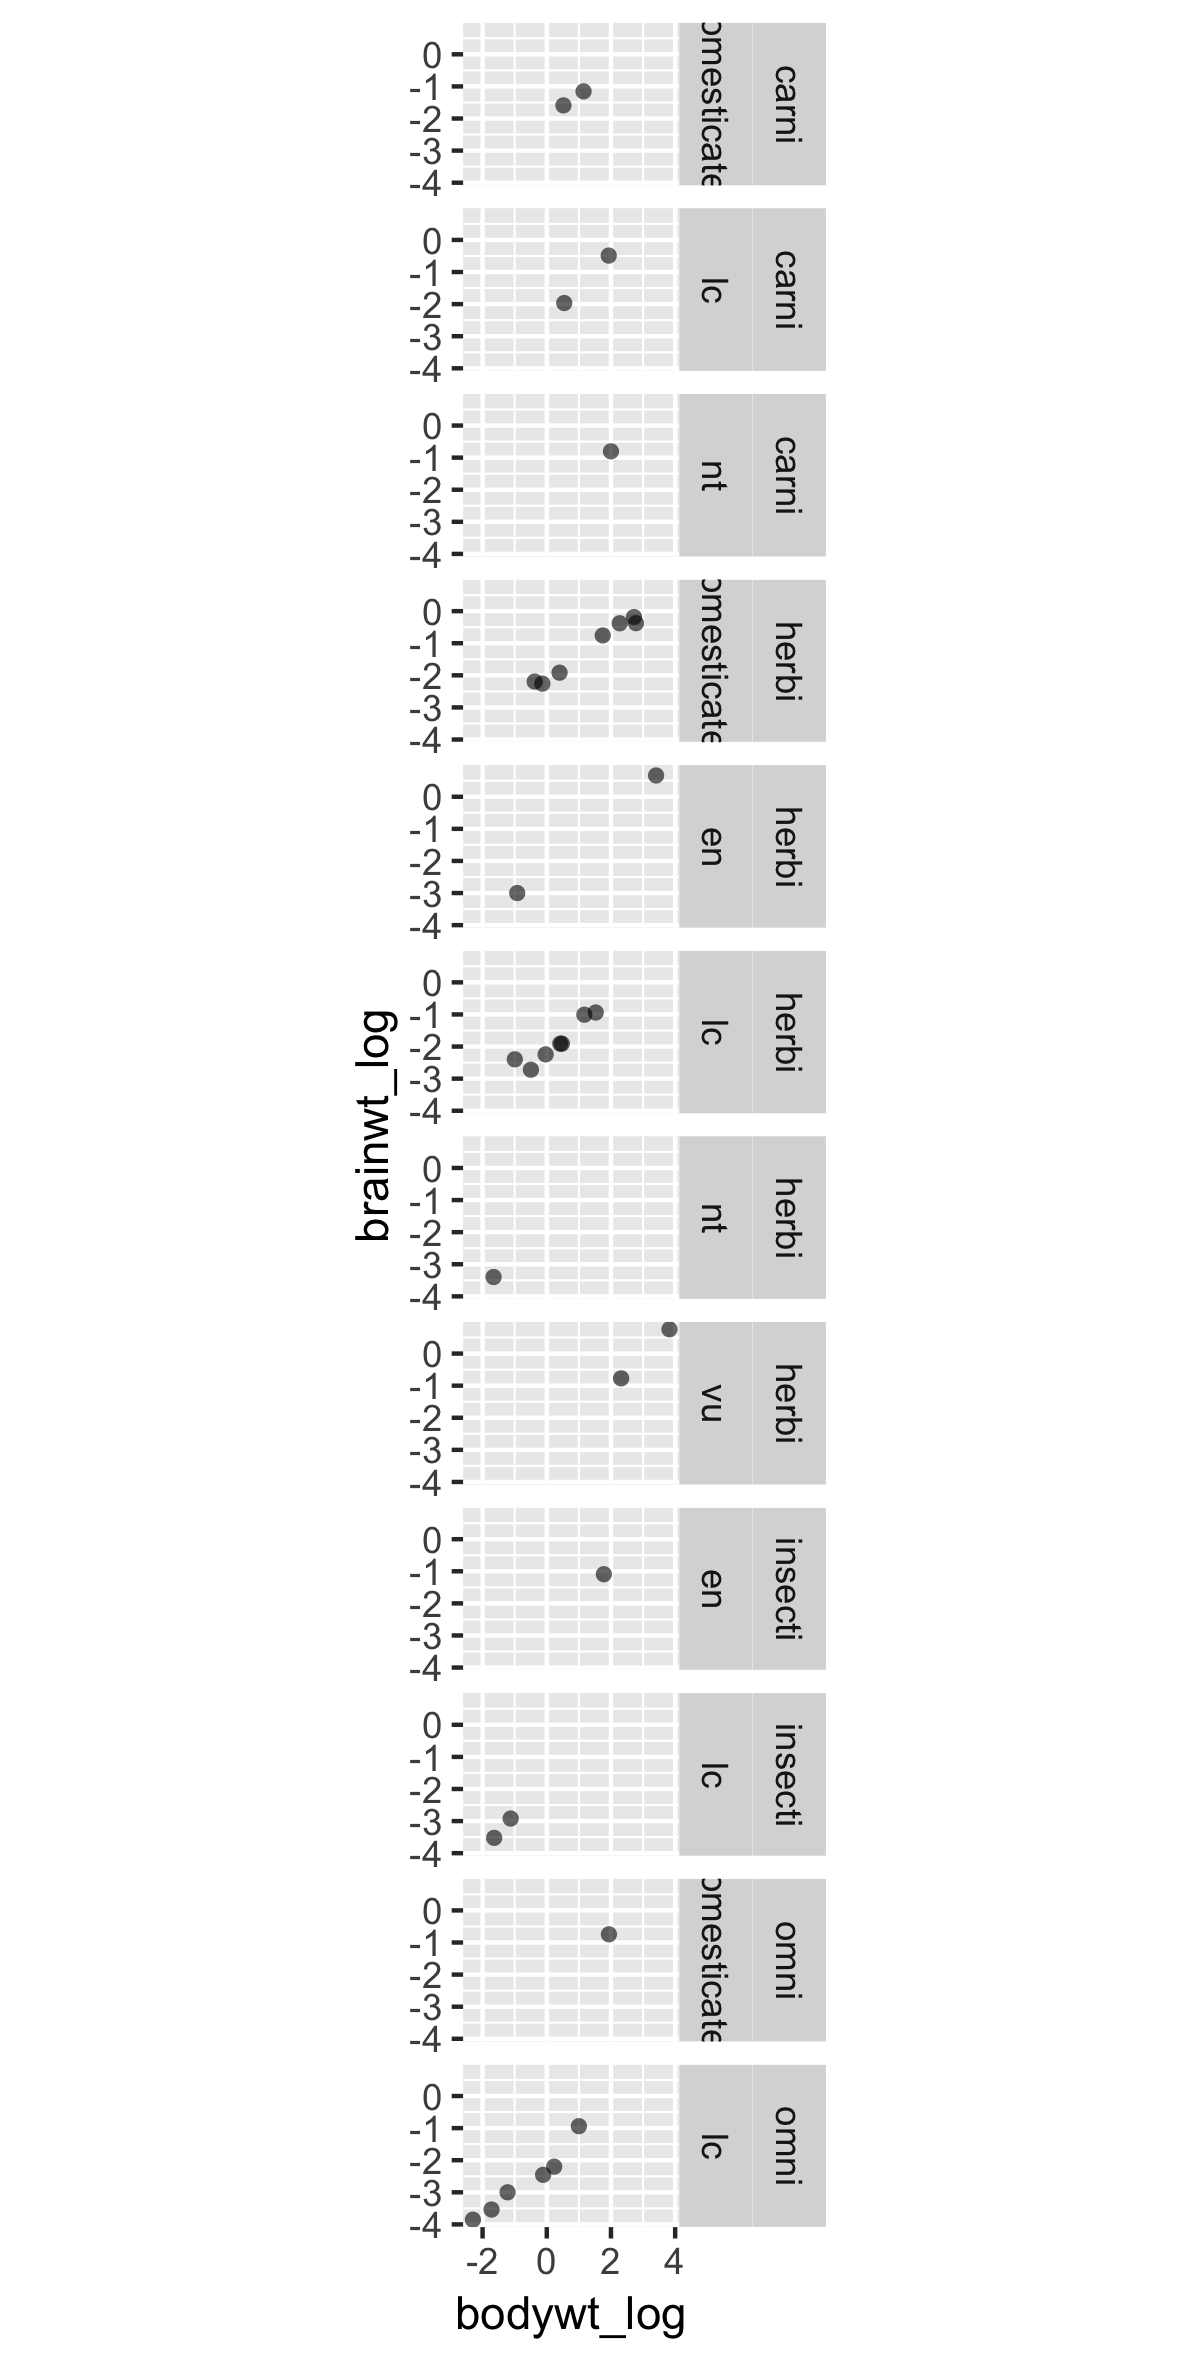
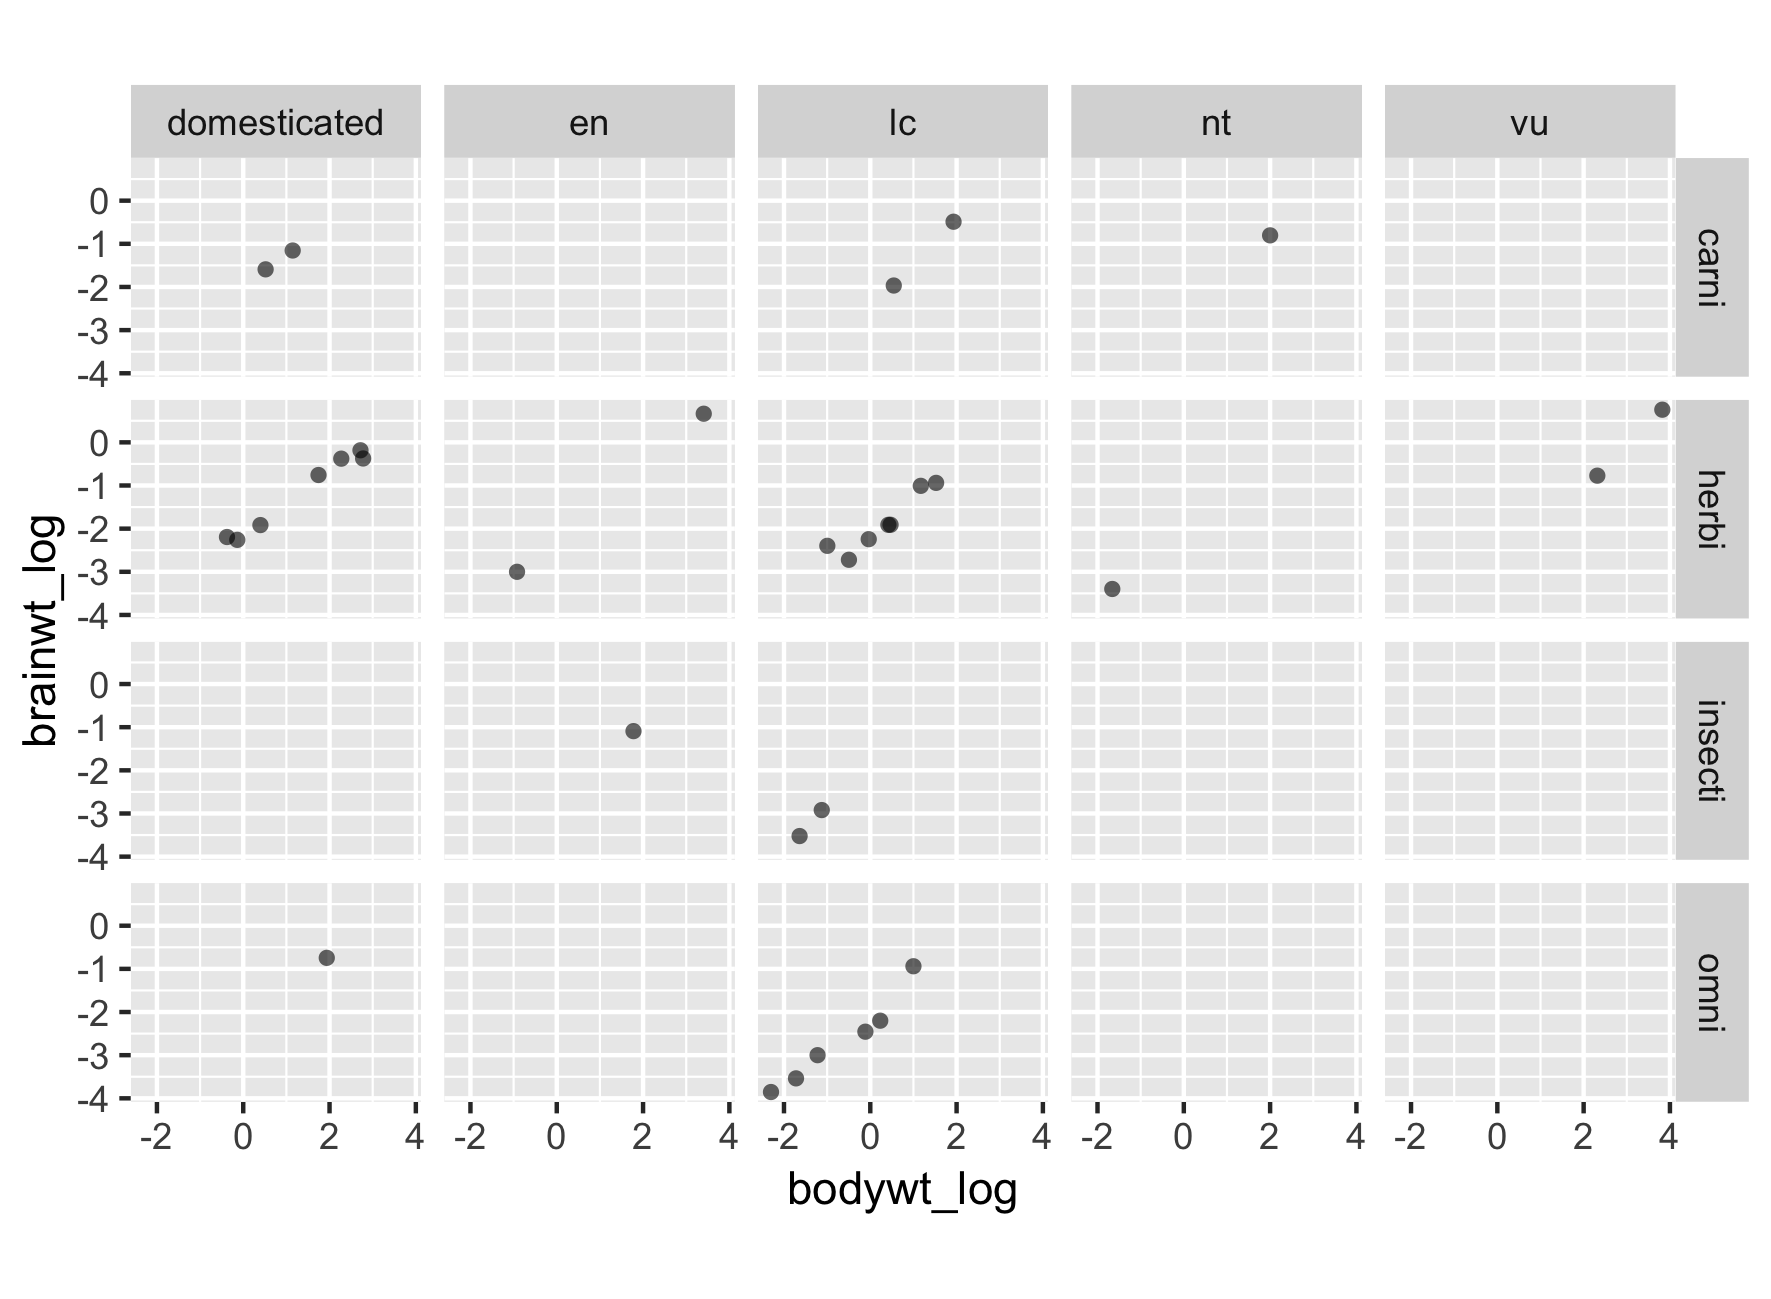
適時使用列與欄

p +
  facet_grid(rows = vars(vore), 
             cols = vars(conservation),
             labeller = label_context)

ggplot2 中級資料視覺化

適時使用列與欄

p +
  facet_grid(rows = vars(vore), 
             cols = vars(conservation))

ggplot2 中級資料視覺化

適時使用列與欄

ggplot2 中級資料視覺化

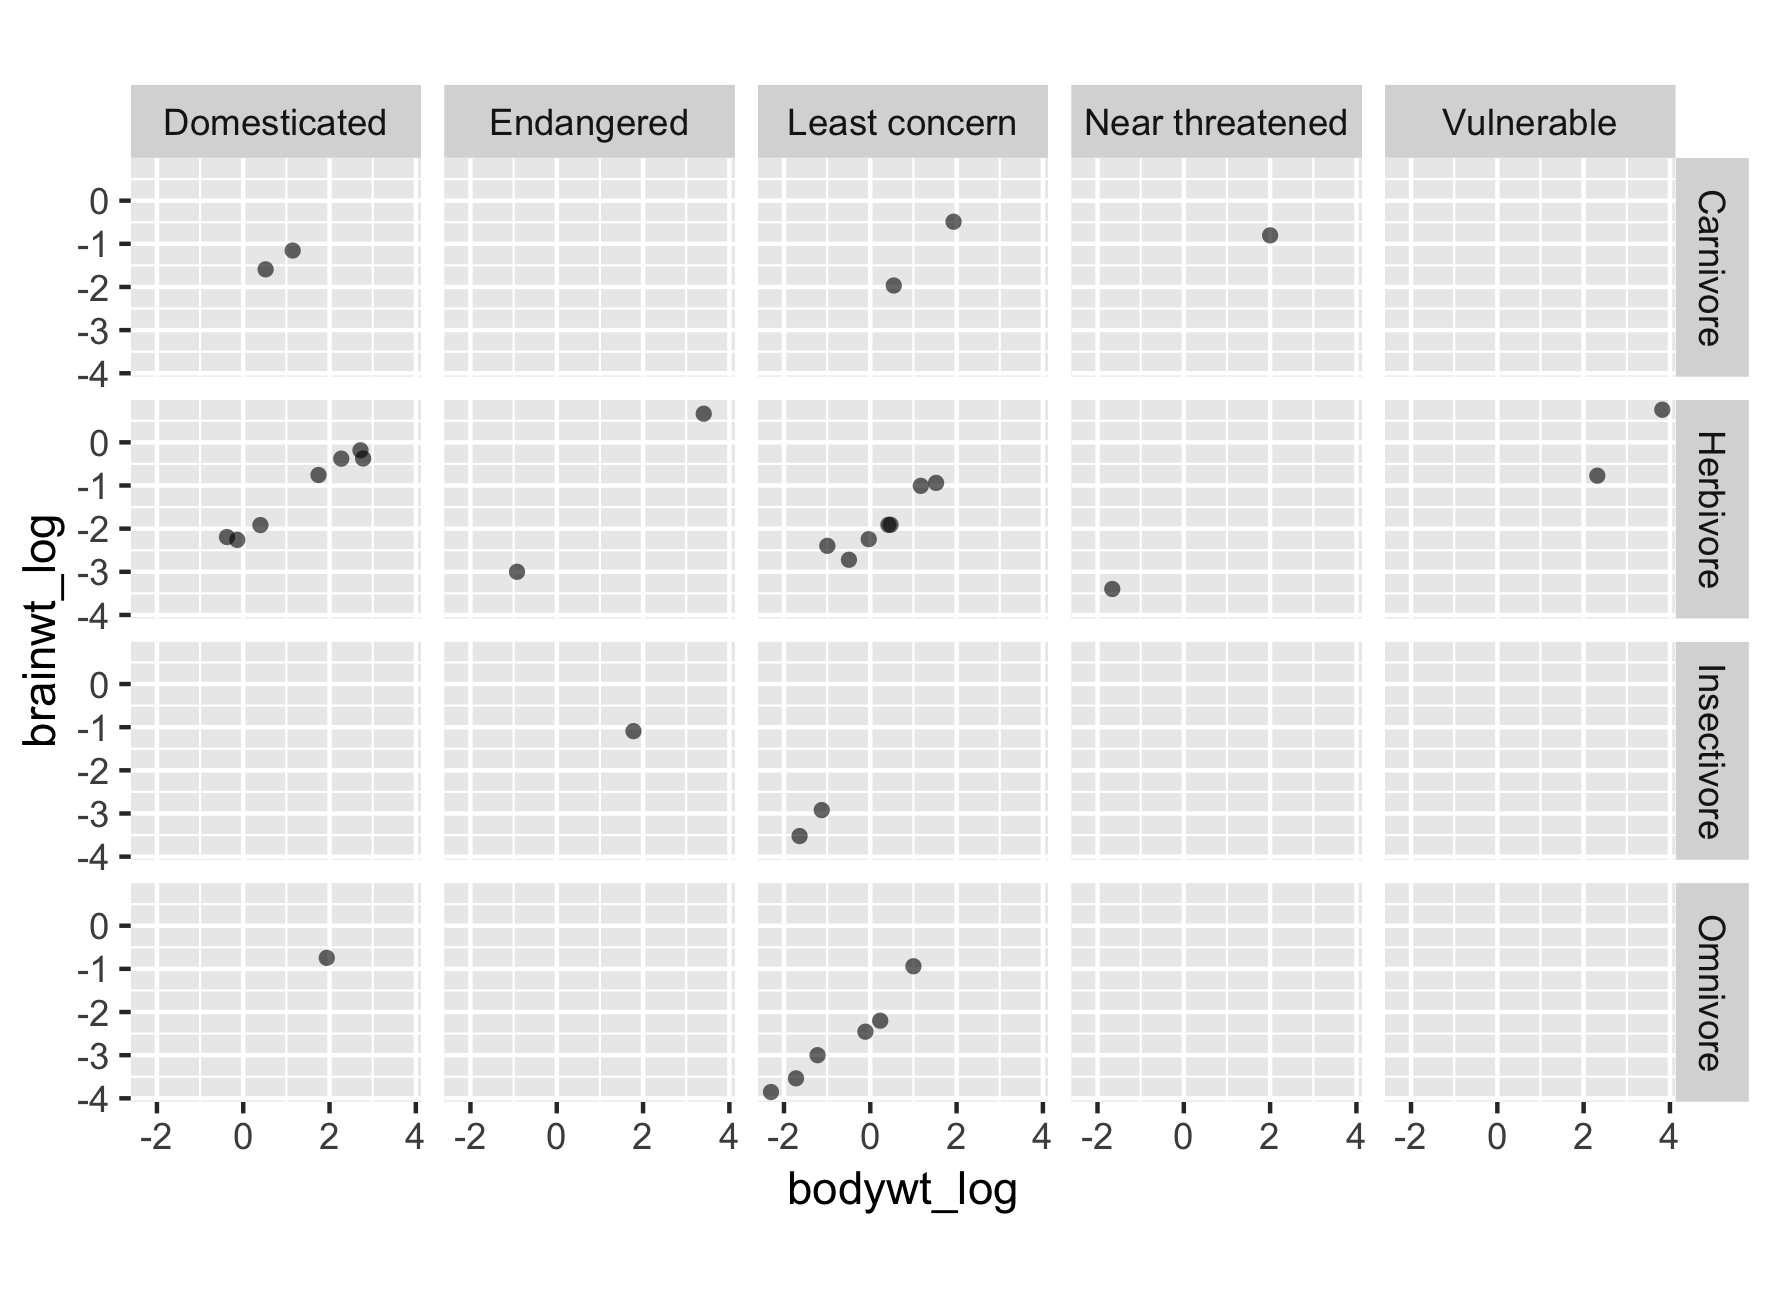
重新命名與重排因子

msleep2$conservation <- fct_recode(msleep2$conservation,
                                   Domesticated = "domesticated",
                                   `Least concern` = "lc",
                                   `Near threatened` = "nt",
                                   Vulnerable = "vu",
                                   Endangered = "en")

msleep2$vore = fct_recode(msleep2$vore,
                          Carnivore = "carni",
                          Herbivore = "herbi",
                          Insectivore = "insecti",
                          Omnivore = "omni")
ggplot2 中級資料視覺化

以新標籤重新建立圖形

# Plot
p <- ggplot(msleep2, aes(bodywt_log,
                         brainwt_log)) +
  geom_point(alpha = 0.6, shape = 16) +
  coord_fixed()

p +
  facet_grid(rows = vars(vore), 
             cols = vars(conservation)) 

ggplot2 中級資料視覺化

以新標籤重新建立圖形

ggplot2 中級資料視覺化

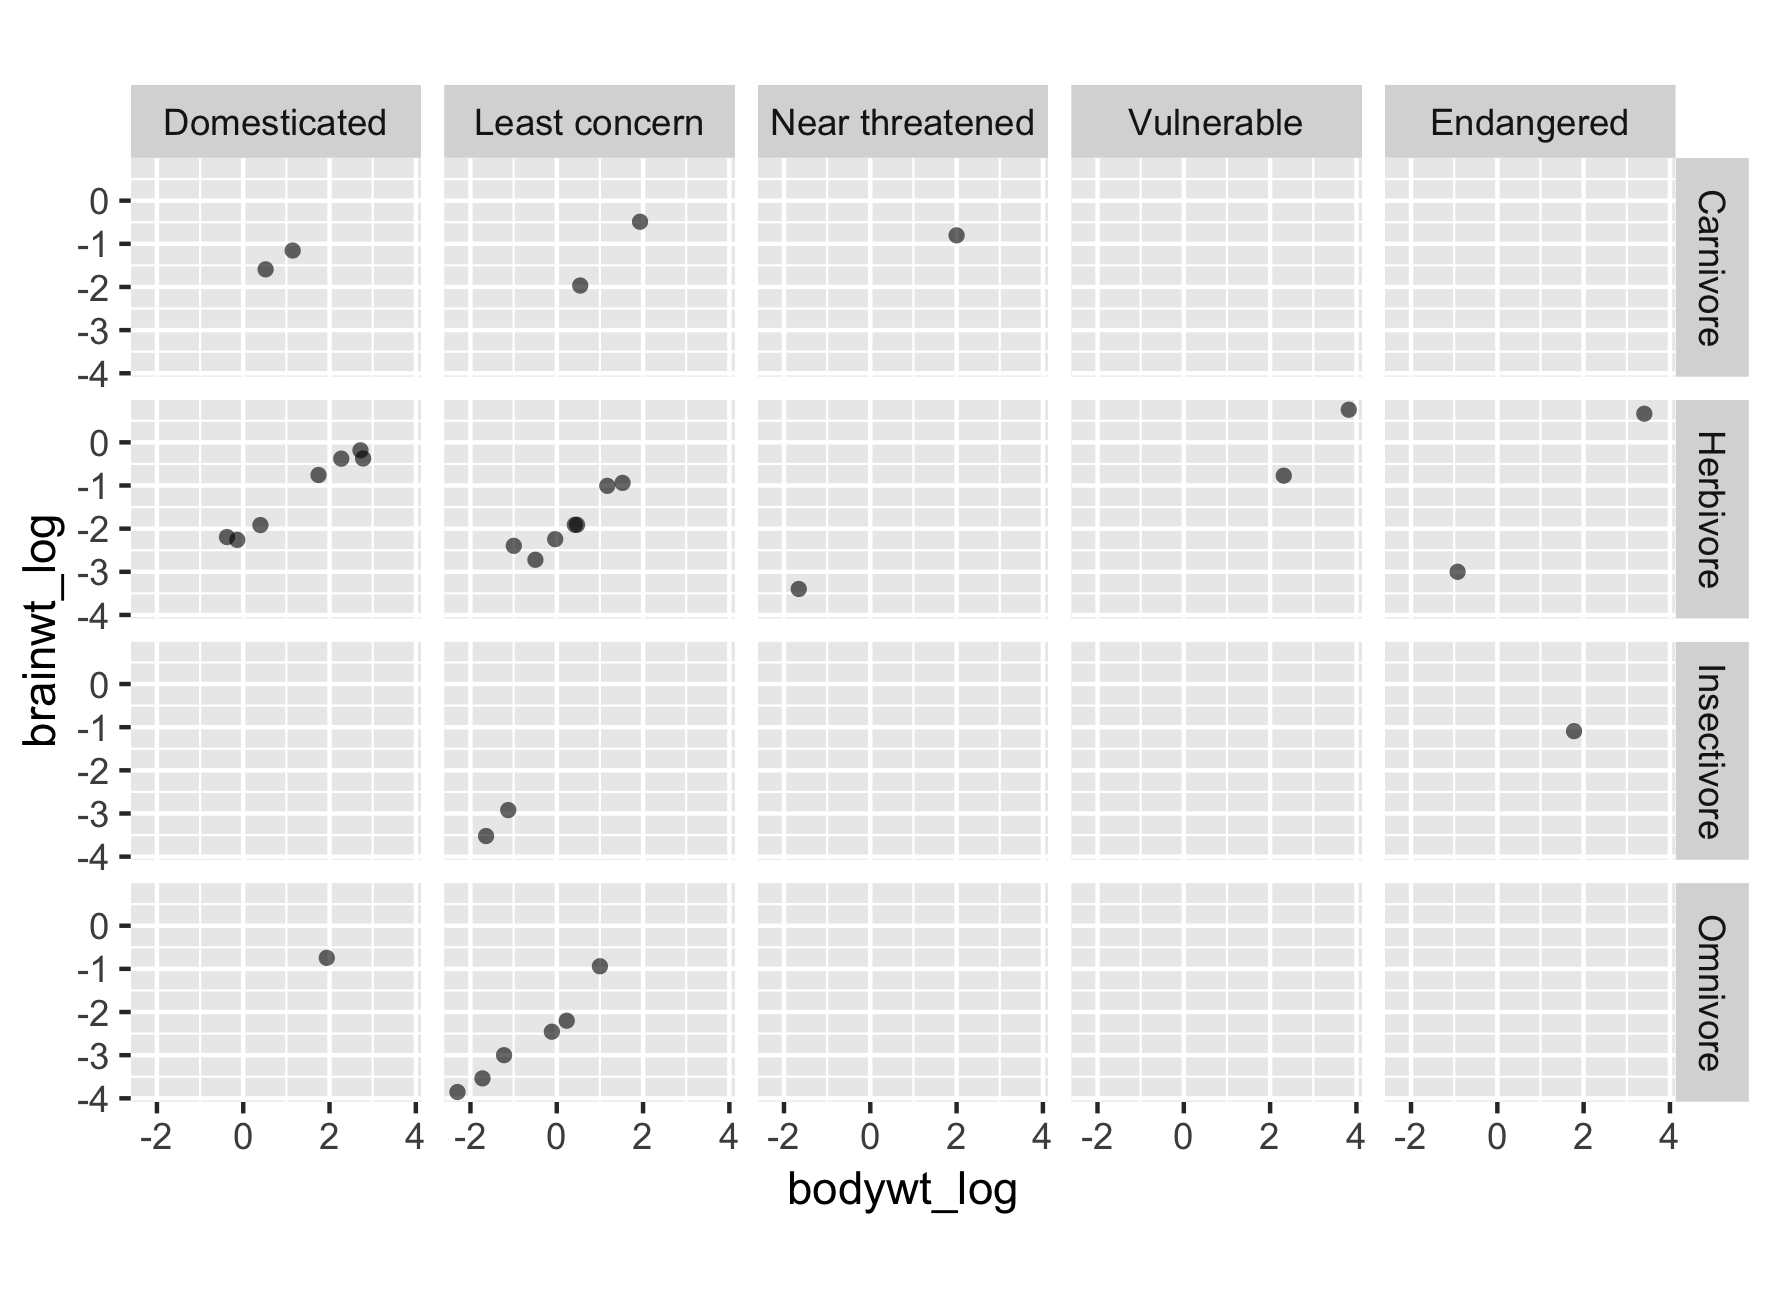
變更層級順序

# 調整層級順序:
msleep2$conservation = fct_relevel(msleep2$conservation,
                                   c("Domesticated",
                                     "Least concern",
                                     "Near threatened",
                                     "Vulnerable",
                                     "Endangered"))

ggplot2 中級資料視覺化

以新順序重新建立圖形

ggplot2 中級資料視覺化

一起來練習吧!

ggplot2 中級資料視覺化

Preparing Video For Download...