ggplot2 中級資料視覺化
Rick Scavetta
Founder, Scavetta Academy
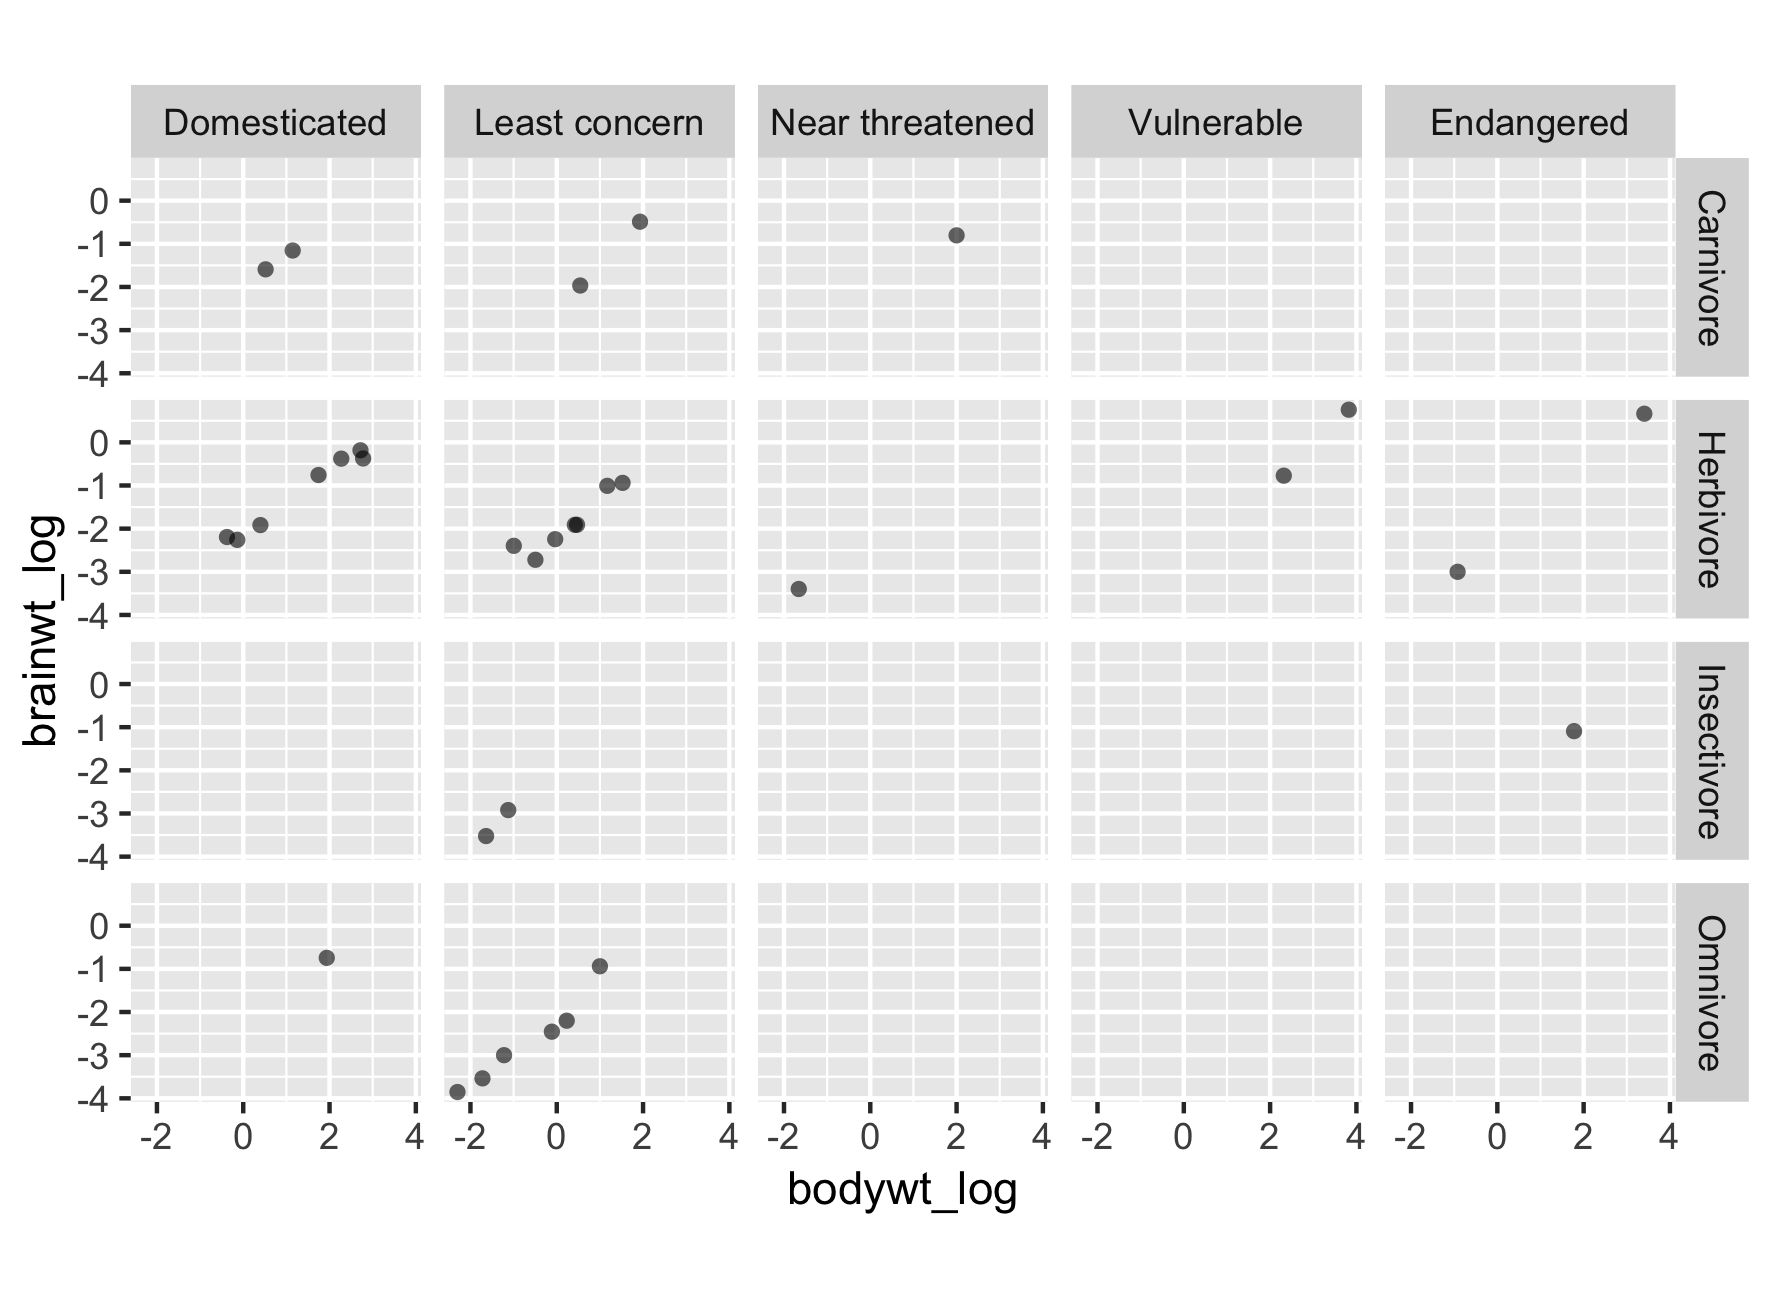
不使用一致繪圖空間的原因:
ggplot(msleep2, aes(bodywt_log,
                    brainwt_log)) +
  geom_point(alpha = 0.6, shape = 16) +
  coord_fixed() +
  facet_grid(rows = vars(vore),
             cols = vars(conservation))
ggplot(msleep2, aes(bodywt_log,
                         brainwt_log)) +
  geom_point(alpha = 0.6, shape = 16) +
  coord_fixed() +
  facet_grid(rows = vars(vore),
             cols = vars(conservation),
             scales = "free_x")
Error: coord_fixed doesn't support free scales
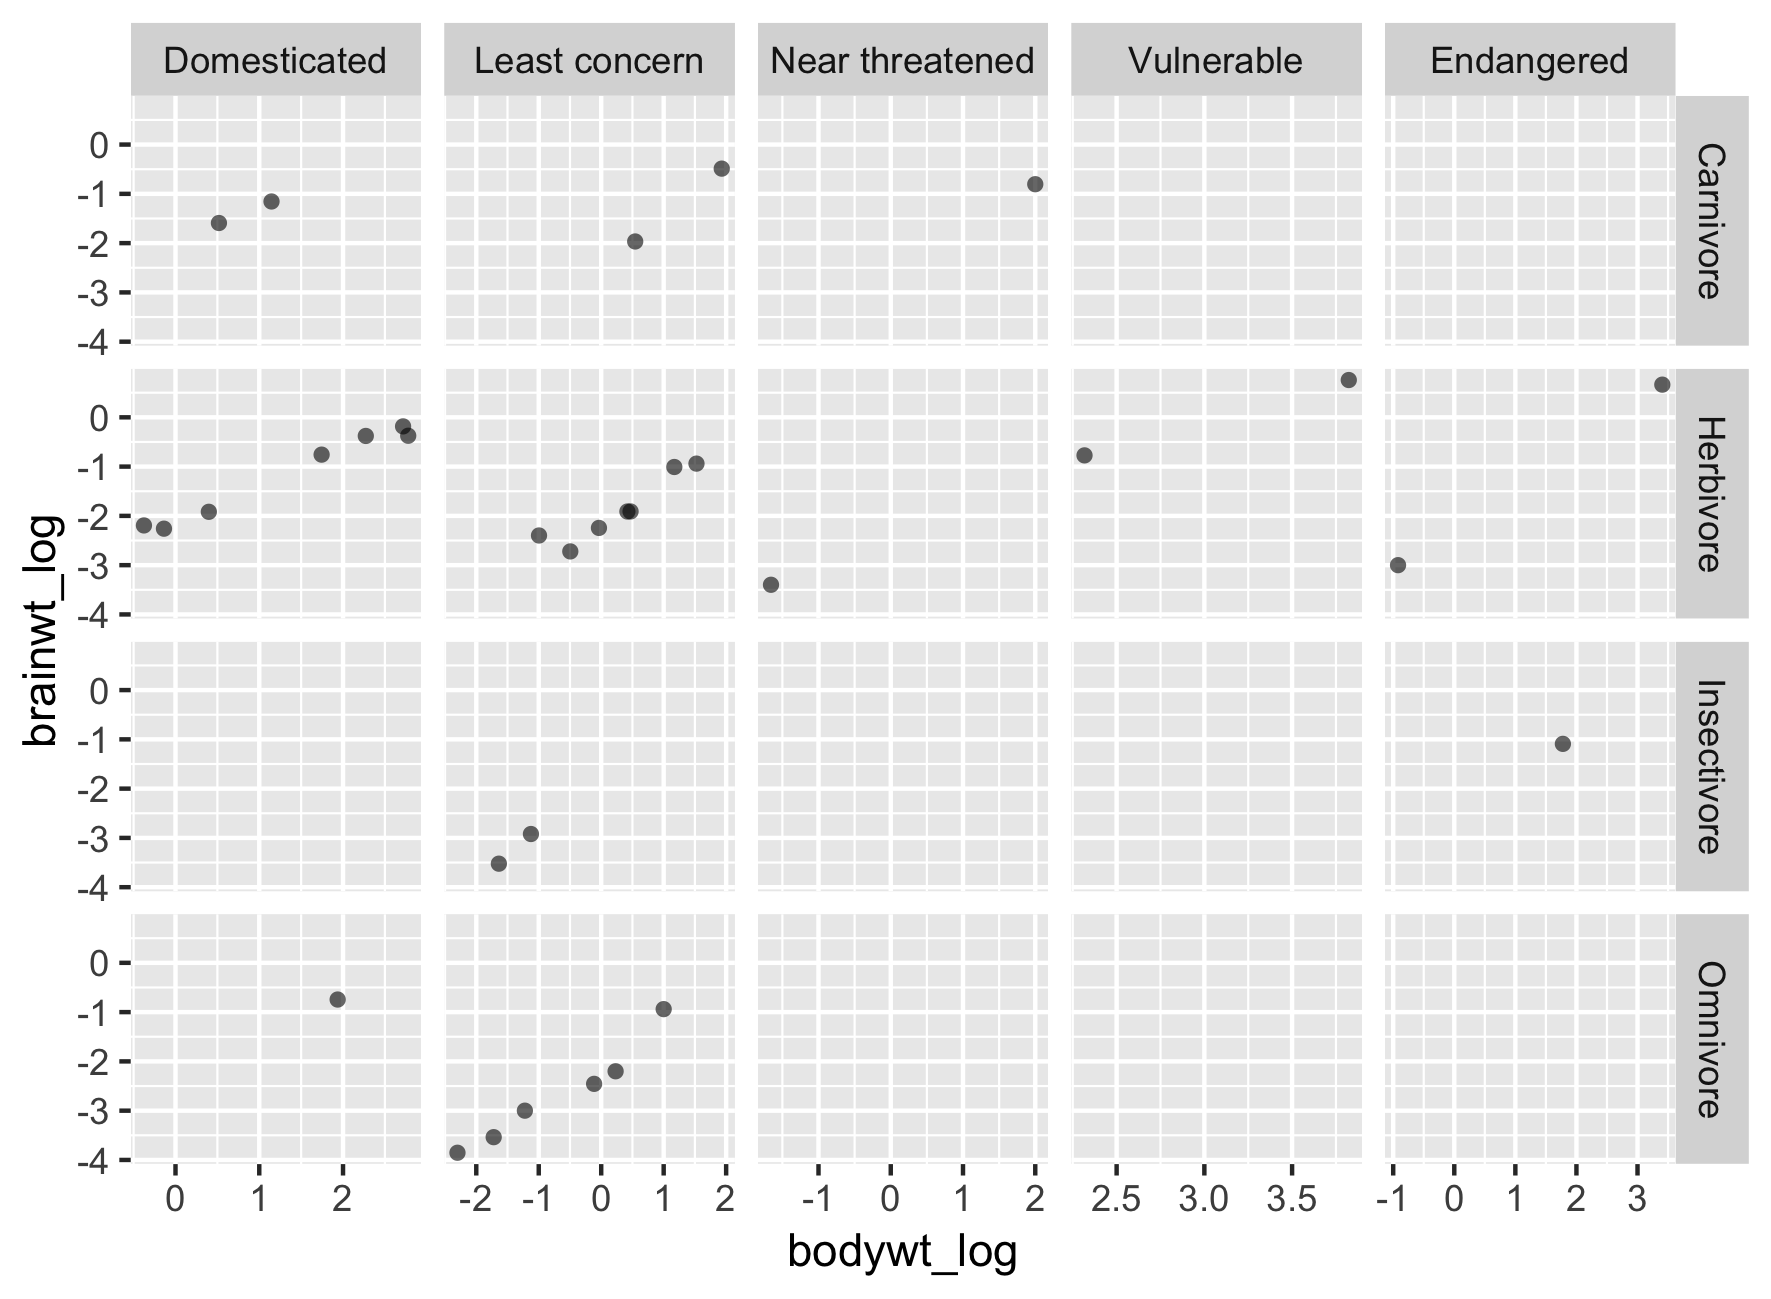
ggplot(msleep2, aes(bodywt_log,
                    brainwt_log)) +
  geom_point(alpha = 0.6, shape = 16) +
  facet_grid(rows = vars(vore),
             cols = vars(conservation),
             scales = "free_x")
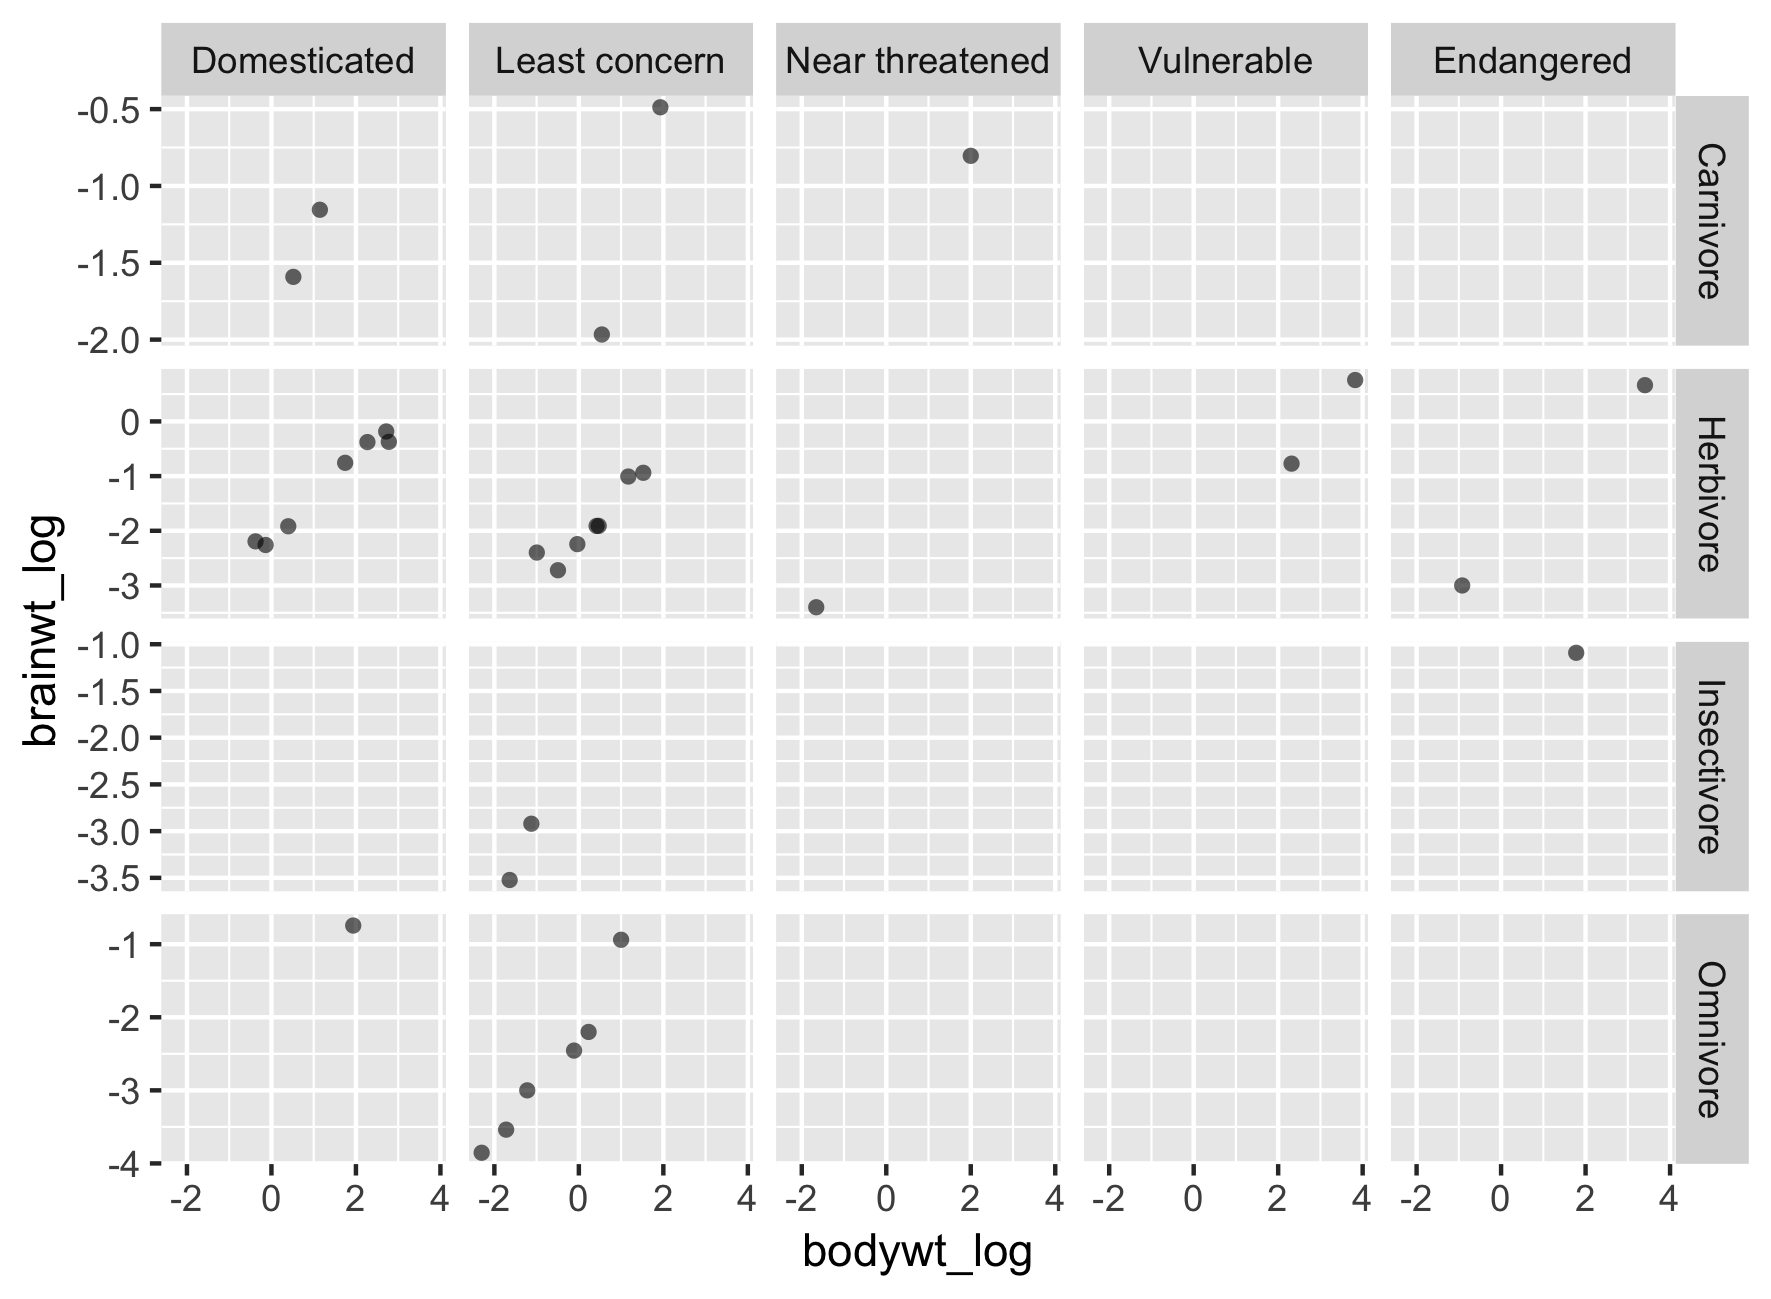
ggplot(msleep2, aes(bodywt_log,
                    brainwt_log)) +
  geom_point(alpha = 0.6, shape = 16) +
  facet_grid(rows = vars(vore),
             cols = vars(conservation),
             scales = "free_y")
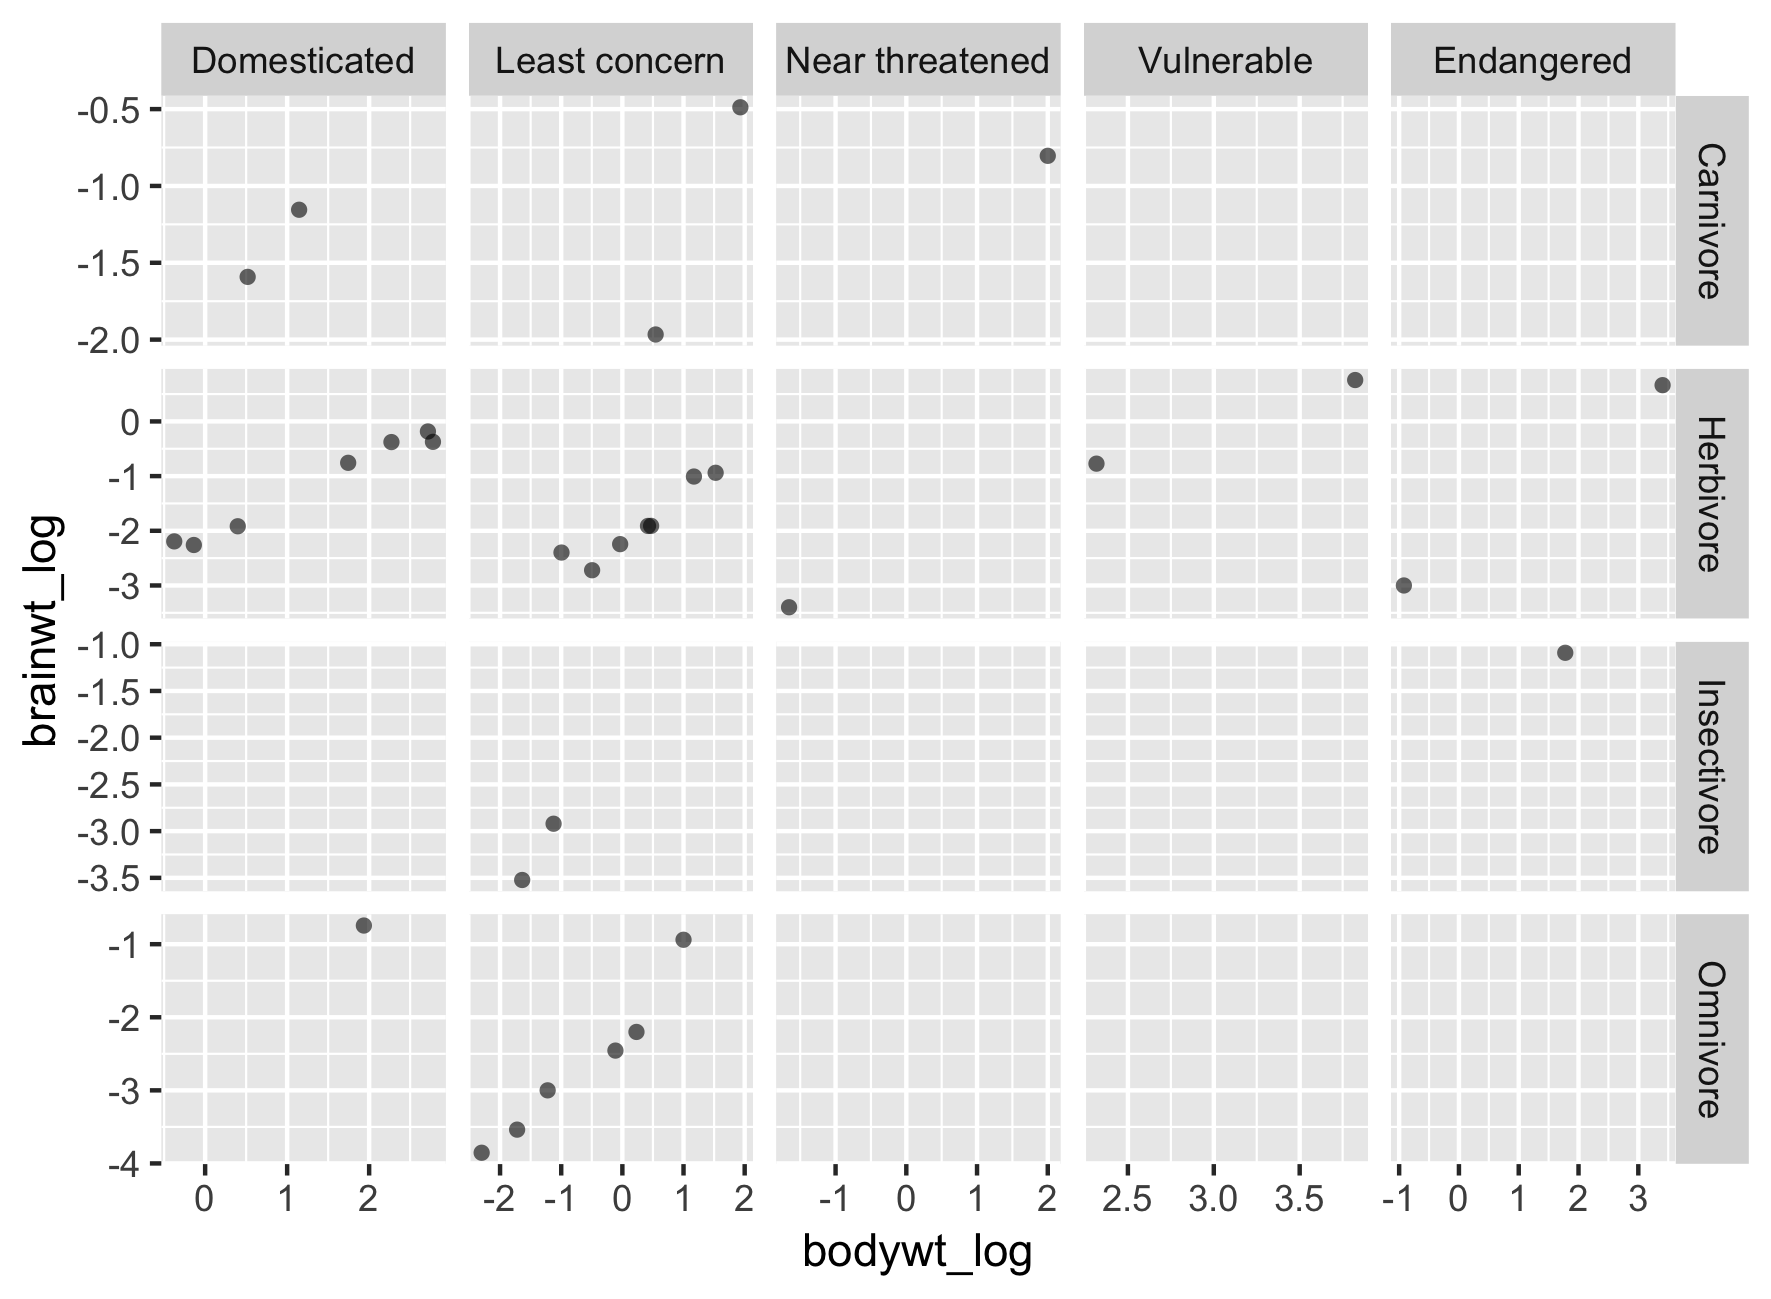
ggplot(msleep2, aes(bodywt_log,
                    brainwt_log)) +
  geom_point(alpha = 0.6, shape = 16) +
  facet_grid(rows = vars(vore),
             cols = vars(conservation),
             scales = "free")
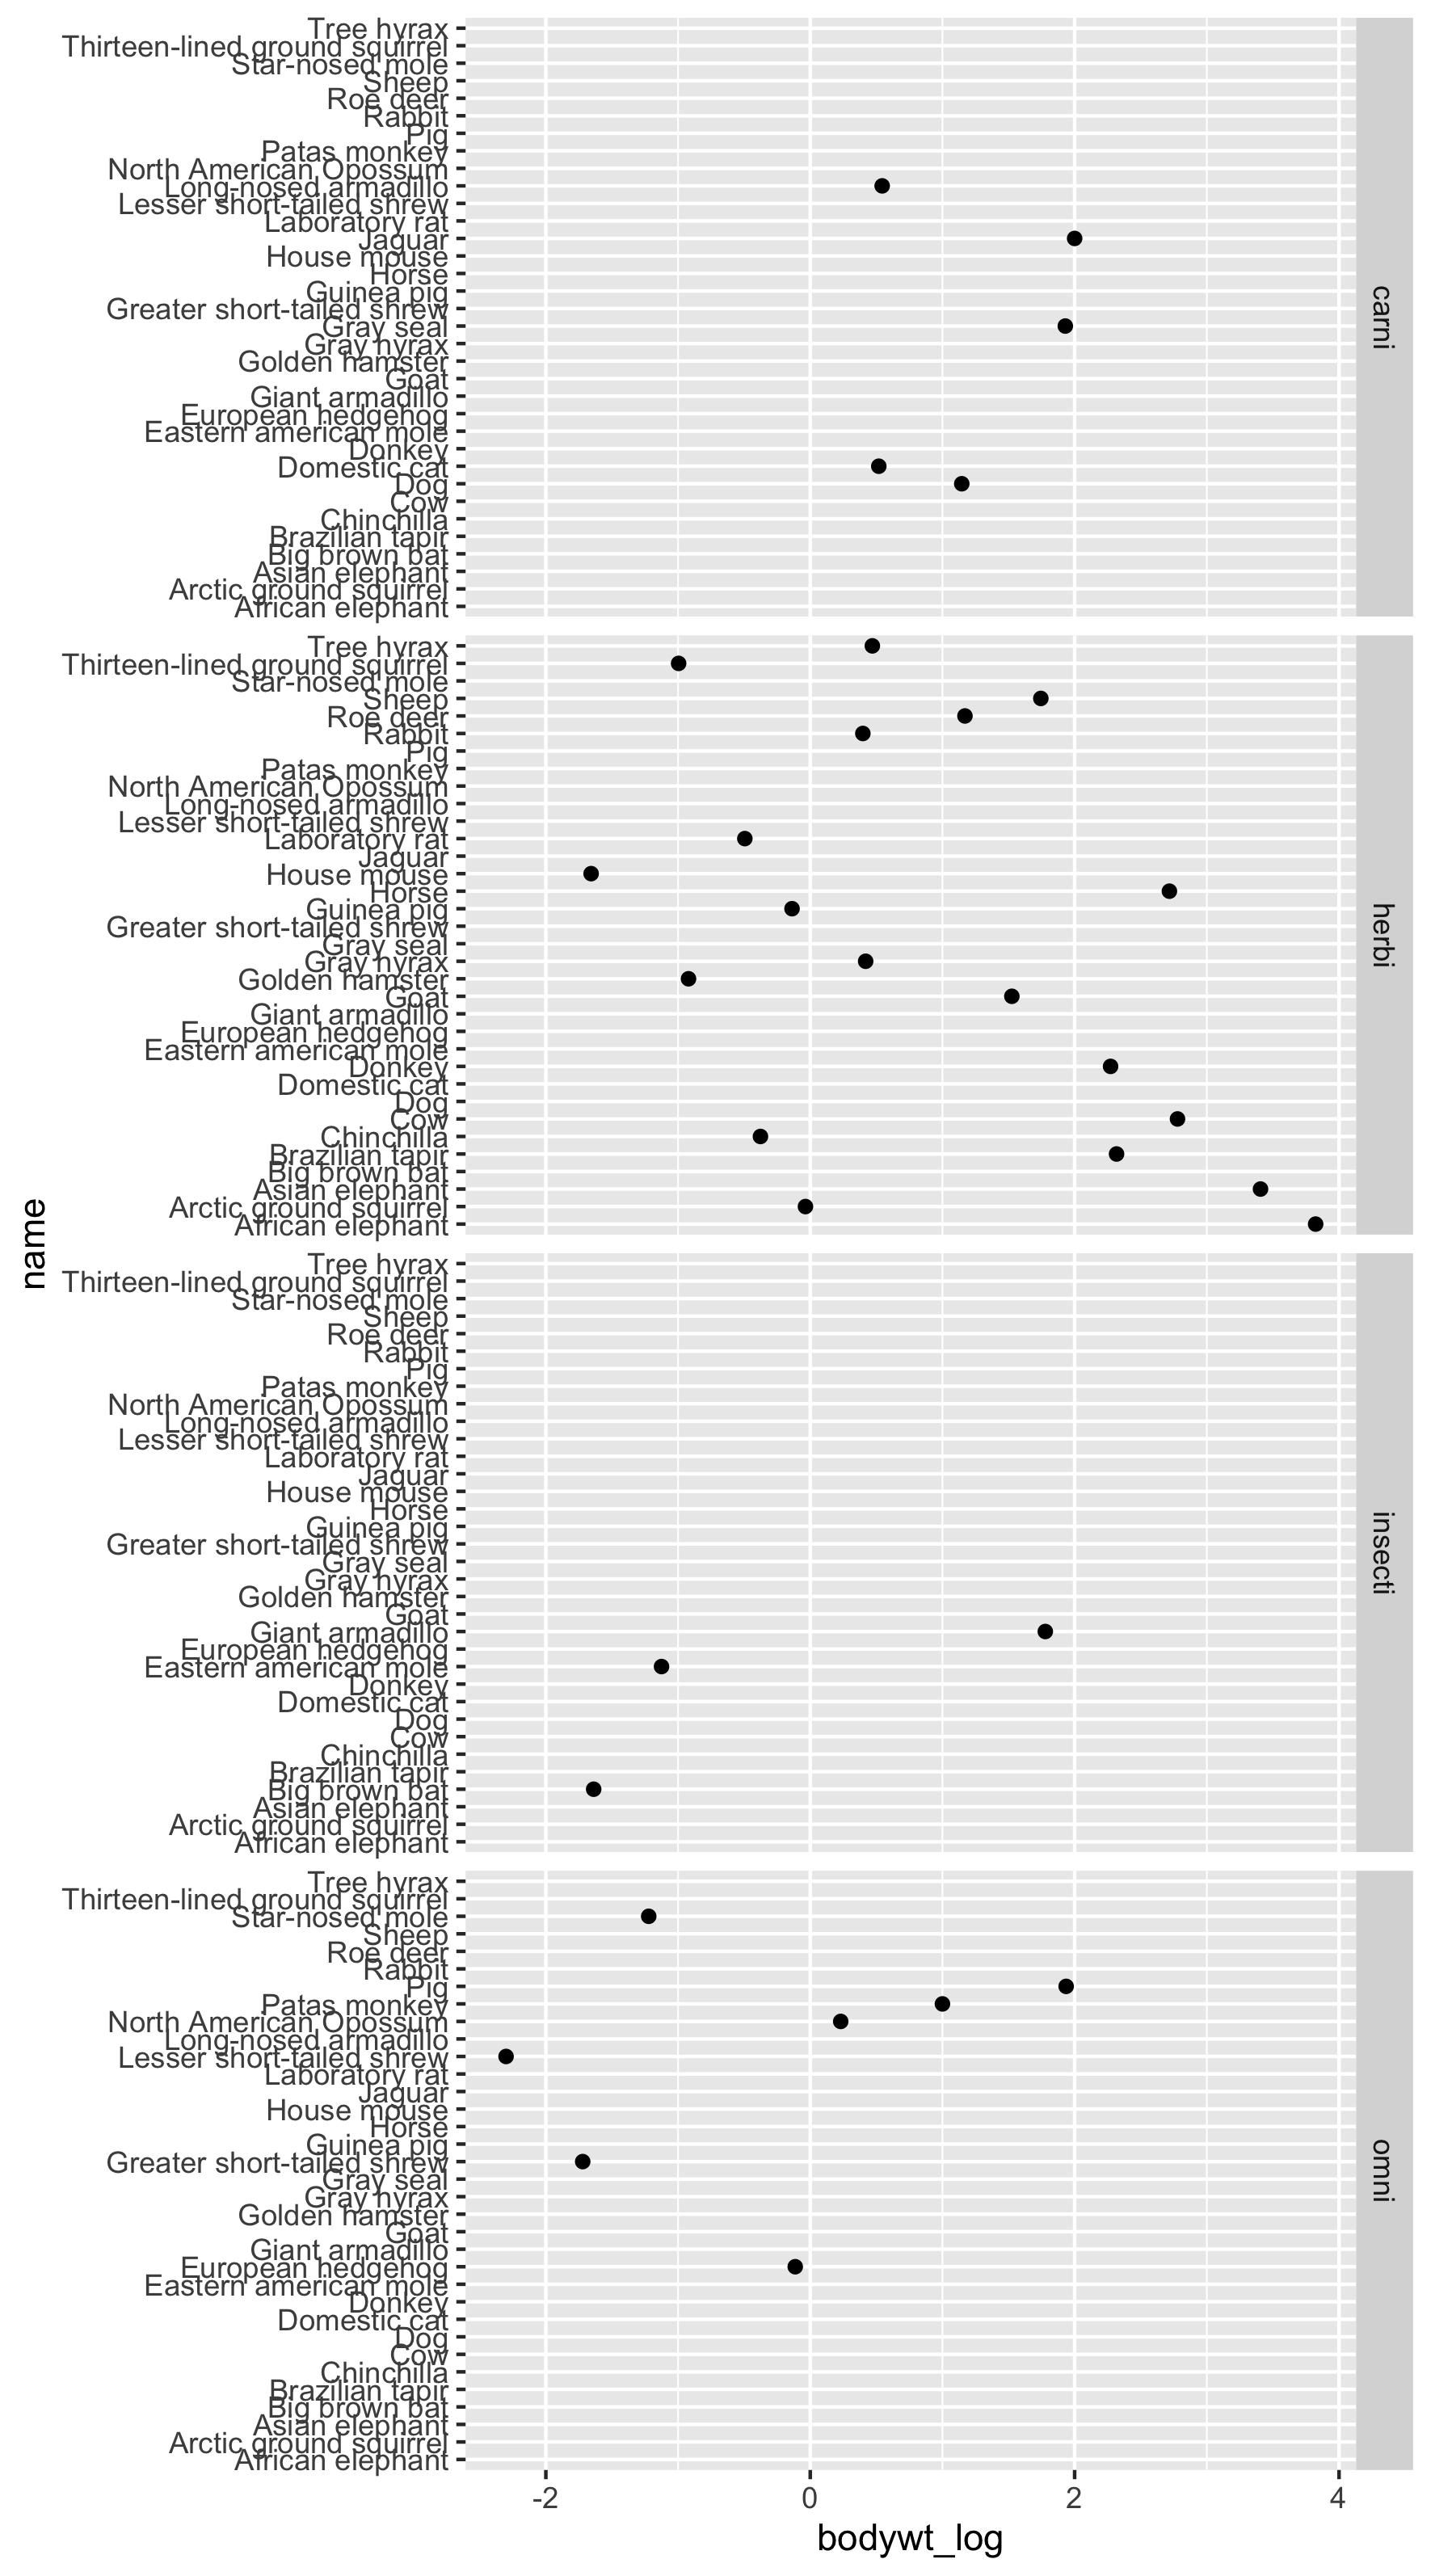
ggplot(msleep2, aes(x = bodywt_log,
                    y = name)) +
  geom_point() +
  facet_grid(rows = vars(vore))
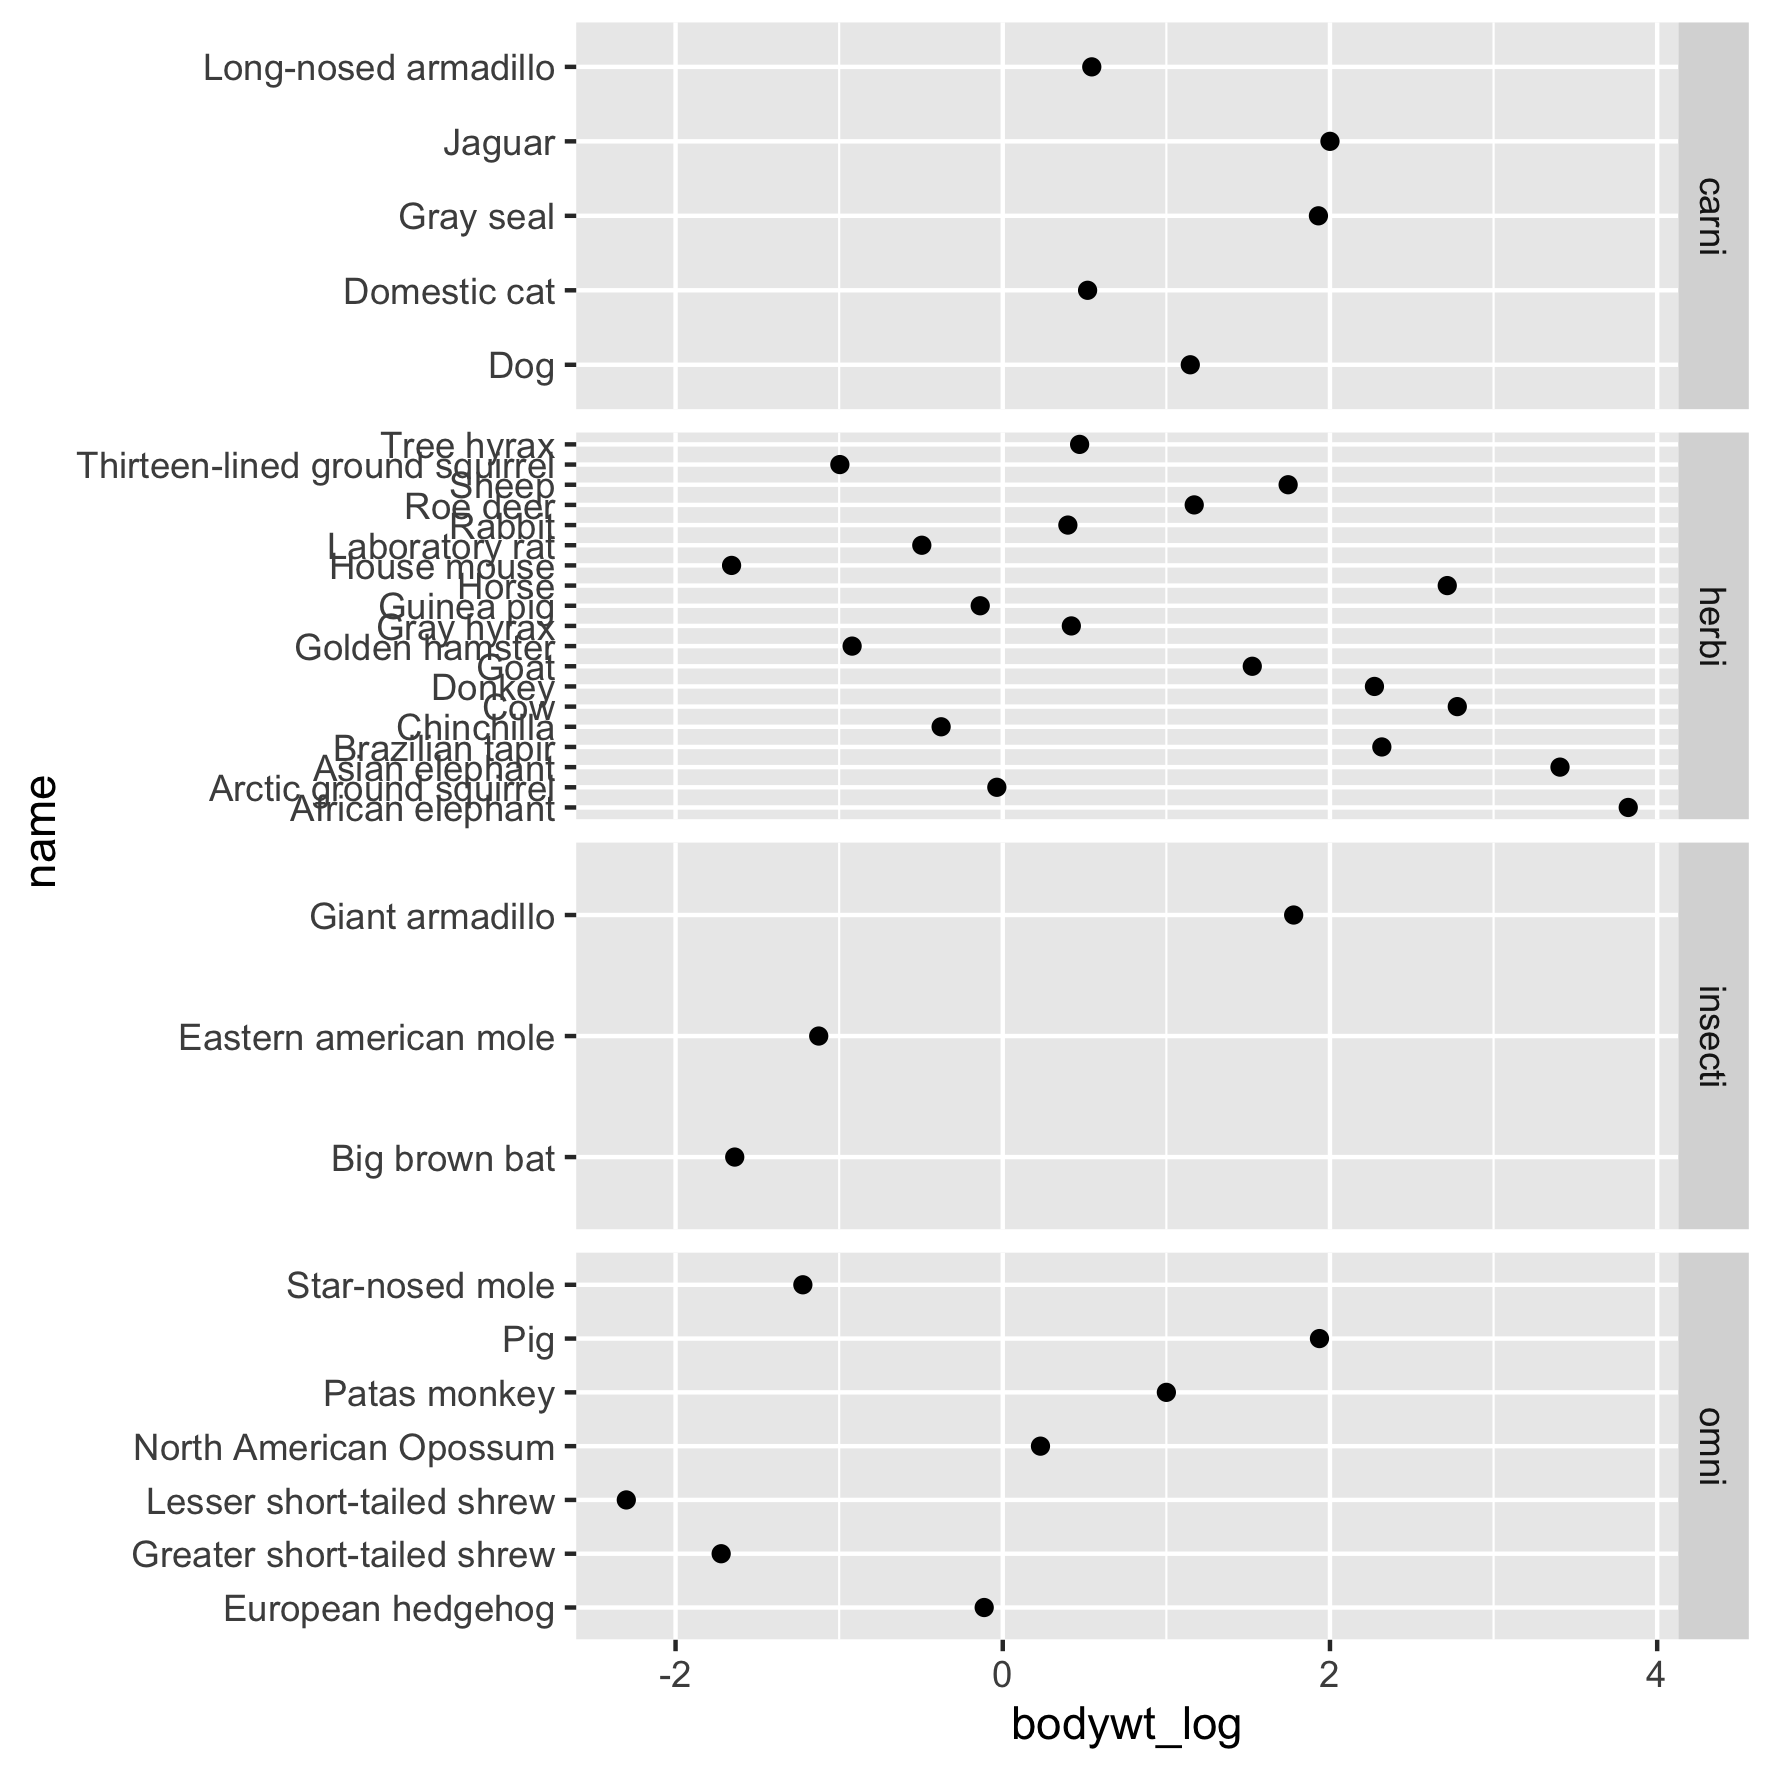
ggplot(msleep2, aes(x = bodywt_log,
                    y = name)) +
  geom_point() +
  # 釋放 y 座標尺度與空間
  facet_grid(rows = vars(vore),
             scales = "free_y")
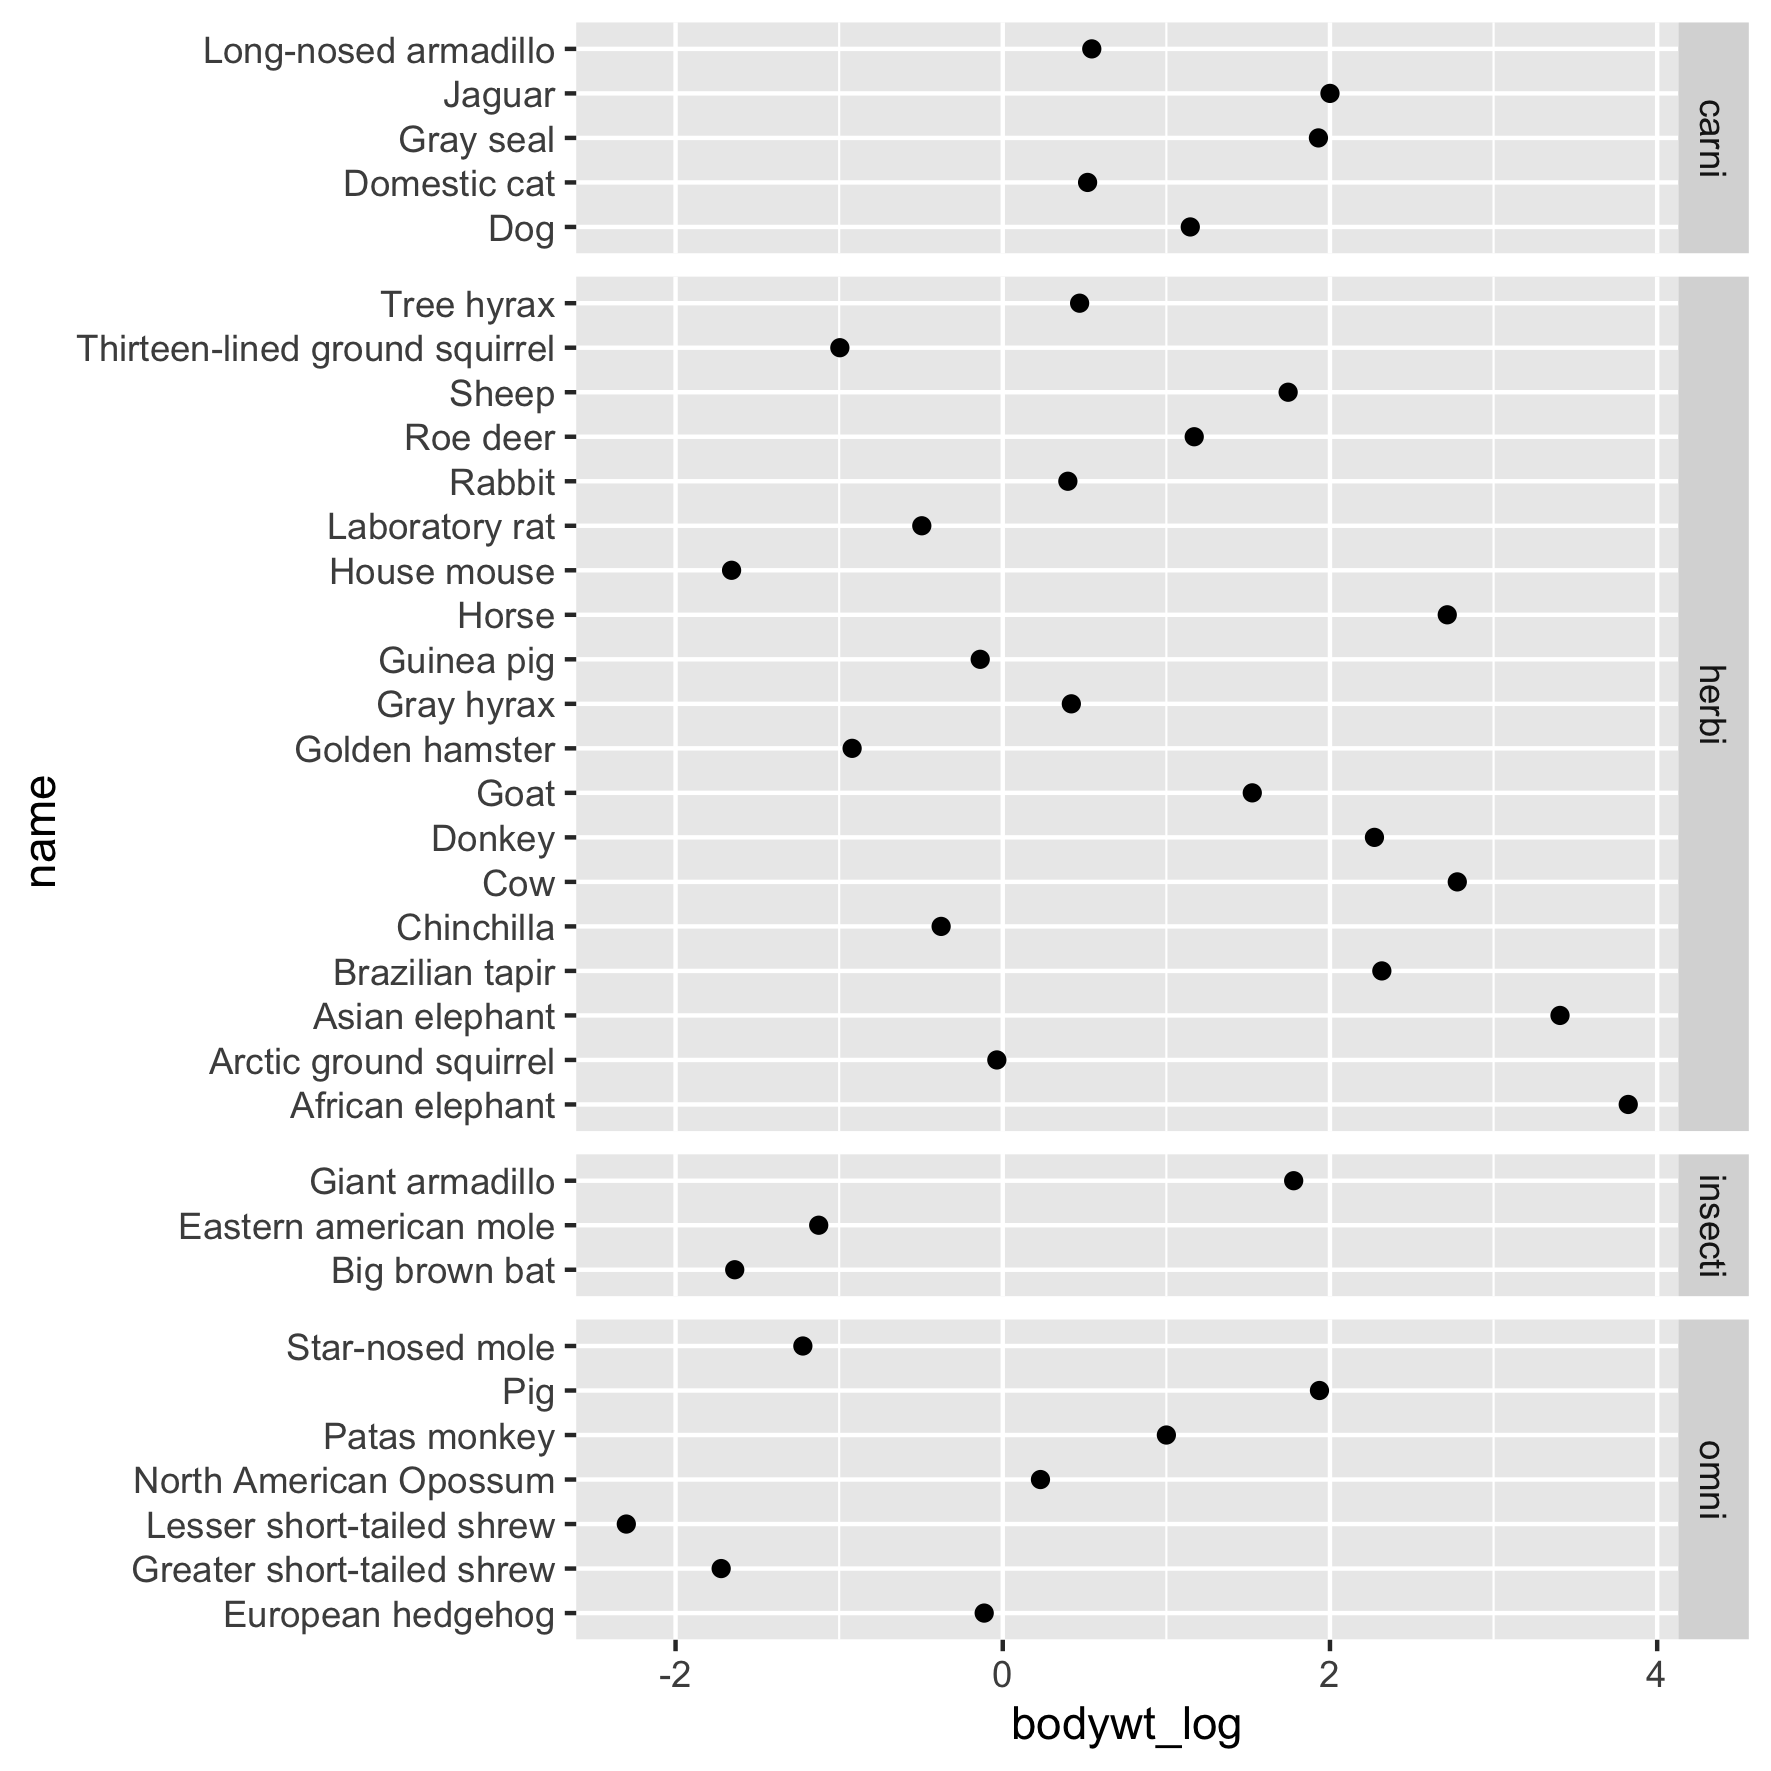
ggplot(msleep2, aes(x = bodywt_log,
                    y = name)) +
  geom_point() +
  # 釋放 y 座標尺度與空間
  facet_grid(rows = vars(vore),
             scales = "free_y",
             space = "free_y")
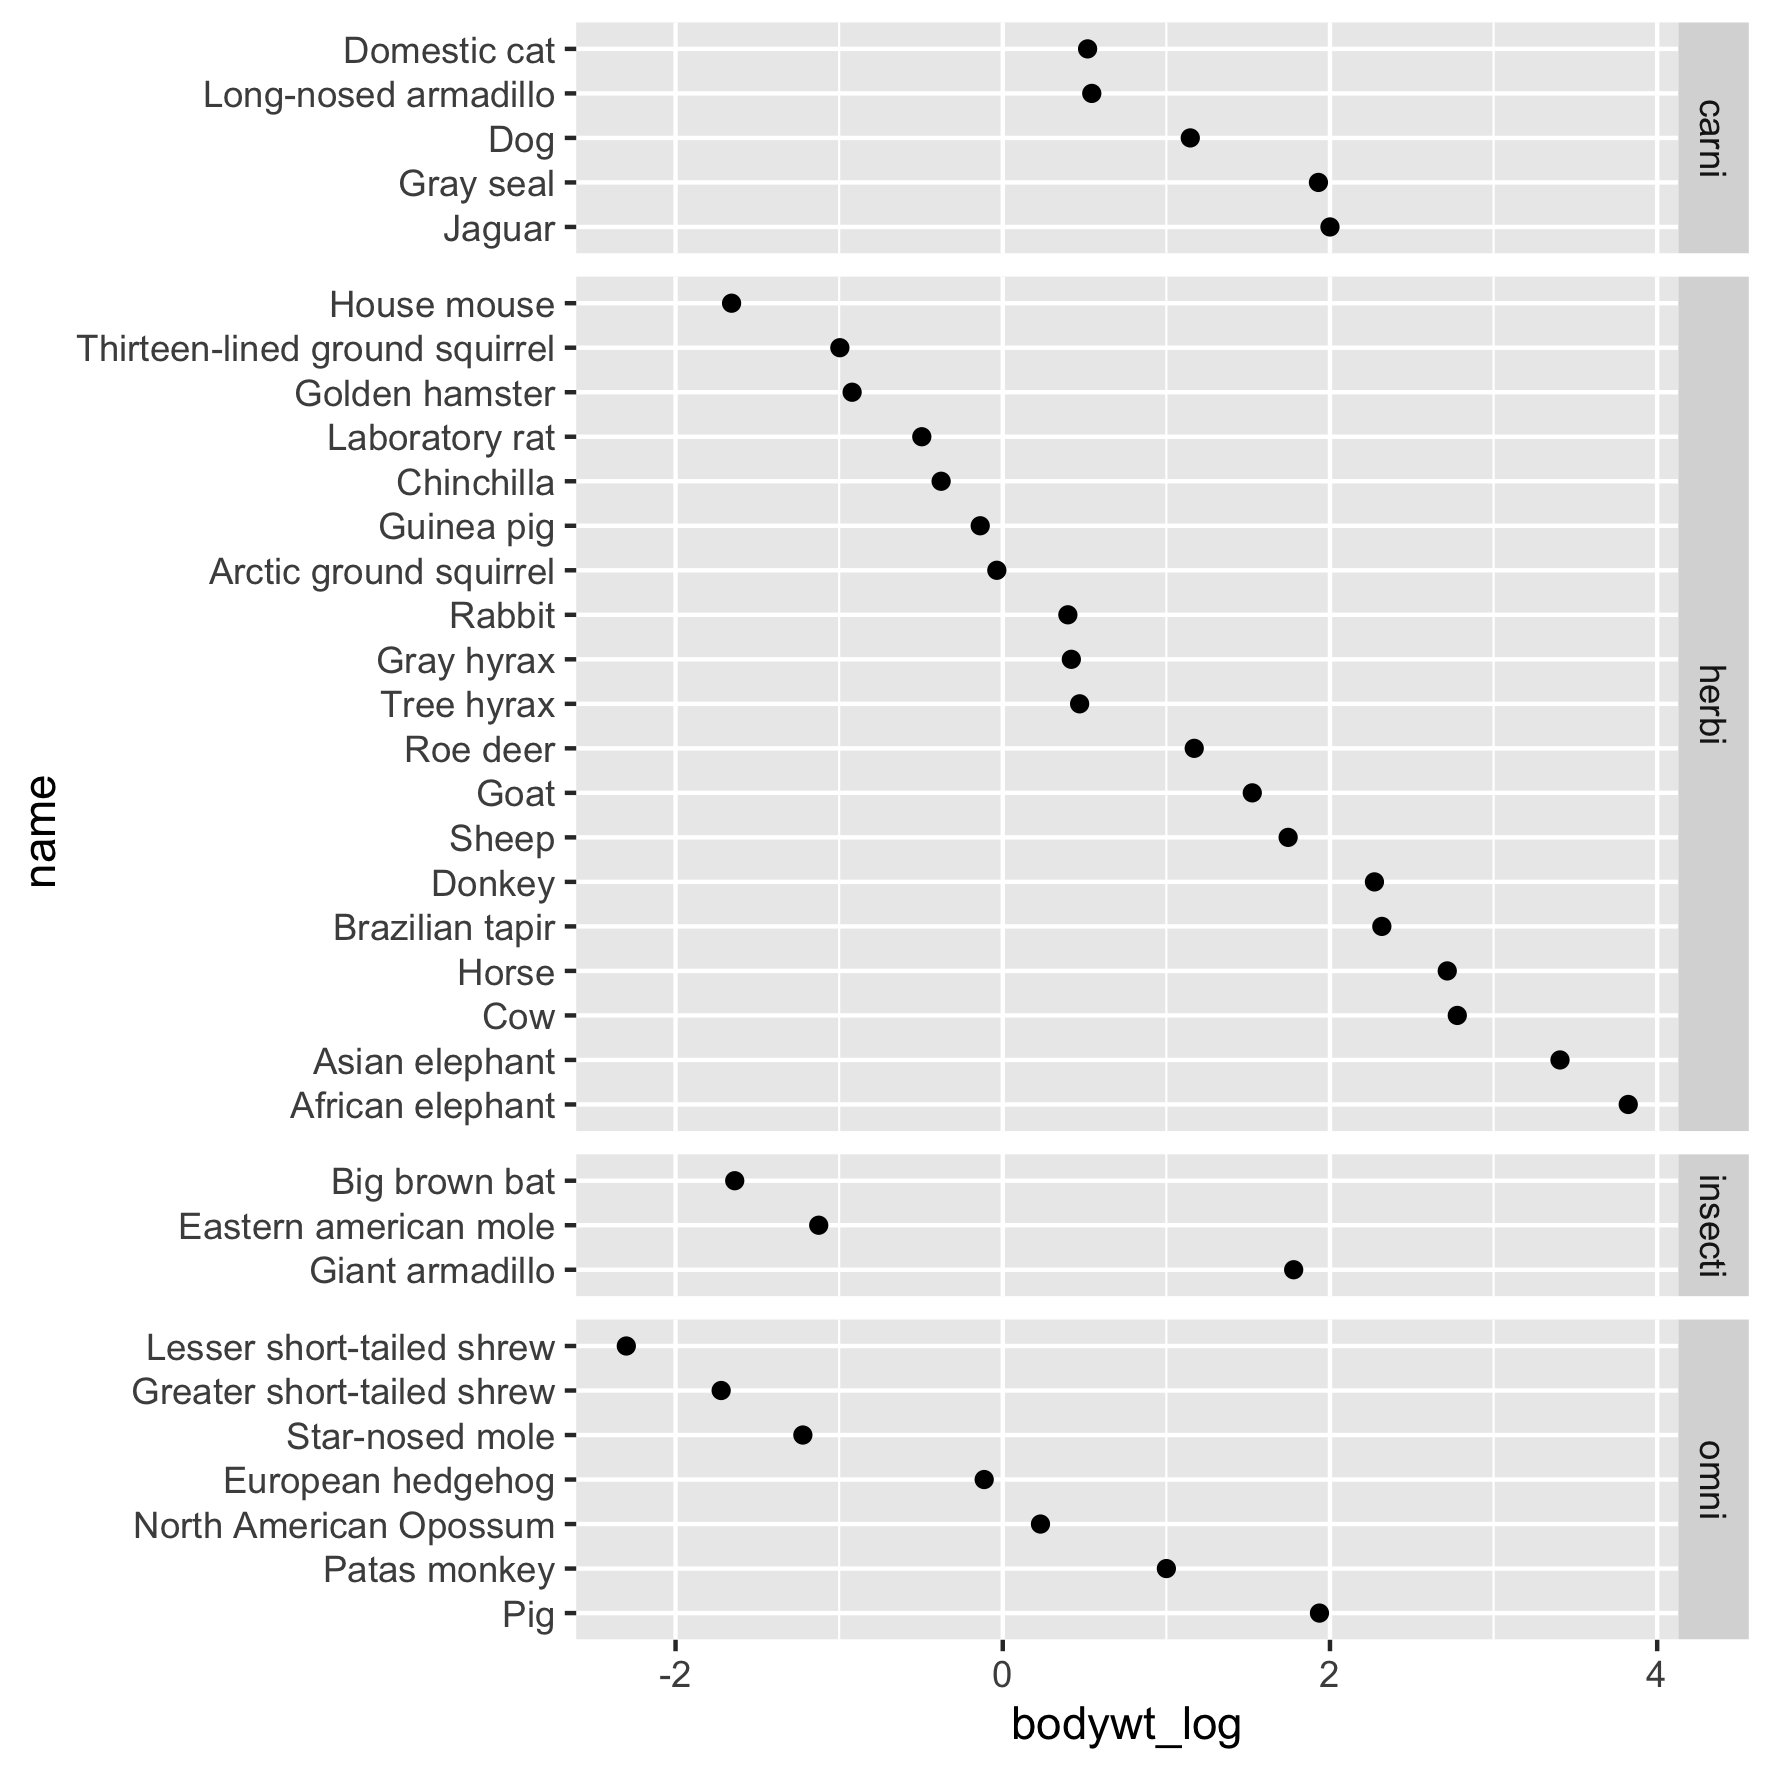
msleep2 <- msleep2 %>%
  # 依重量由高到低排序
  arrange(-bodywt_log) %>%
  # 依此順序重新定義因子層級
  mutate(name = as_factor(name))

# 新順序會反映在 y 軸
ggplot(msleep2, aes(x = bodywt_log,
                    y = name)) +
  geom_point() +
  # 釋放 y 座標尺度與空間
  facet_grid(rows = vars(vore),
             scales = "free_y",
             space = "free_y")