座標層

ggplot2 中級資料視覺化

Rick Scavetta

Founder, Scavetta Academy

Coordinates 層

  • 控制圖形尺寸
  • coord_
    • 例如 coord_cartesian()
ggplot2 中級資料視覺化

放大檢視

  • coord_cartesian(xlim = ...)
  • scale_x_continuous(limits = ...)
  • xlim(...)
ggplot2 中級資料視覺化

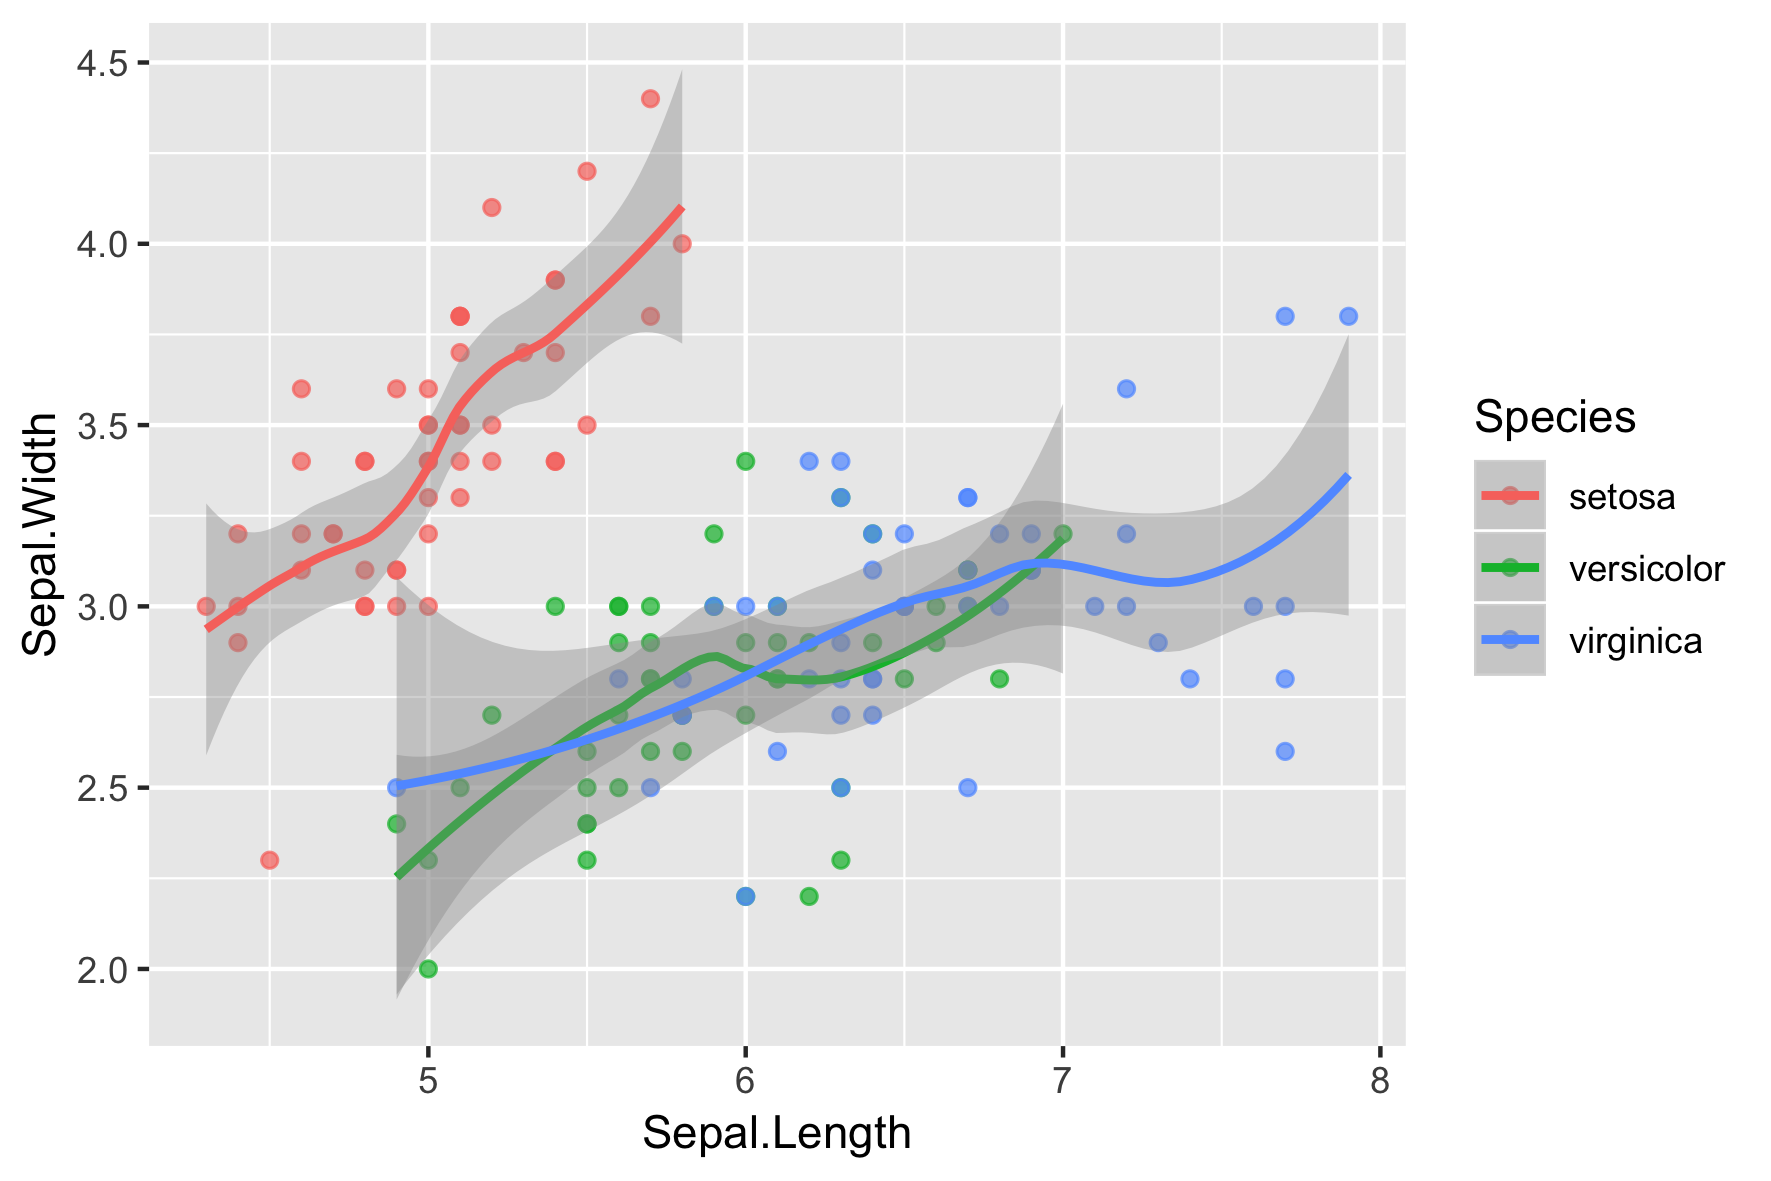
原始圖

iris.smooth <- ggplot(
  iris, 
  aes(x = Sepal.Length, 
      y = Sepal.Width, 
      color = Species)
  ) + 
  geom_point(alpha = 0.7) +
  geom_smooth()

iris.smooth 

ggplot2 中級資料視覺化

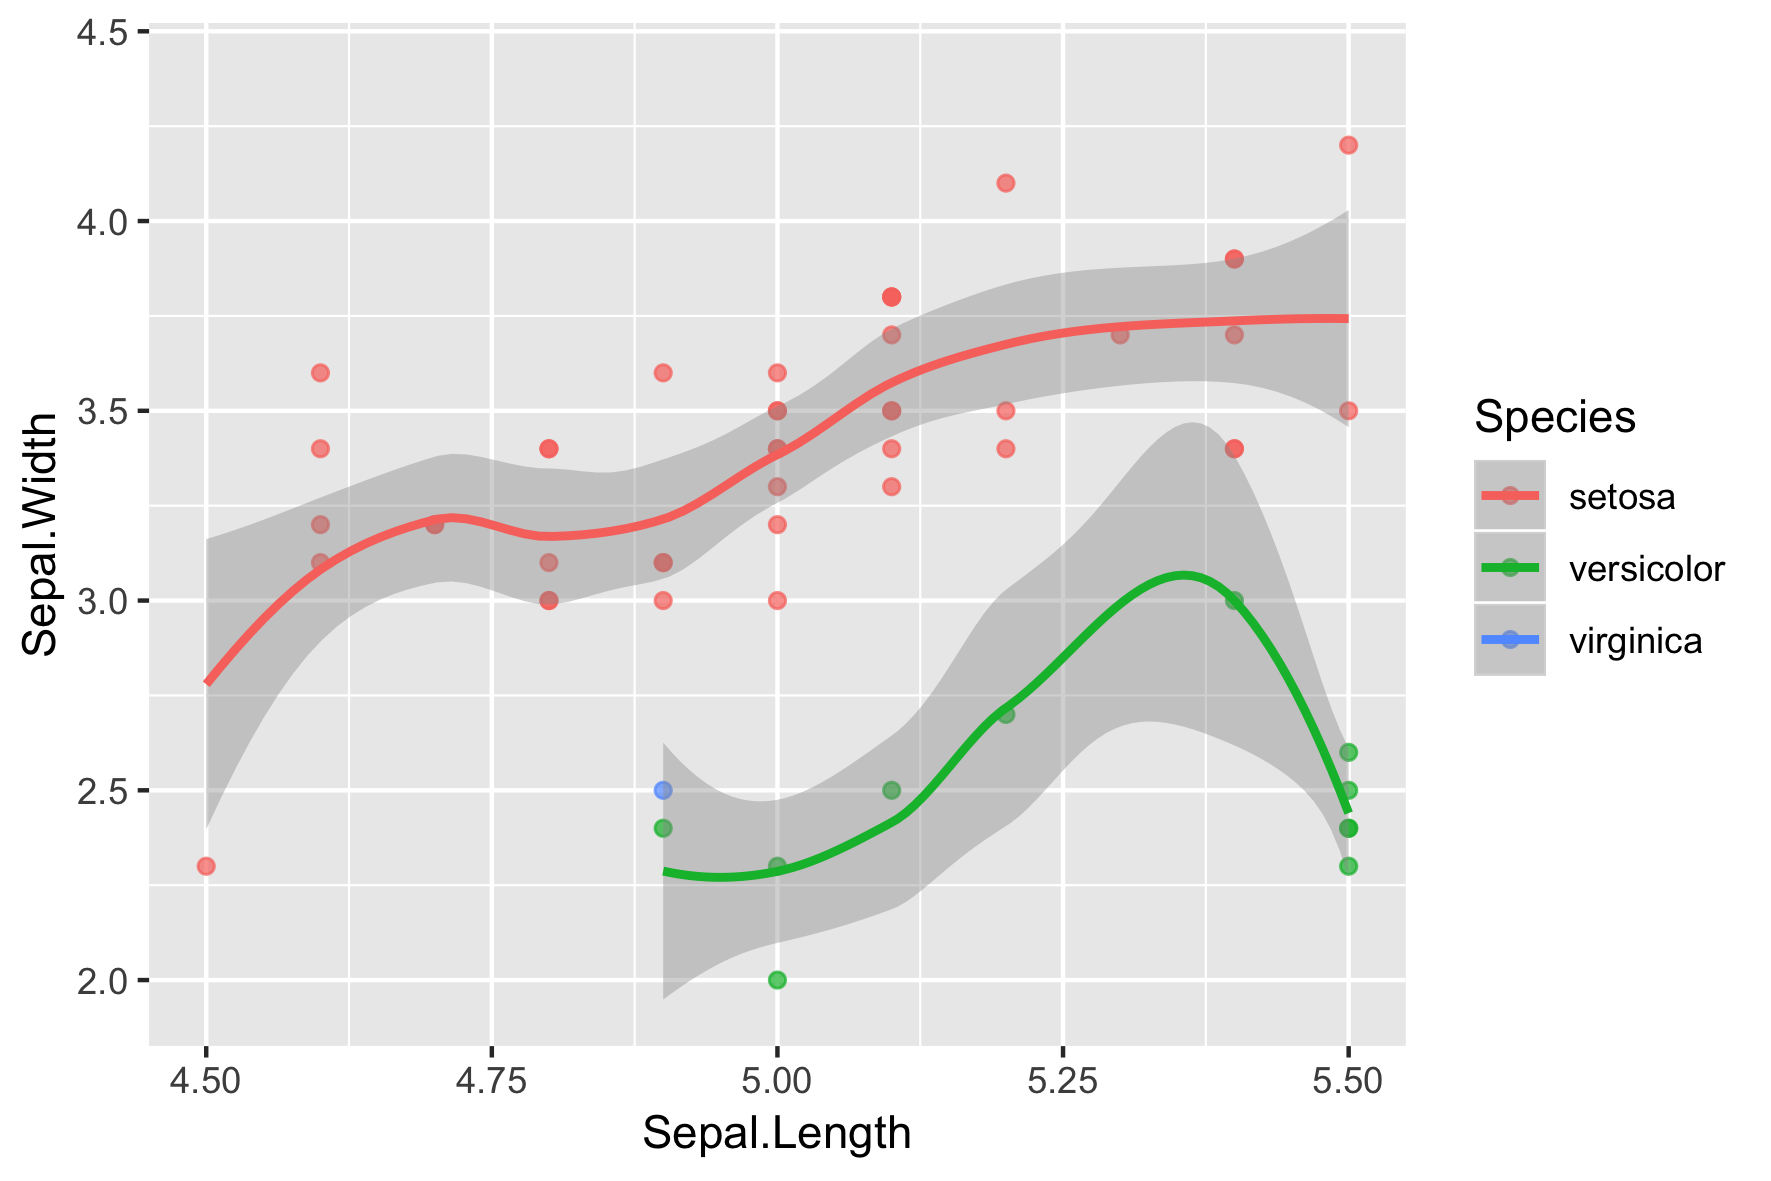
scale_x_continuous()

iris.smooth + 
  scale_x_continuous(limits = c(4.5, 5.5))
Removed 95 rows containing non-finite values 
(stat_smooth).
Removed 95 rows containing missing values 
(geom_point).

ggplot2 中級資料視覺化

scale_x_continuous()

原始圖

scale_x_continuous() 放大

部分原始資料被過濾掉了!

ggplot2 中級資料視覺化

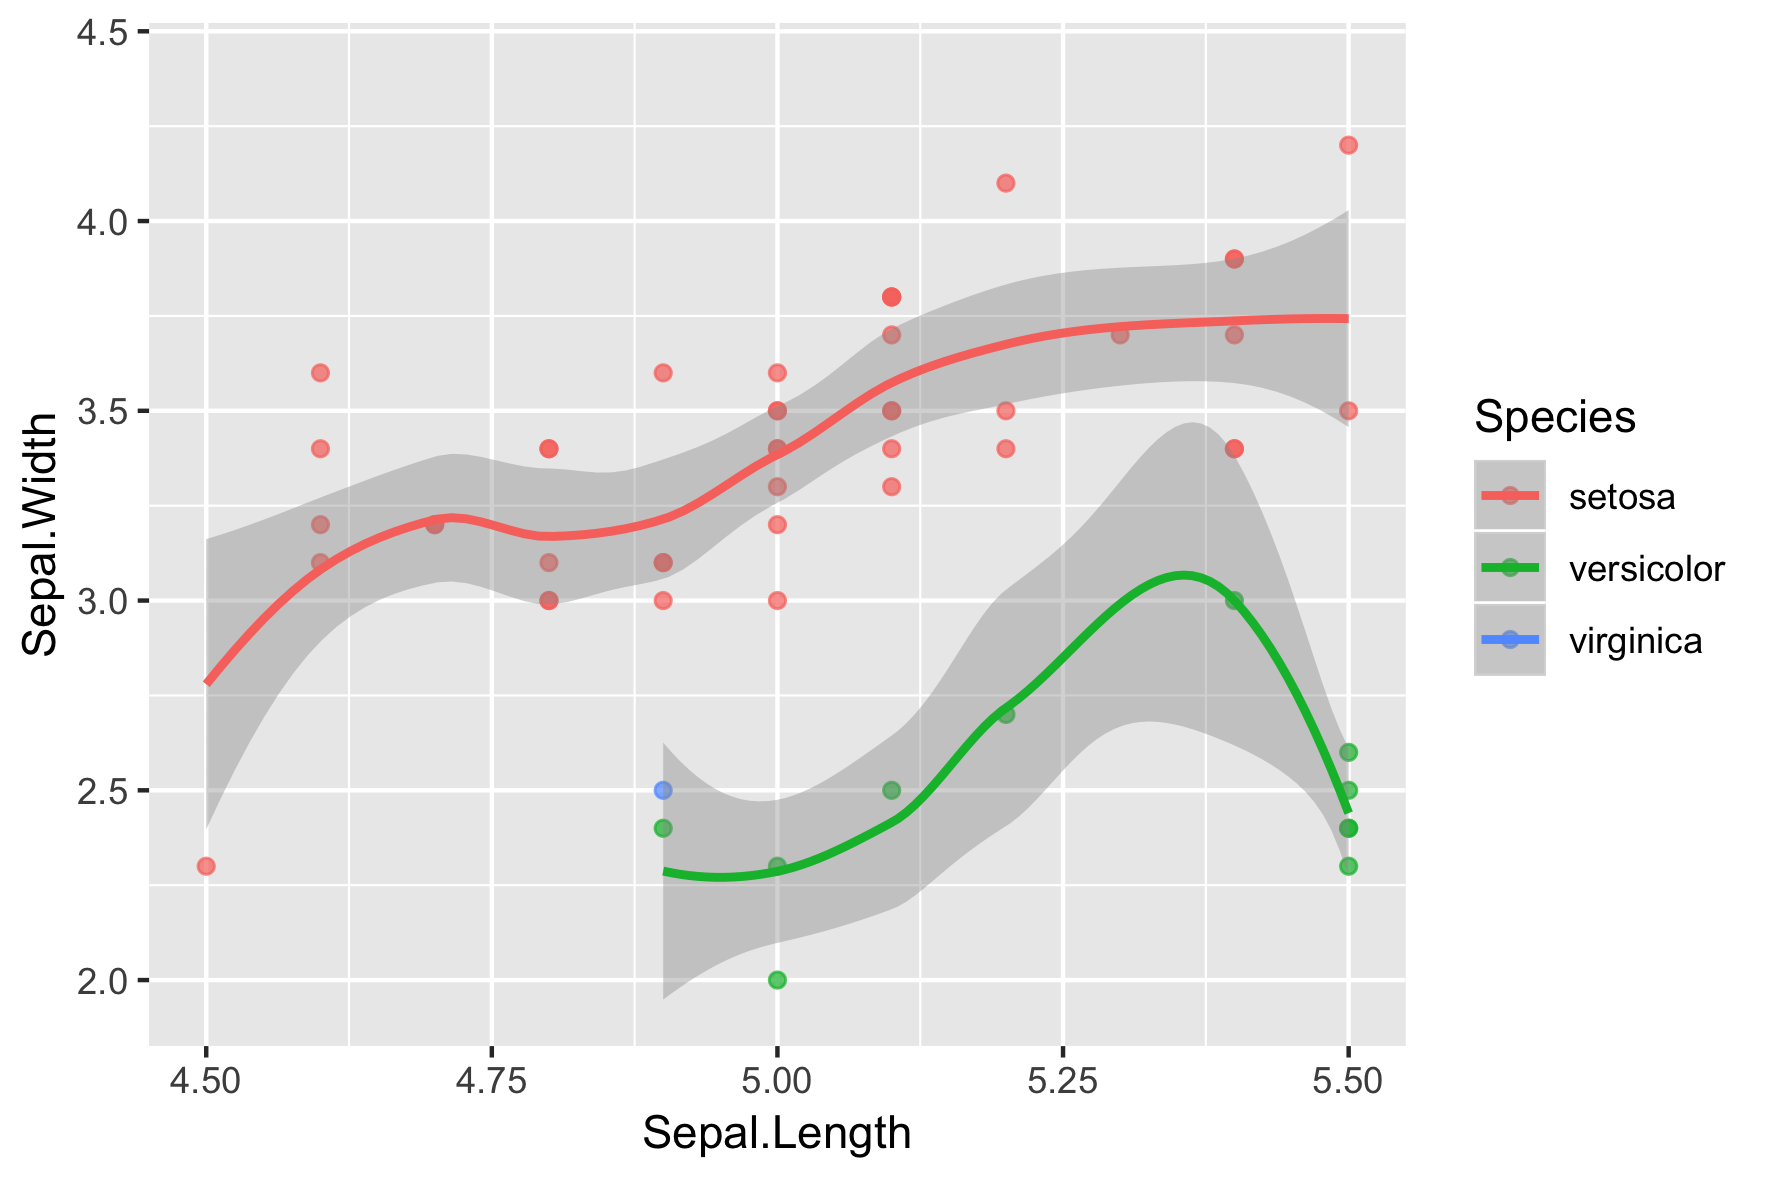
xlim()

iris.smooth +
  xlim(c(4.5, 5.5))
Removed 95 rows containing non-finite values 
(stat_smooth).
Removed 95 rows containing missing values 
(geom_point).

ggplot2 中級資料視覺化

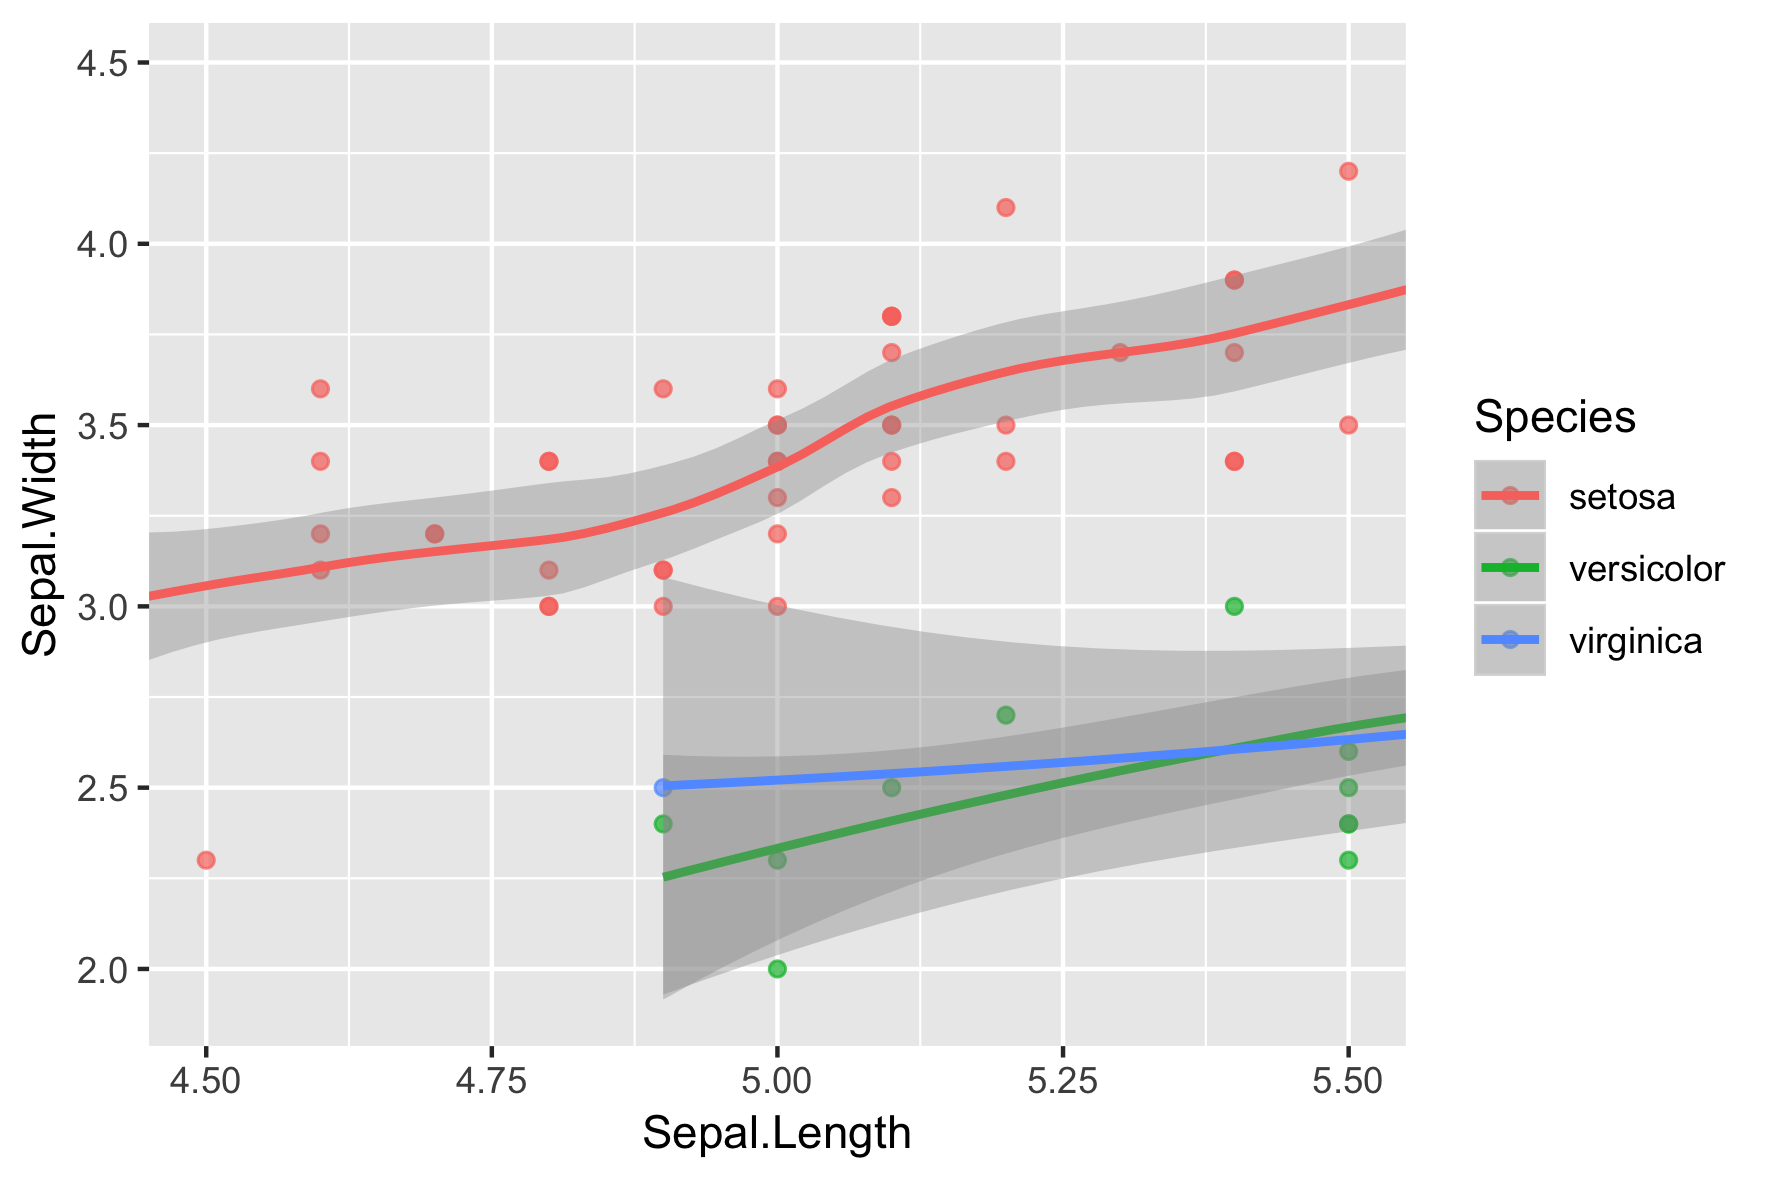
coord_cartesian()

iris.smooth +
  coord_cartesian(xlim = c(4.5, 5.5))

ggplot2 中級資料視覺化

長寬比

  • 高寬比
  • 小心誤導!
  • 目前沒有通用標準
  • 若同尺度通常用 1:1
ggplot2 中級資料視覺化

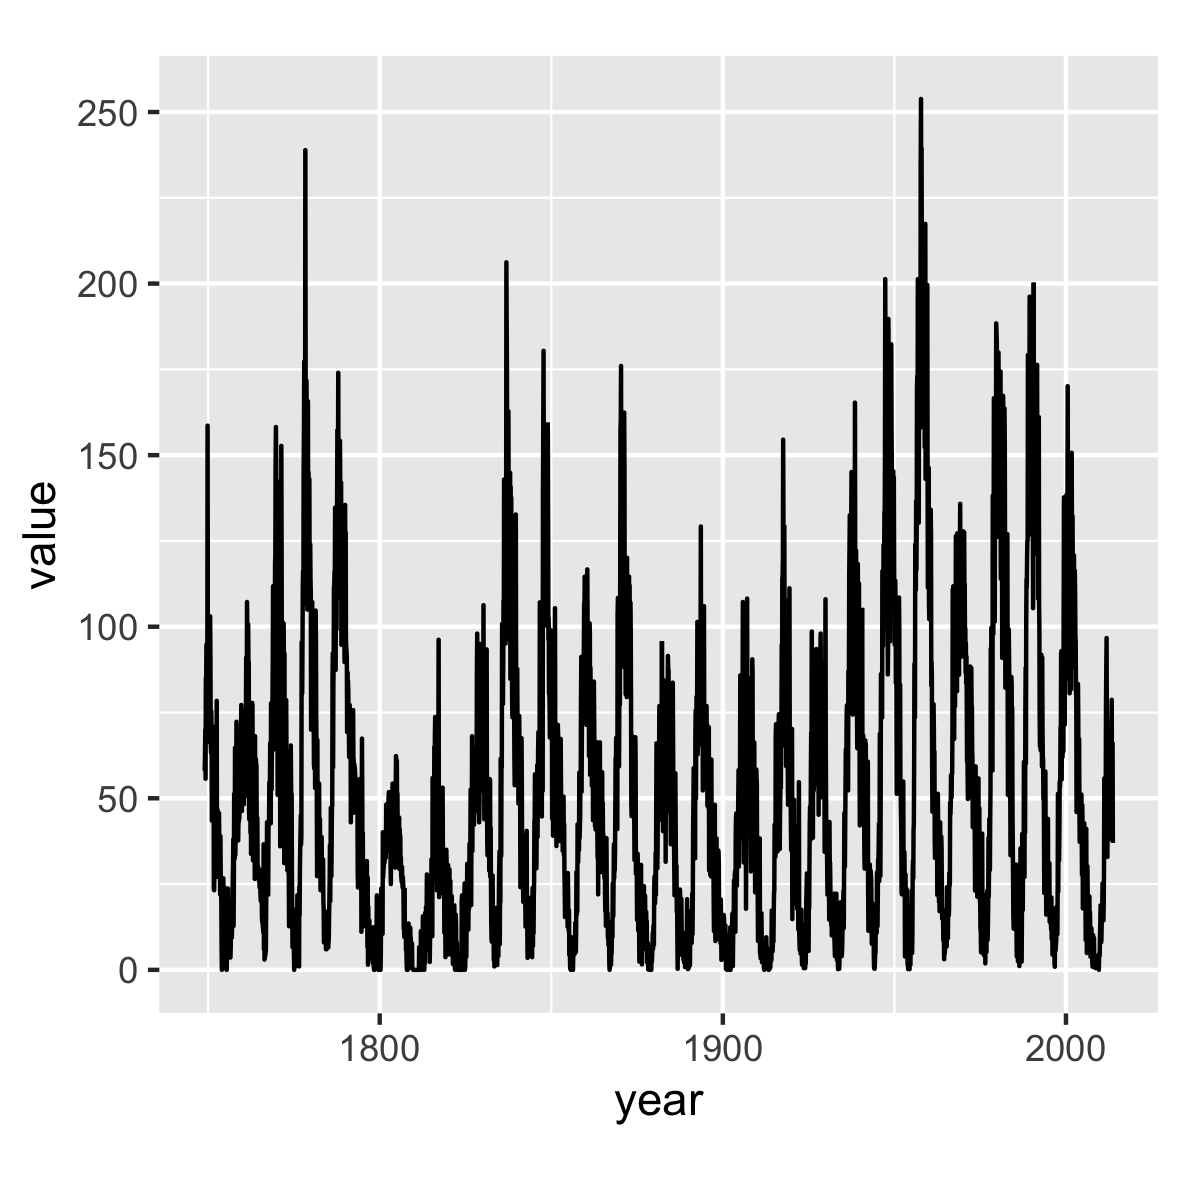
黑子(Sunspots)

library(zoo)
sunspots.m <- data.frame(
    year = index(sunspot.month),
    value = reshape2::melt(sunspot.month)$value)
)

ggplot(sunspots.m, aes(x = year, y = value)) +
  geom_line() +
  coord_fixed() # default to 1:1 aspect ratio

ggplot2 中級資料視覺化

黑子(Sunspots)

ggplot(sunspots.m, aes(x = year, y = value)) +
  geom_line() +
  coord_fixed(0.055)

ggplot2 中級資料視覺化

一起來練習吧!

ggplot2 中級資料視覺化

Preparing Video For Download...