ggplot2 中級資料視覺化
Rick Scavetta
Founder, Scavetta Academy
Observations: 76
Variables: 3
$ vore  <chr> "carni", "omni", "herbi", "omni", "herbi", "herbi", "carni", …
$ total <dbl> 12.1, 17.0, 14.4, 14.9, 4.0, 14.4, 8.7, 10.1, 3.0, 5.3, 9.4, …
$ rem   <dbl> NA, 1.8, 2.4, 2.3, 0.7, 2.2, 1.4, 2.9, NA, 0.6, 0.8, 0.7, 1.5…
d <- ggplot(sleep, aes(vore, total)) +
 # ...

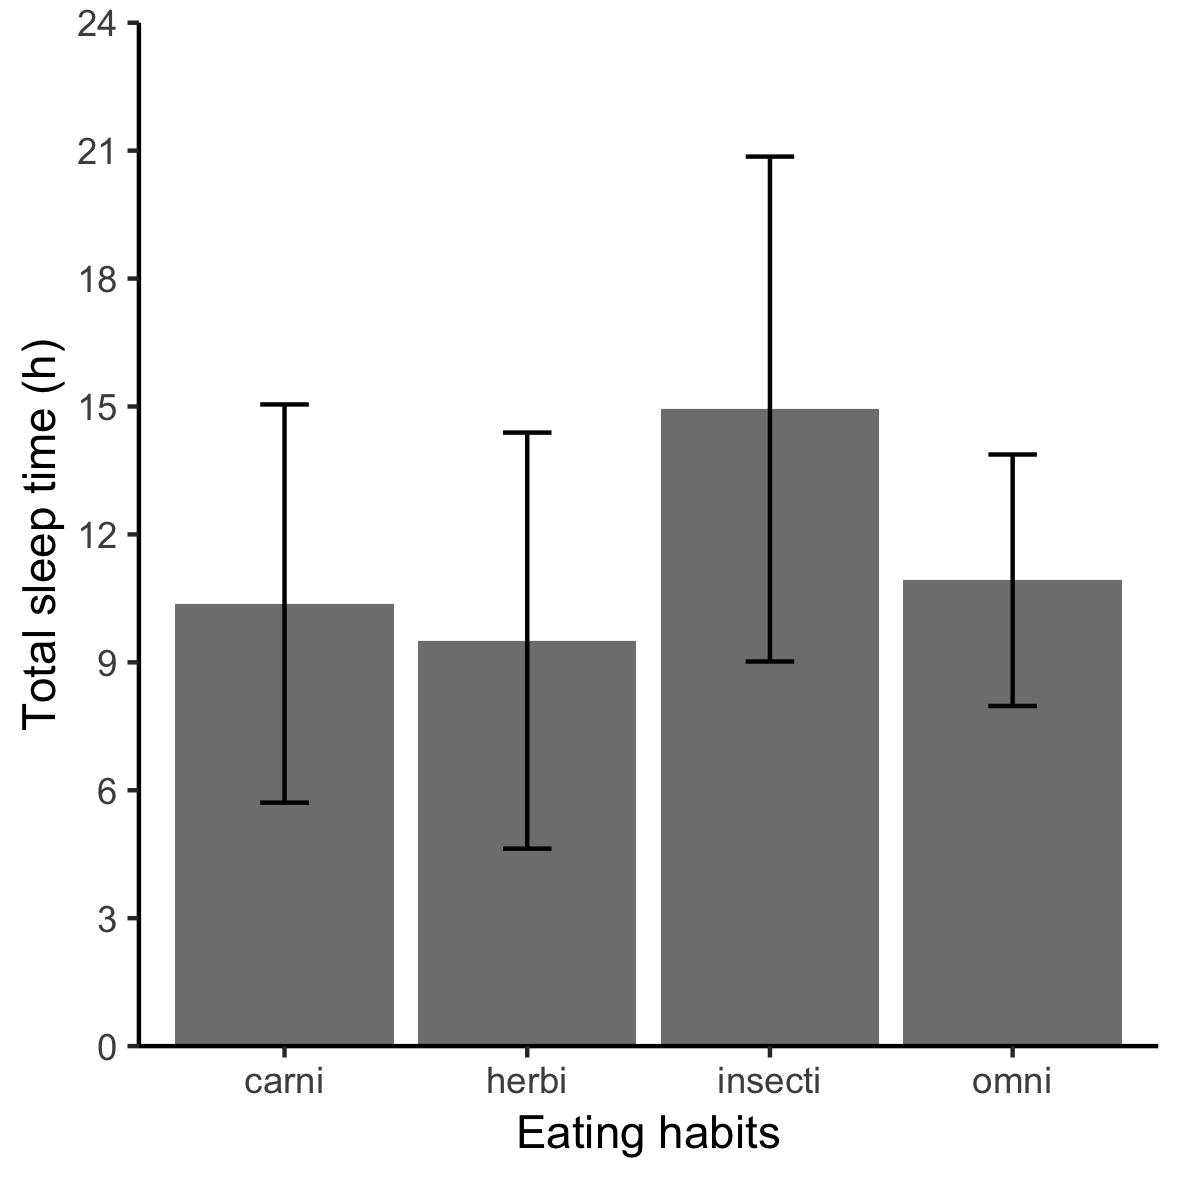
d +
  stat_summary(fun = mean,
               geom = "bar",
               fill = "grey50") +
  stat_summary(fun.data = mean_sdl,
               fun.args = list(mult = 1),
               geom = "errorbar",
               width = 0.2)
# position
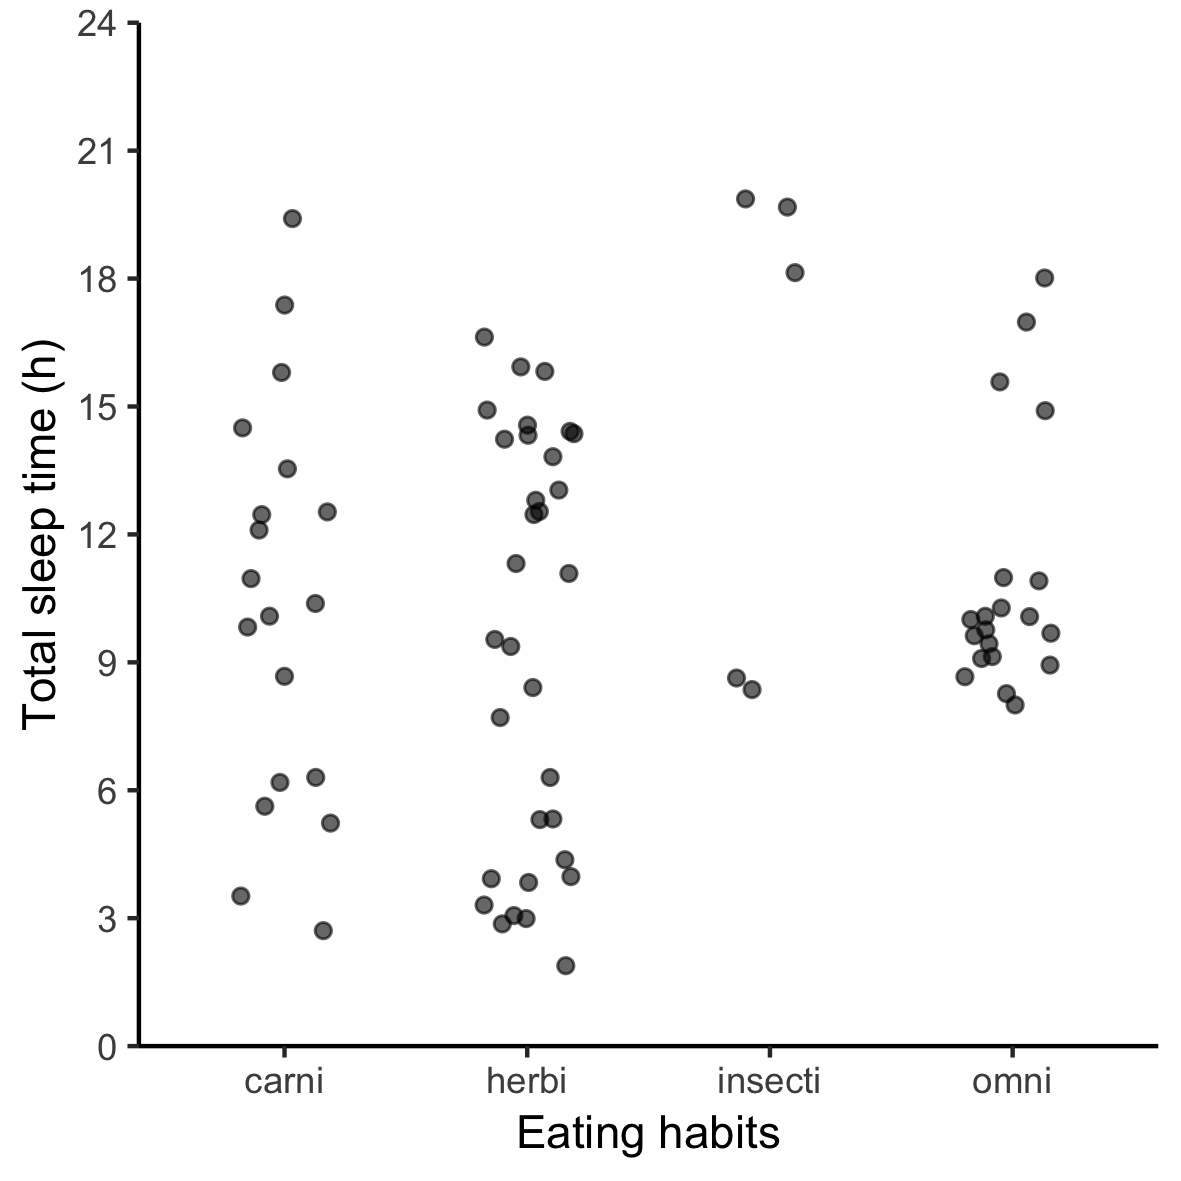
posn_j <- position_jitter(width = 0.2)

# plot
d +
  geom_point(alpha = 0.6,
             position = posn_j)
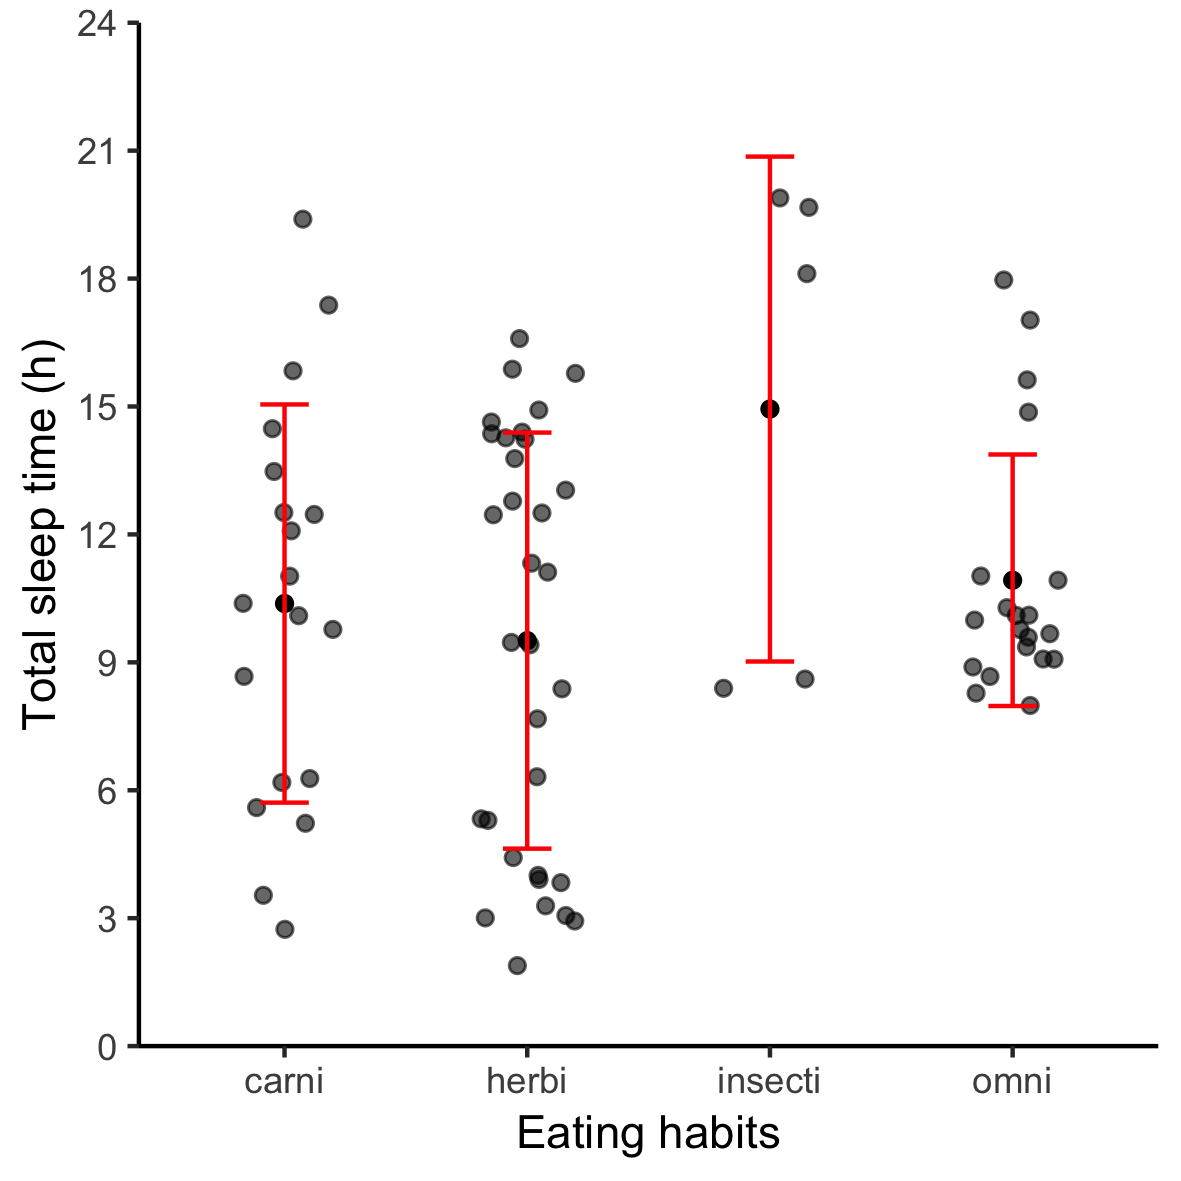
d +
  geom_point(...) +
  stat_summary(fun = mean,
               geom = "point",
               fill = "red") +
  stat_summary(fun.data = mean_sdl,
               fun.args = list(mult = 1),
               geom = "errorbar",
               width = 0.2,
               color = "red")
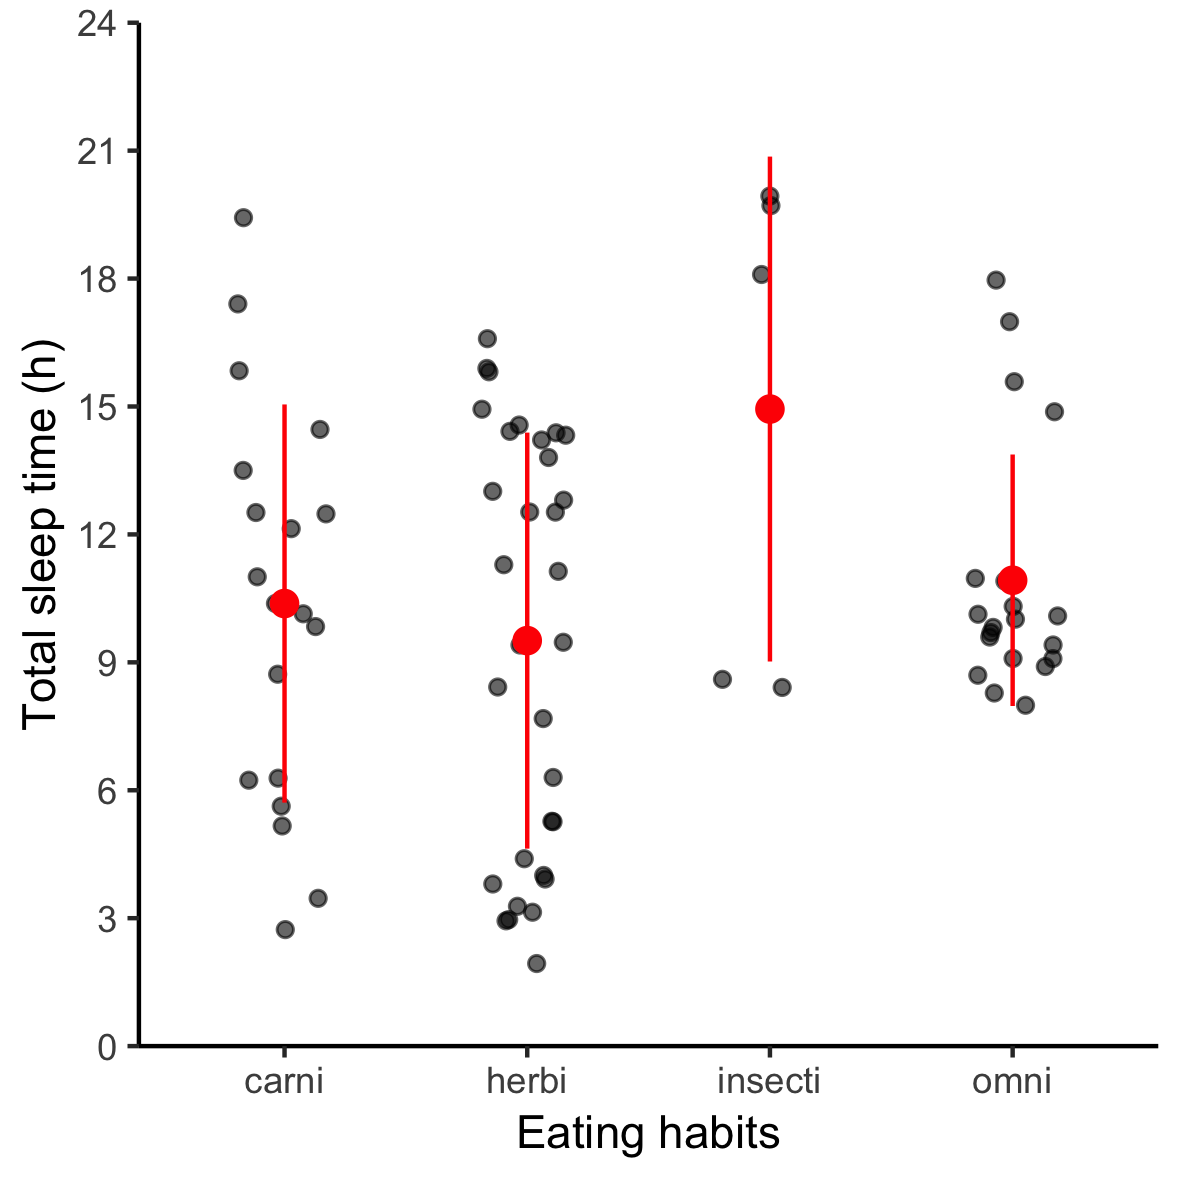
d +
  geom_point(...) +
  stat_summary(fun.data = mean_sdl,
               mult = 1,
               width = 0.2,
               color = "red")
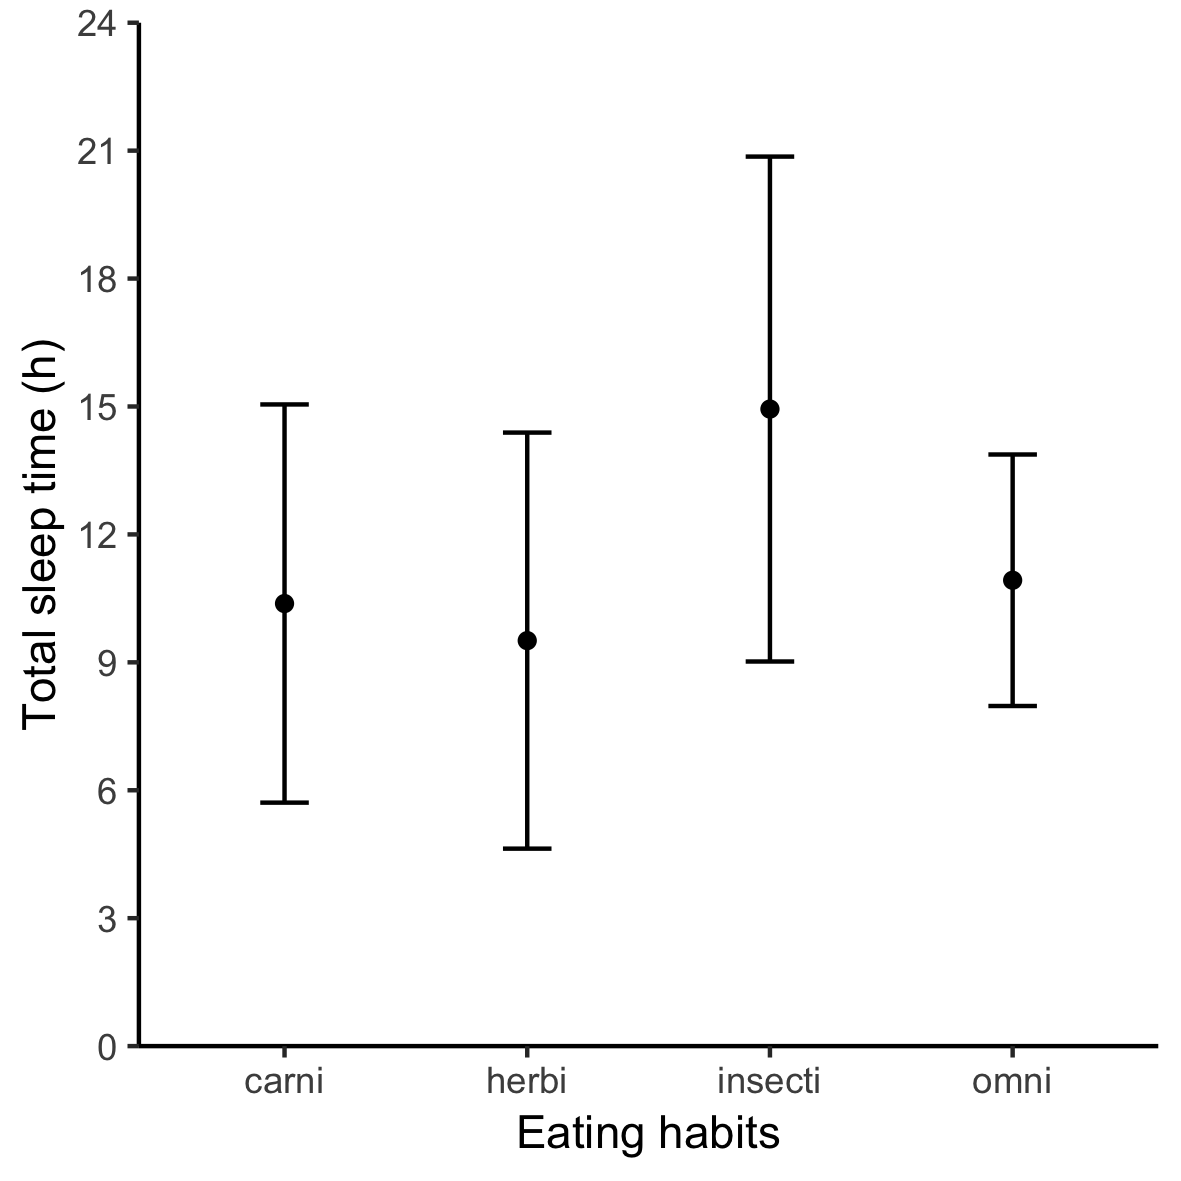
d +
  stat_summary(fun = mean,
               geom = "point") +
  stat_summary(fun.data = mean_sdl,
               fun.args = list(mult = 1),
               geom = "errorbar",
               width = 0.2)