使用 R 的 Shiny 建立網頁應用程式
Ramnath Vaidyanathan
VP of Product Research
ui <- fluidPage(

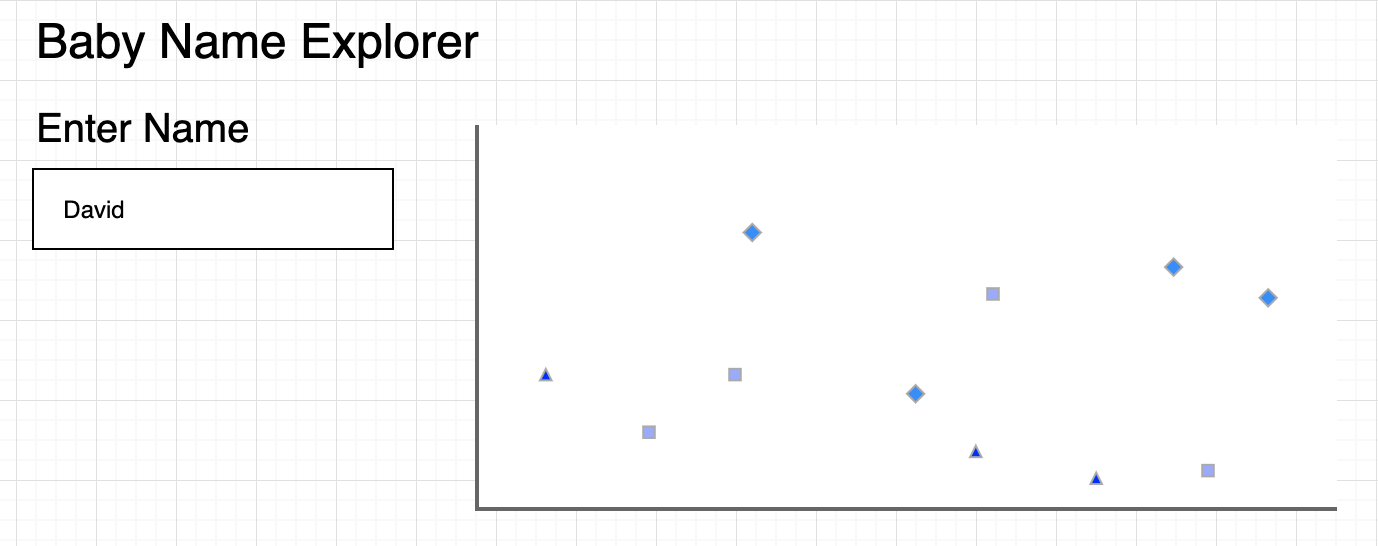
  titlePanel("Baby Name Explorer"),

  textInput('name', 'Enter Name', 'David')

)
ui <- fluidPage(
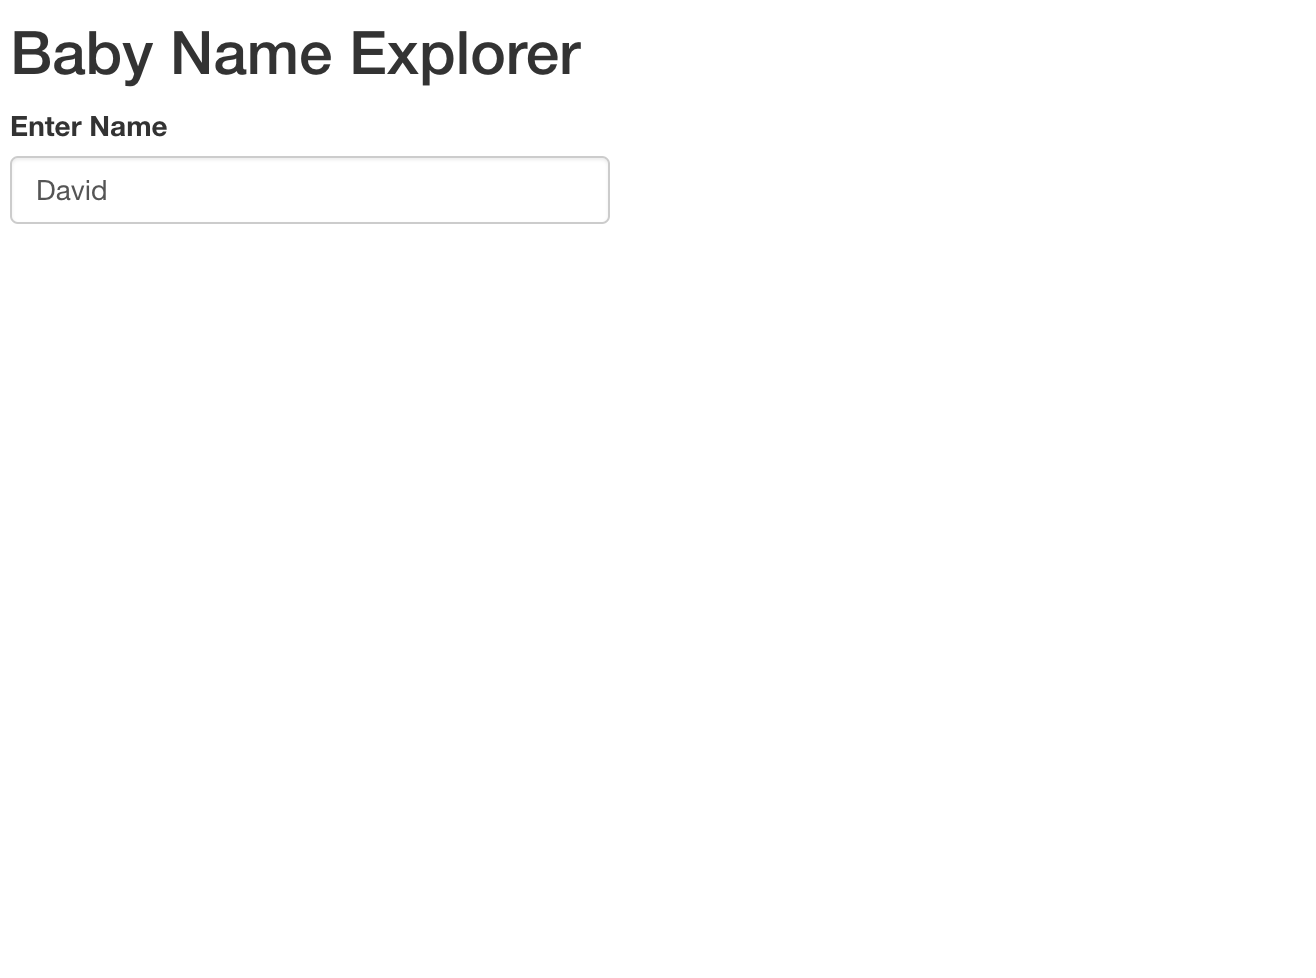
titlePanel("Baby Name Explorer"),
textInput('name', 'Enter Name', 'David')
)
server <- function(input, output, session){

}
shinyApp(ui = ui, server = server)
ui <- fluidPage(
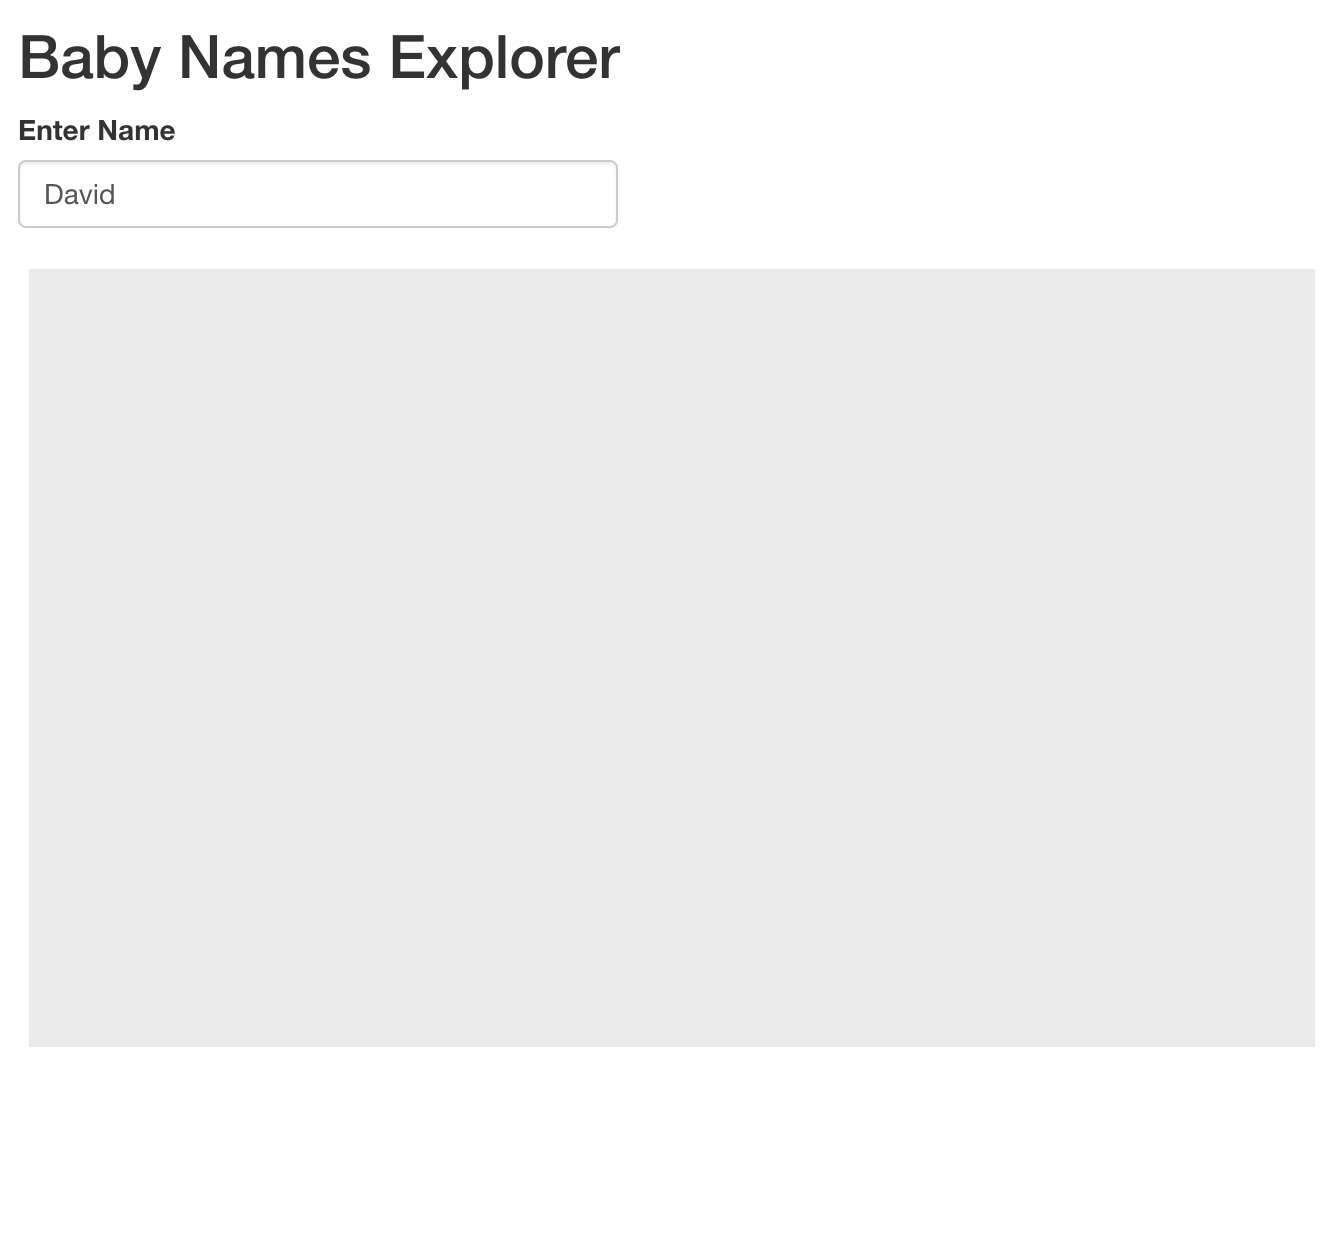
  titlePanel("Baby Name Explorer"),
  textInput('name', 'Enter Name', 'David'),

  plotOutput('trend')

)
ui <- fluidPage( titlePanel("Baby Name Explorer"), textInput('name', 'Enter Name', 'David'),
plotOutput('trend')
server <- function(input, output, session){

  output$trend <- renderPlot({
    ggplot()
  })

}
server <- function(input, output, session){
output$trend <- renderPlot({ ggplot() })
}
ui <- fluidPage(
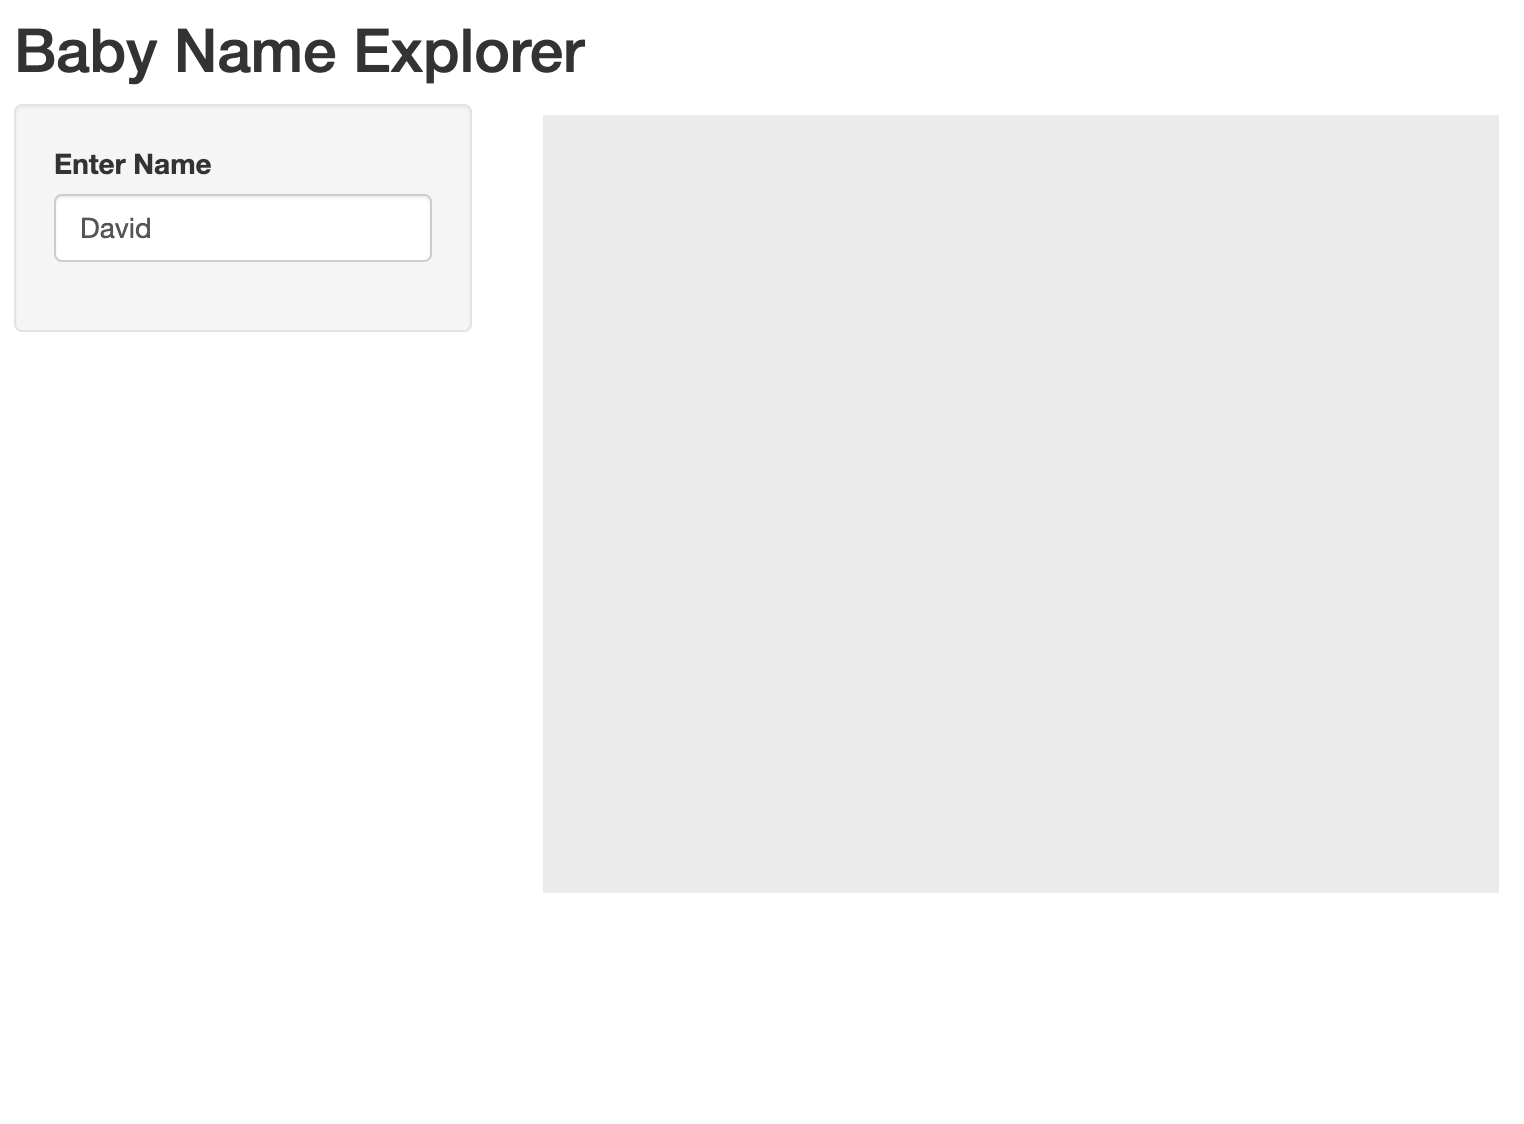
  titlePanel("Baby Name Explorer"),

  sidebarLayout(

    sidebarPanel(

      textInput('name', 'Enter Name', 'David')

    ),

    mainPanel(

      plotOutput('trend')

    )

  )

)
ui <- fluidPage( titlePanel("Baby Name Explorer"),
sidebarLayout(
sidebarPanel(
),
mainPanel(
server <- function(input, output, session){
  output$trend <- renderPlot({ggplot()})
}
ui <- fluidPage(
  ...
)
server <- function(input, output, session){
  output$trend <- renderPlot({

    data_name <- subset(
      babynames, name == input$name
    )

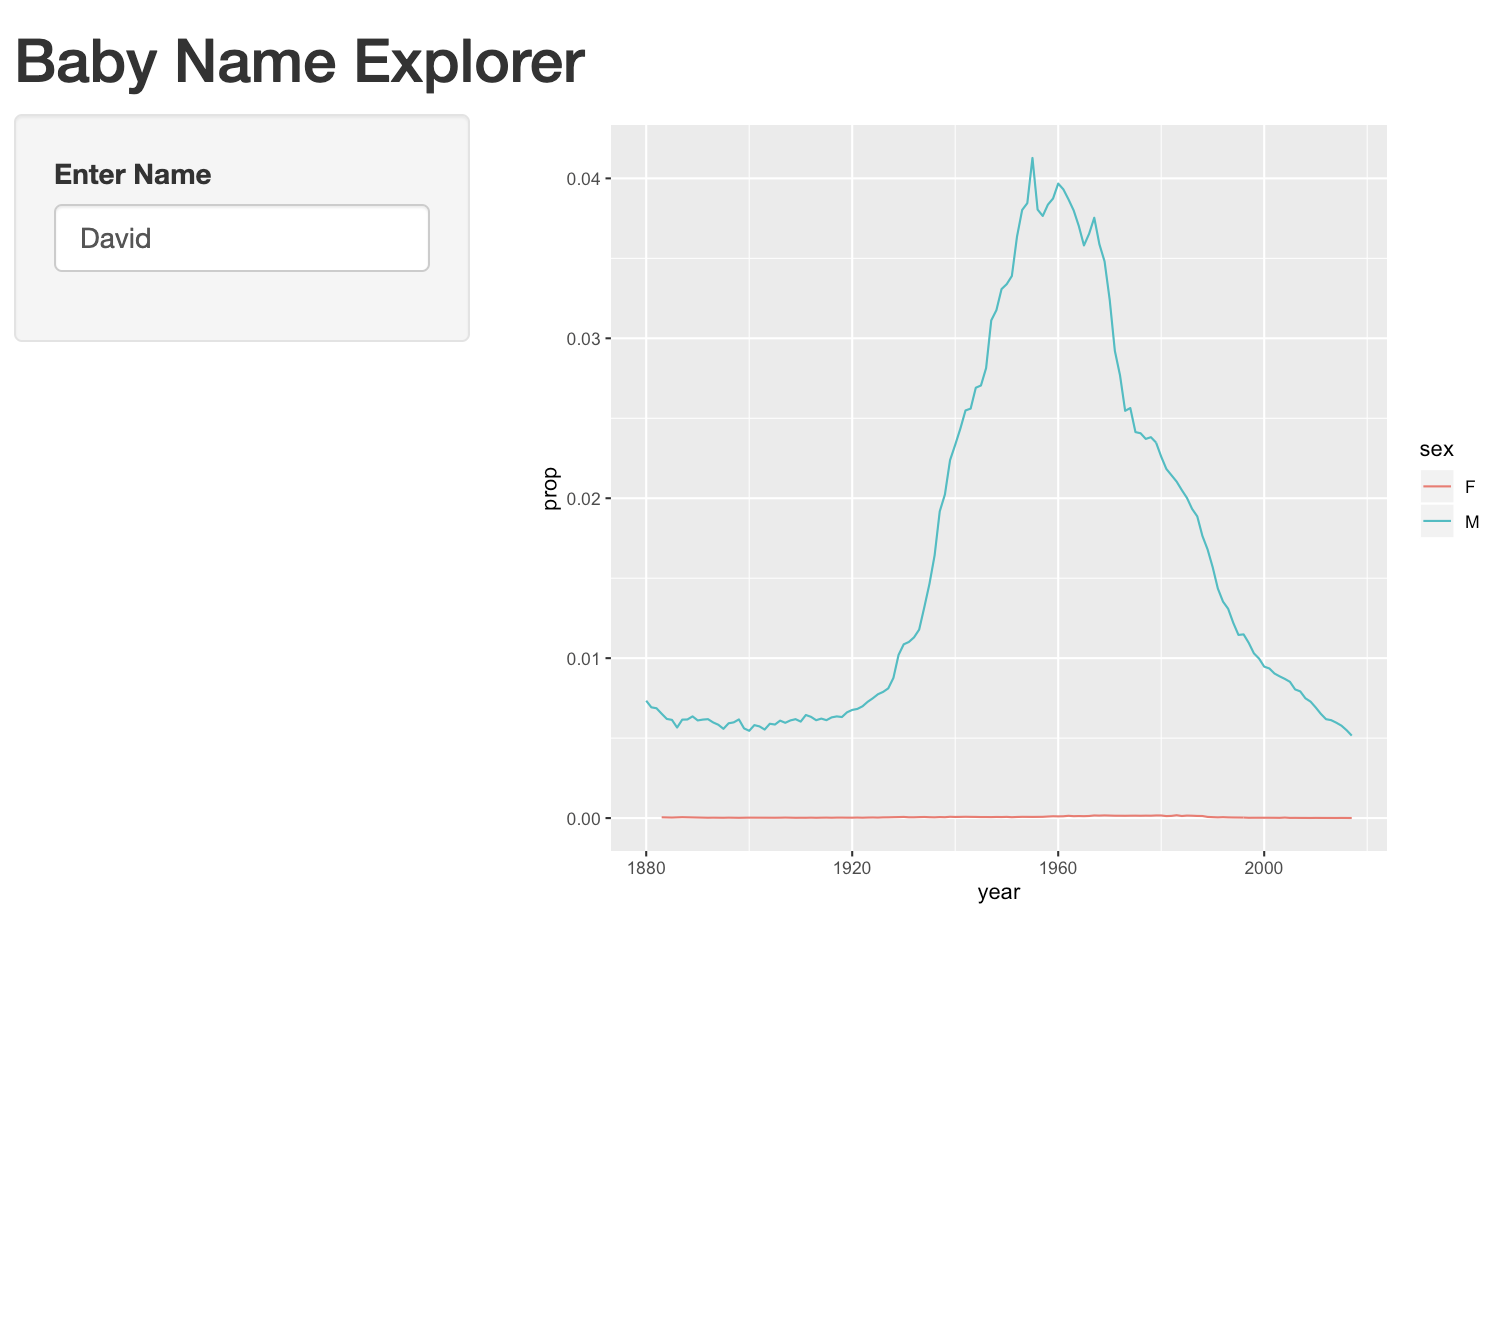
    ggplot(data_name) +
      geom_line(
        aes(x = year, y = prop, color = sex)
      )

  })
}
server <- function(input, output, session){ output$trend <- renderPlot({
data_name <- subset( babynames, name == input$name )
ggplot(data_name) + geom_line( aes(x = year, y = prop, color = sex) )
}) }