版面與主題

使用 R 的 Shiny 建立網頁應用程式

Kaelen Medeiros

Data Scientist

預設 Shiny 應用版面

ui <- fluidPage(
  titlePanel("Histogram"),
  sliderInput('nb_bins', '# Bins', 5, 10, 5),
  plotOutput('hist')
)
server <- function(input, output, session){
  output$hist <- renderPlot({
    hist(faithful$waiting, 
         breaks = input$nb_bins, 
         col = 'steelblue')
  })
}
shinyApp(ui = ui, server = server)

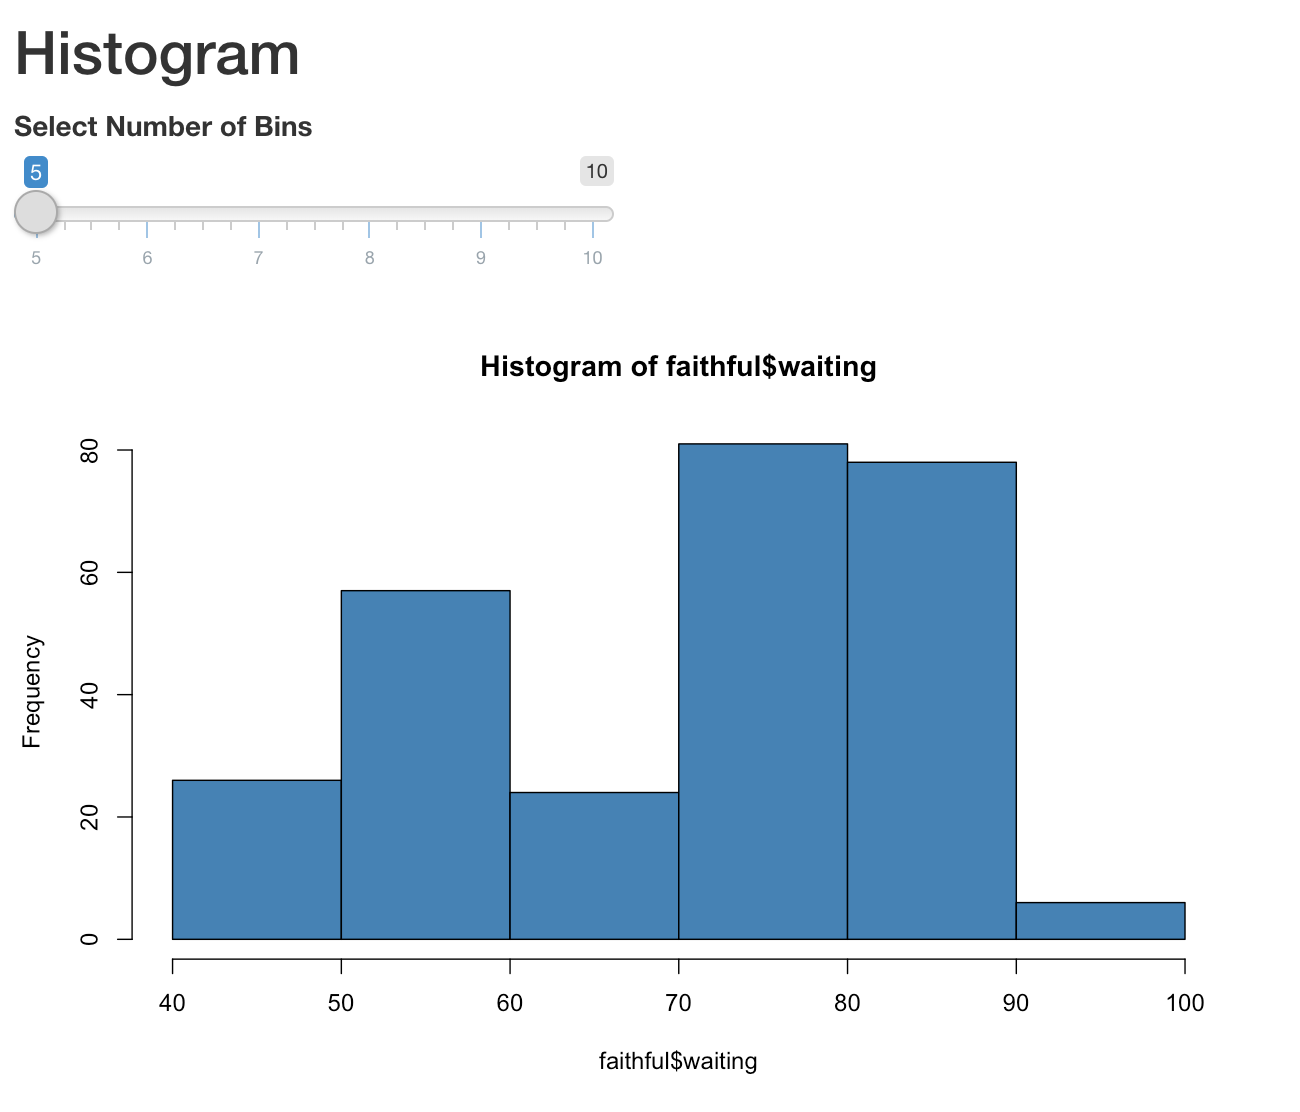
一個應用程式:顯示等候時間的直方圖,並有滑桿可調整分箱數

使用 R 的 Shiny 建立網頁應用程式

側邊欄版面

ui <- fluidPage(
  titlePanel("Histogram"),
  sidebarLayout(
    sidebarPanel(sliderInput('nb_bins', 
                             '# Bins', 5, 10, 5)),
    mainPanel(plotOutput('hist'))
  )
)
server <- function(input, output, session){
  output$hist <- renderPlot({
    hist(faithful$waiting, breaks = input$nb_bins, 
         col = 'steelblue')
  })
}
shinyApp(ui = ui, server = server)
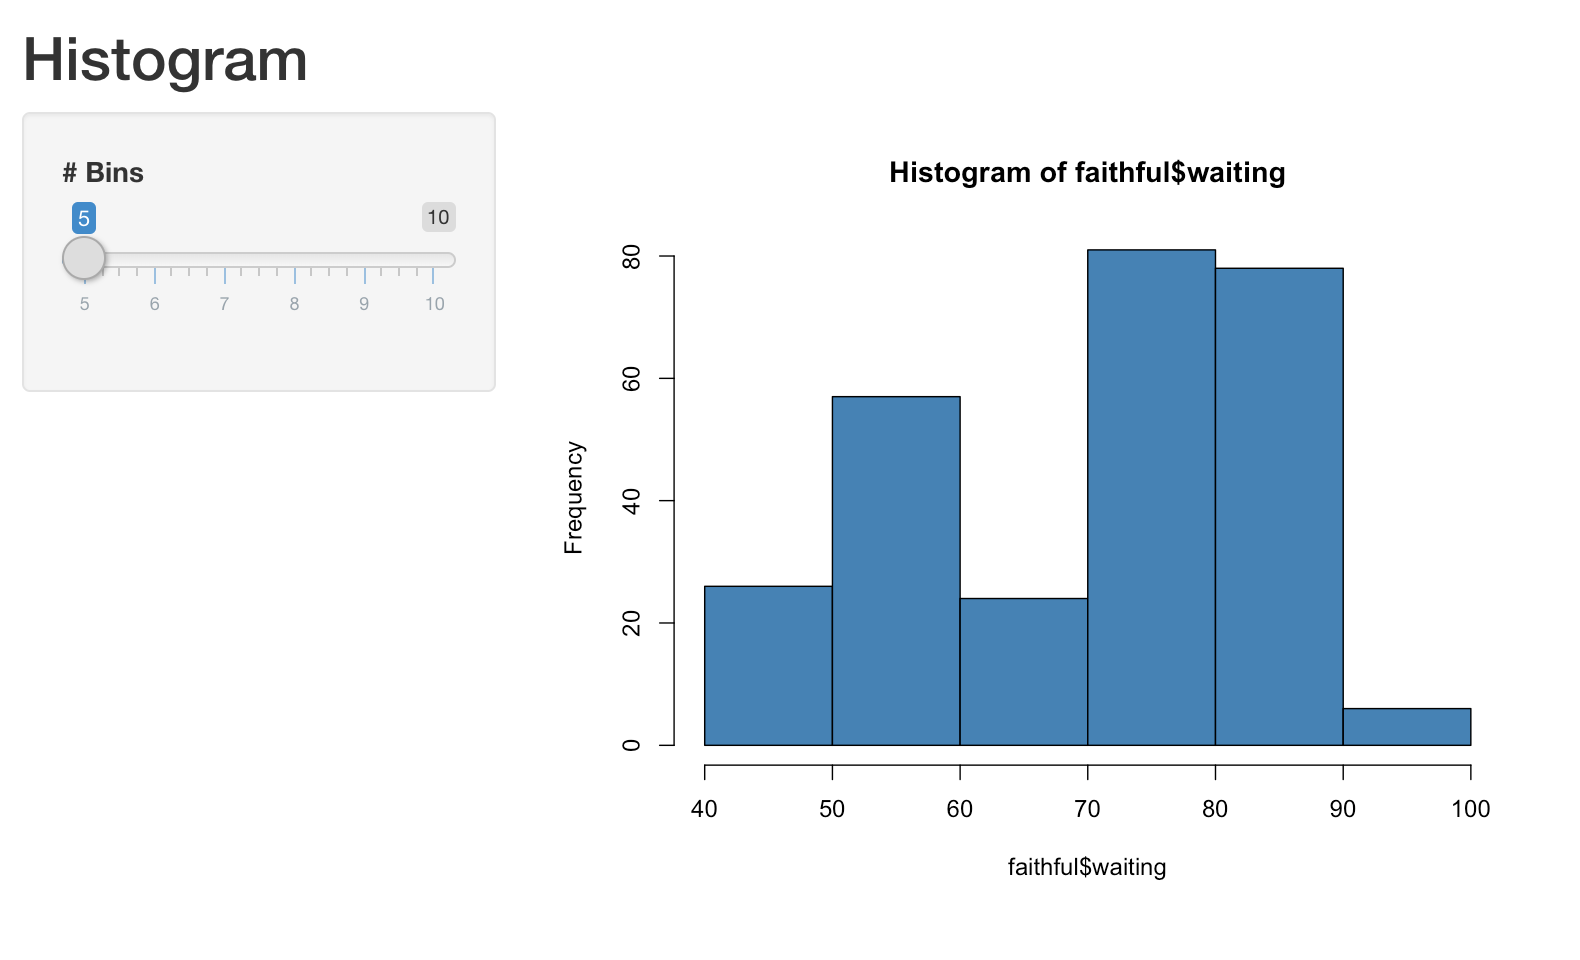
一個應用程式:左側有滑桿可調整分箱數,右側顯示等候時間的直方圖

使用 R 的 Shiny 建立網頁應用程式

分頁版面

一個應用程式:左側有滑桿可調整分箱數,右側顯示等候時間的直方圖

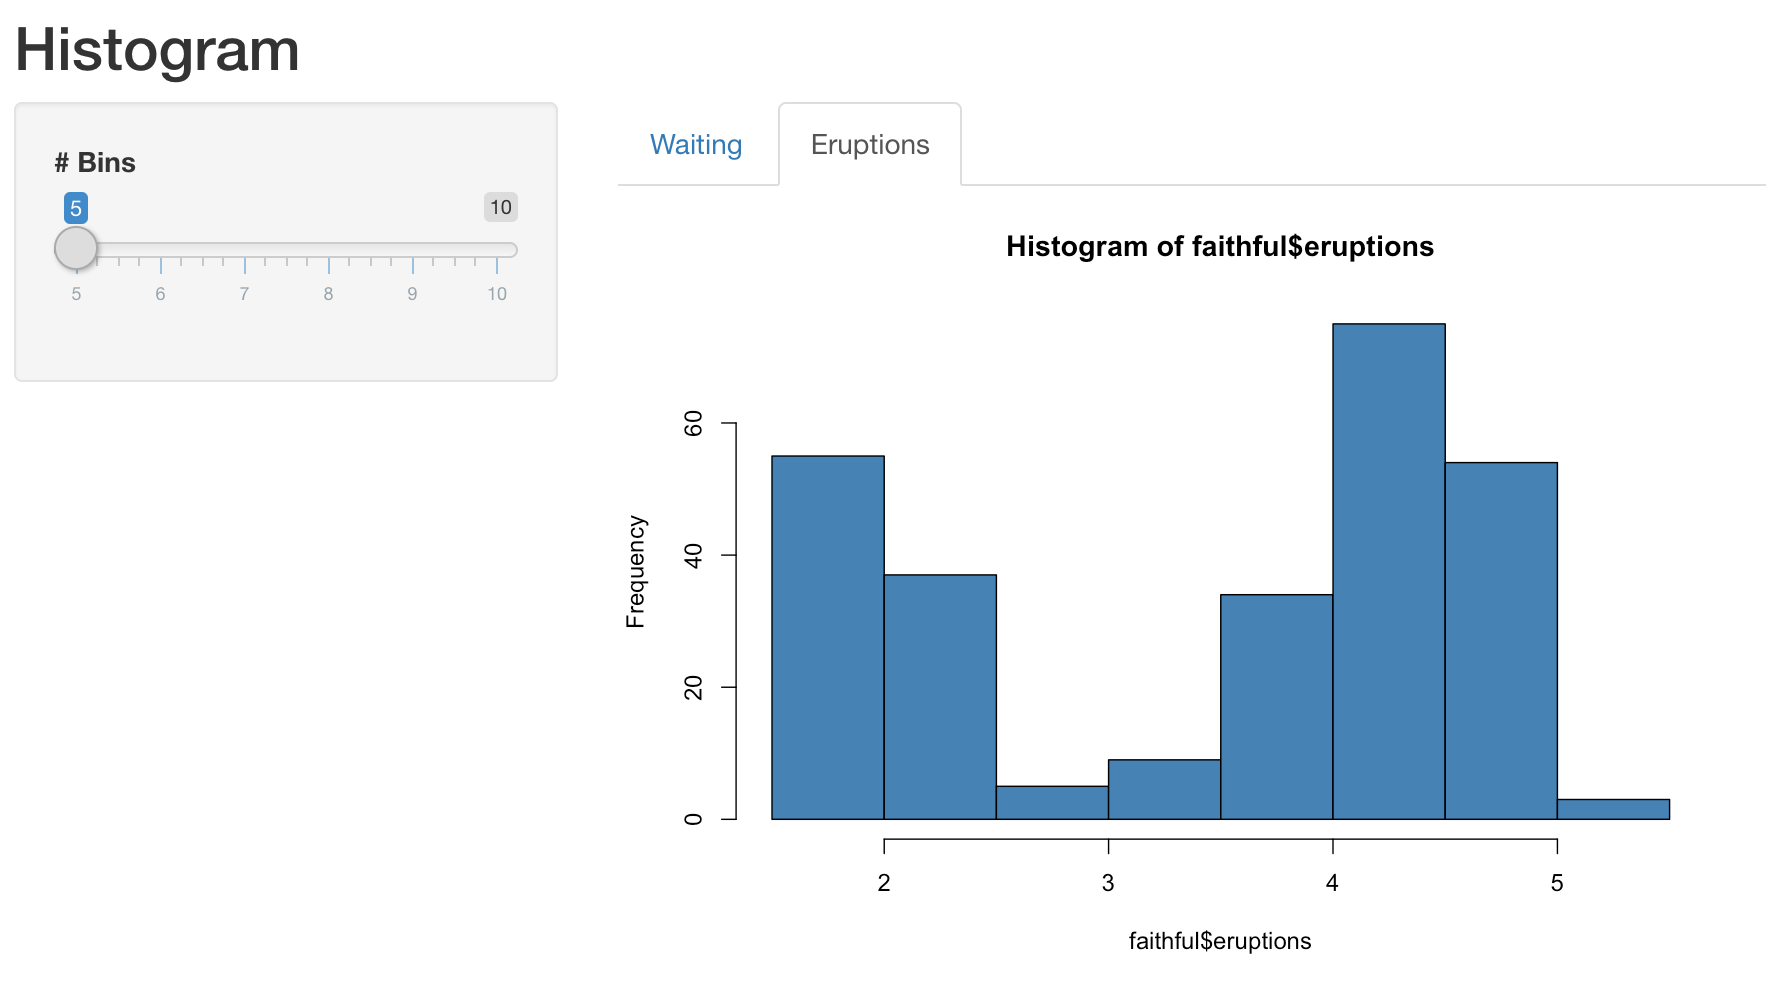
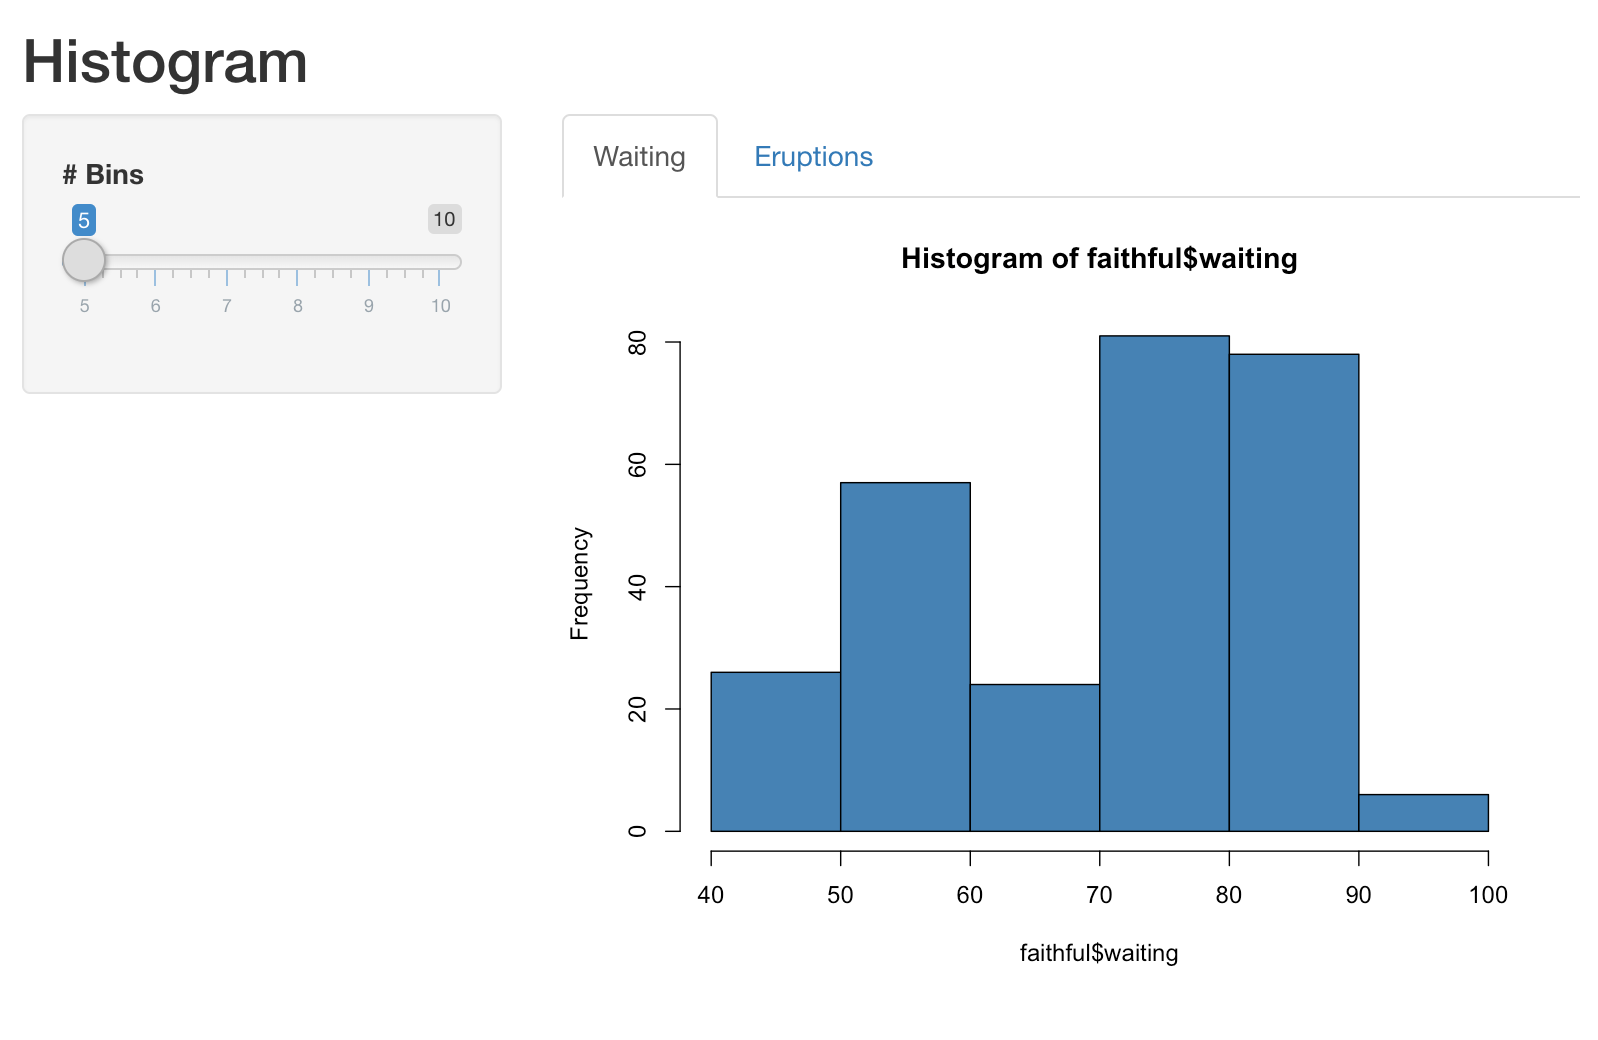
一個應用程式:左側有滑桿可調整分箱數,右側顯示等候時間的直方圖,包含兩個分頁標籤

使用 R 的 Shiny 建立網頁應用程式

分頁版面

ui <- fluidPage(
  titlePanel("Histogram"),
  sidebarLayout(
    sidebarPanel(sliderInput('nb_bins', '# Bins', 
                             5, 10, 5)),
    mainPanel(

tabsetPanel( tabPanel('Waiting', plotOutput('hist_waiting')), tabPanel('Eruptions', plotOutput('hist_eruptions')) )
) ) )
server <- function(input, output, session){
  output$hist_waiting <- renderPlot({
    hist(faithful$waiting, 
         breaks = input$nb_bins, 
         col = 'steelblue')
  })
  output$hist_eruptions <- renderPlot({
    hist(faithful$eruptions, 
         breaks = input$nb_bins, 
         col = 'steelblue')
  })
}
shinyApp(ui = ui, server = server)
使用 R 的 Shiny 建立網頁應用程式

主題選擇器

ui <- fluidPage(
  titlePanel("Histogram"),

shinythemes::themeSelector(),
sidebarLayout( sidebarPanel(sliderInput('nb_bins', '# Bins', 5, 10, 5)), mainPanel(plotOutput('hist')) ) ) server <- function(input, output, session){ output$hist <- renderPlot({ hist(faithful$waiting, breaks = input$nb_bins, col = 'steelblue') }) } shinyApp(ui = ui, server = server)
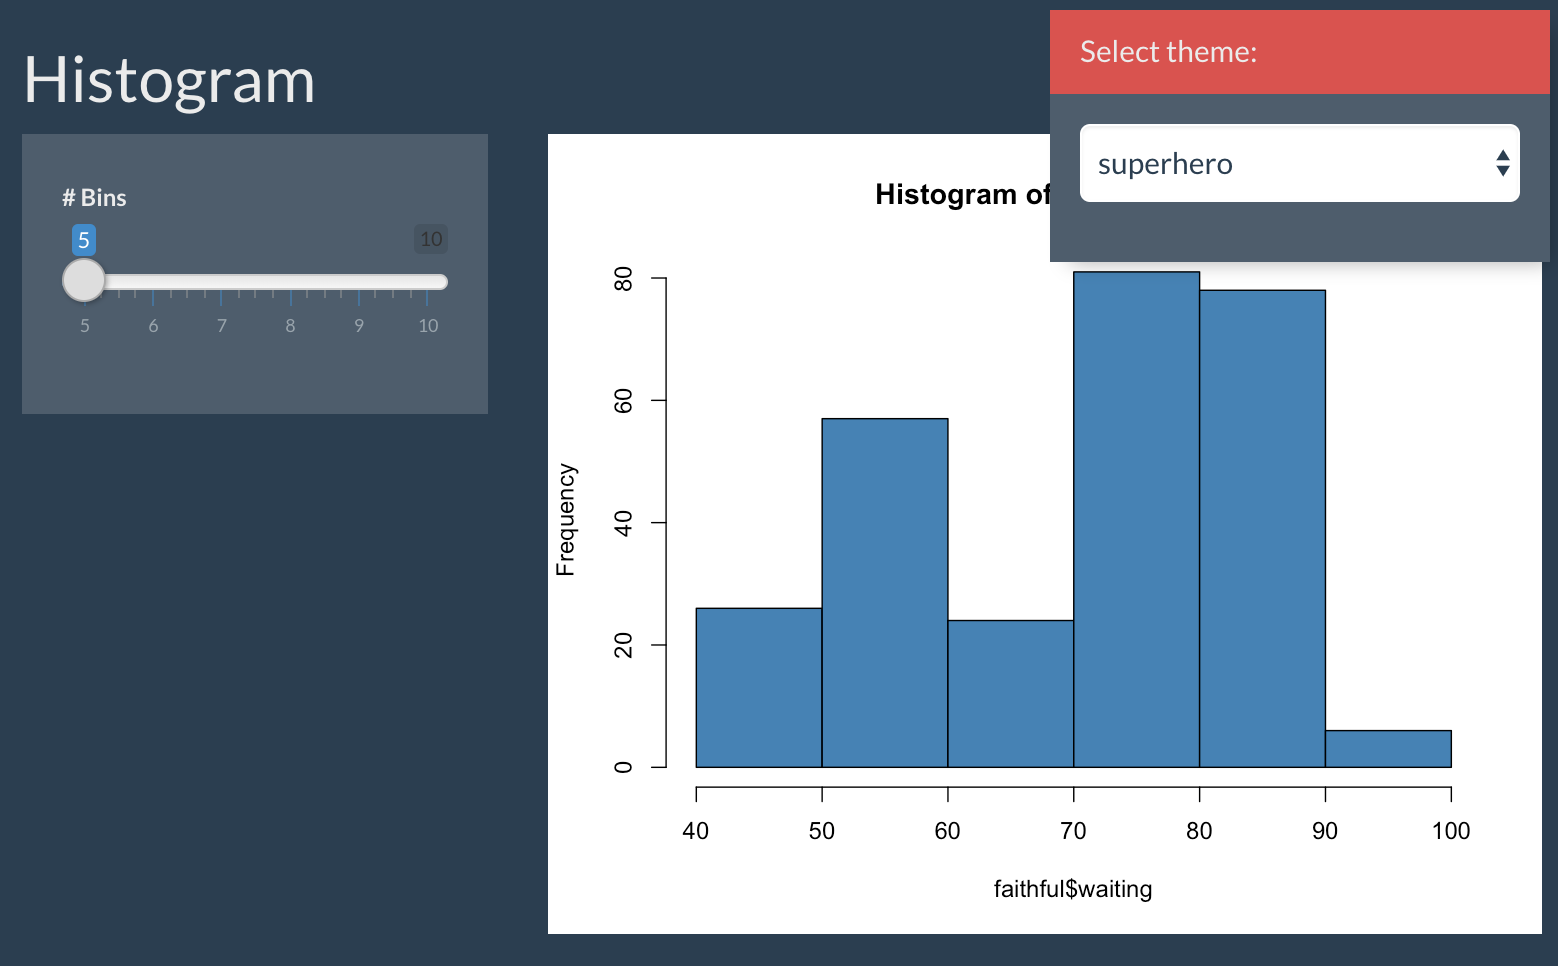
一個應用程式:右側顯示等候時間的直方圖,含可調分箱數的滑桿,並有浮動的主題選擇器

使用 R 的 Shiny 建立網頁應用程式

加入主題

ui <- fluidPage(
  titlePanel("Histogram"),

theme = shinythemes::shinytheme('superhero'),
sidebarLayout( sidebarPanel(sliderInput('nb_bins', '# Bins', 5, 10, 5)), mainPanel(plotOutput('hist')) ) ) server <- function(input, output, session){ output$hist <- renderPlot({ hist(faithful$waiting, breaks = input$nb_bins, col = 'steelblue') }) } shinyApp(ui = ui, server = server)
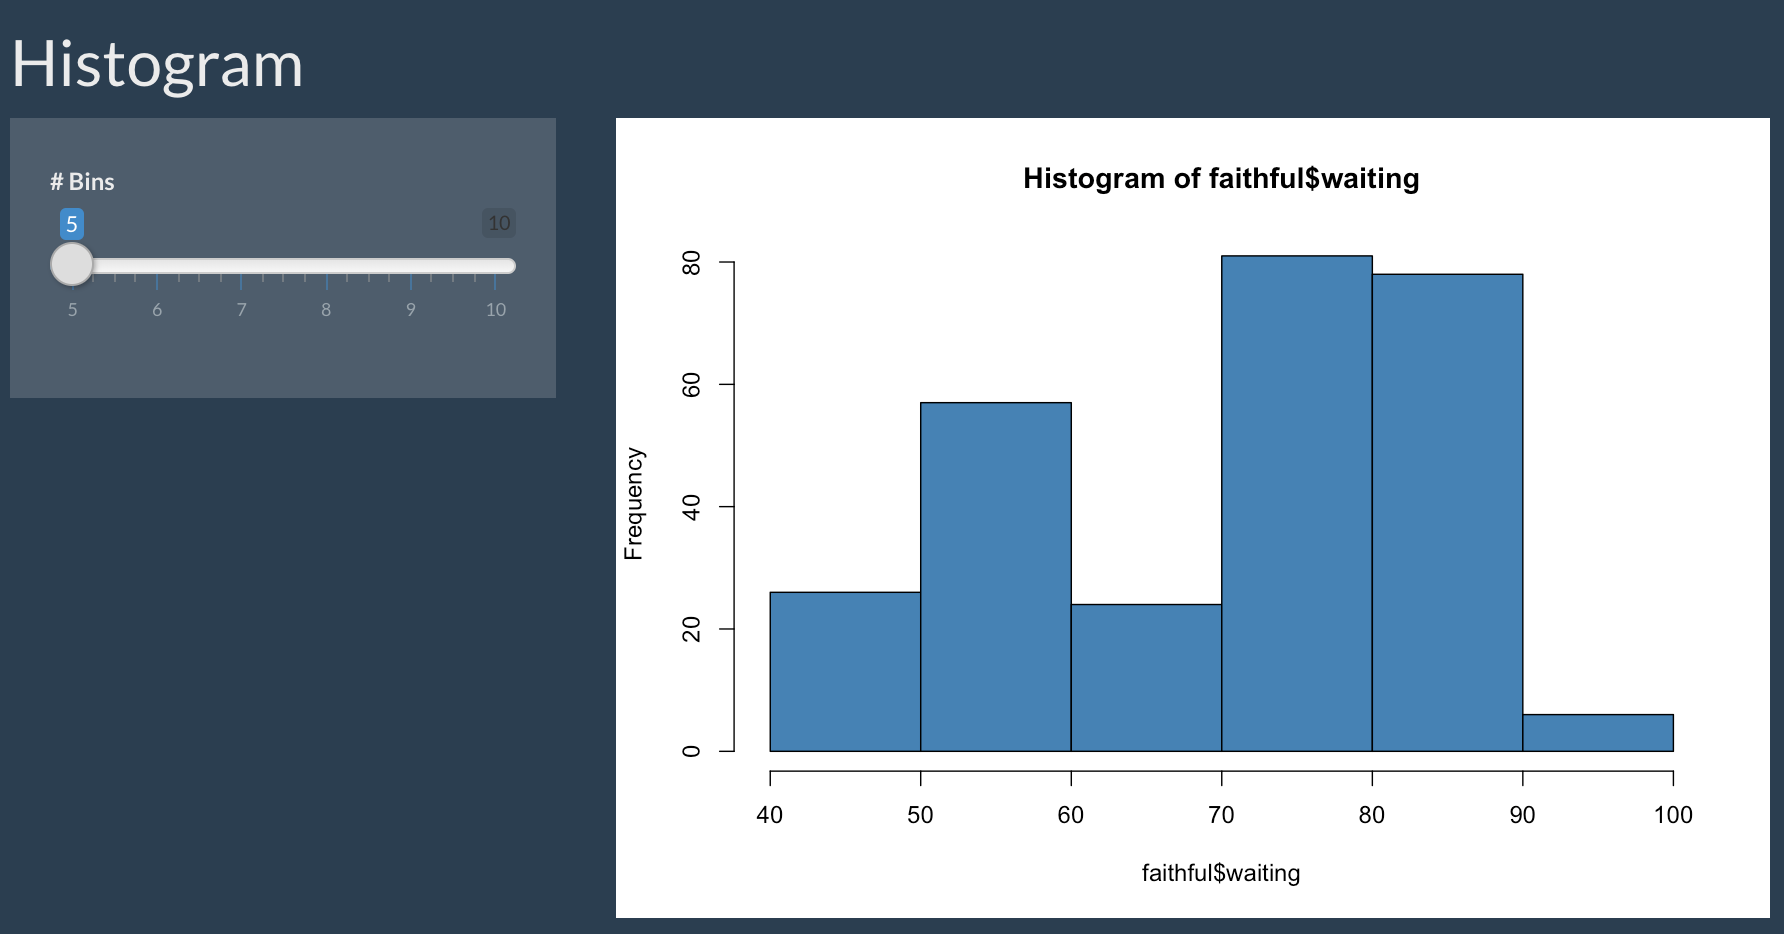
一個應用程式:左側有滑桿可調整分箱數,右側顯示等候時間的直方圖

使用 R 的 Shiny 建立網頁應用程式

一起來練習吧!

使用 R 的 Shiny 建立網頁應用程式

Preparing Video For Download...