建立應用程式

使用 R 的 Shiny 建立網頁應用程式

Kaelen Medeiros

Data Scientist

探索預期壽命 vs. 人均 GDP

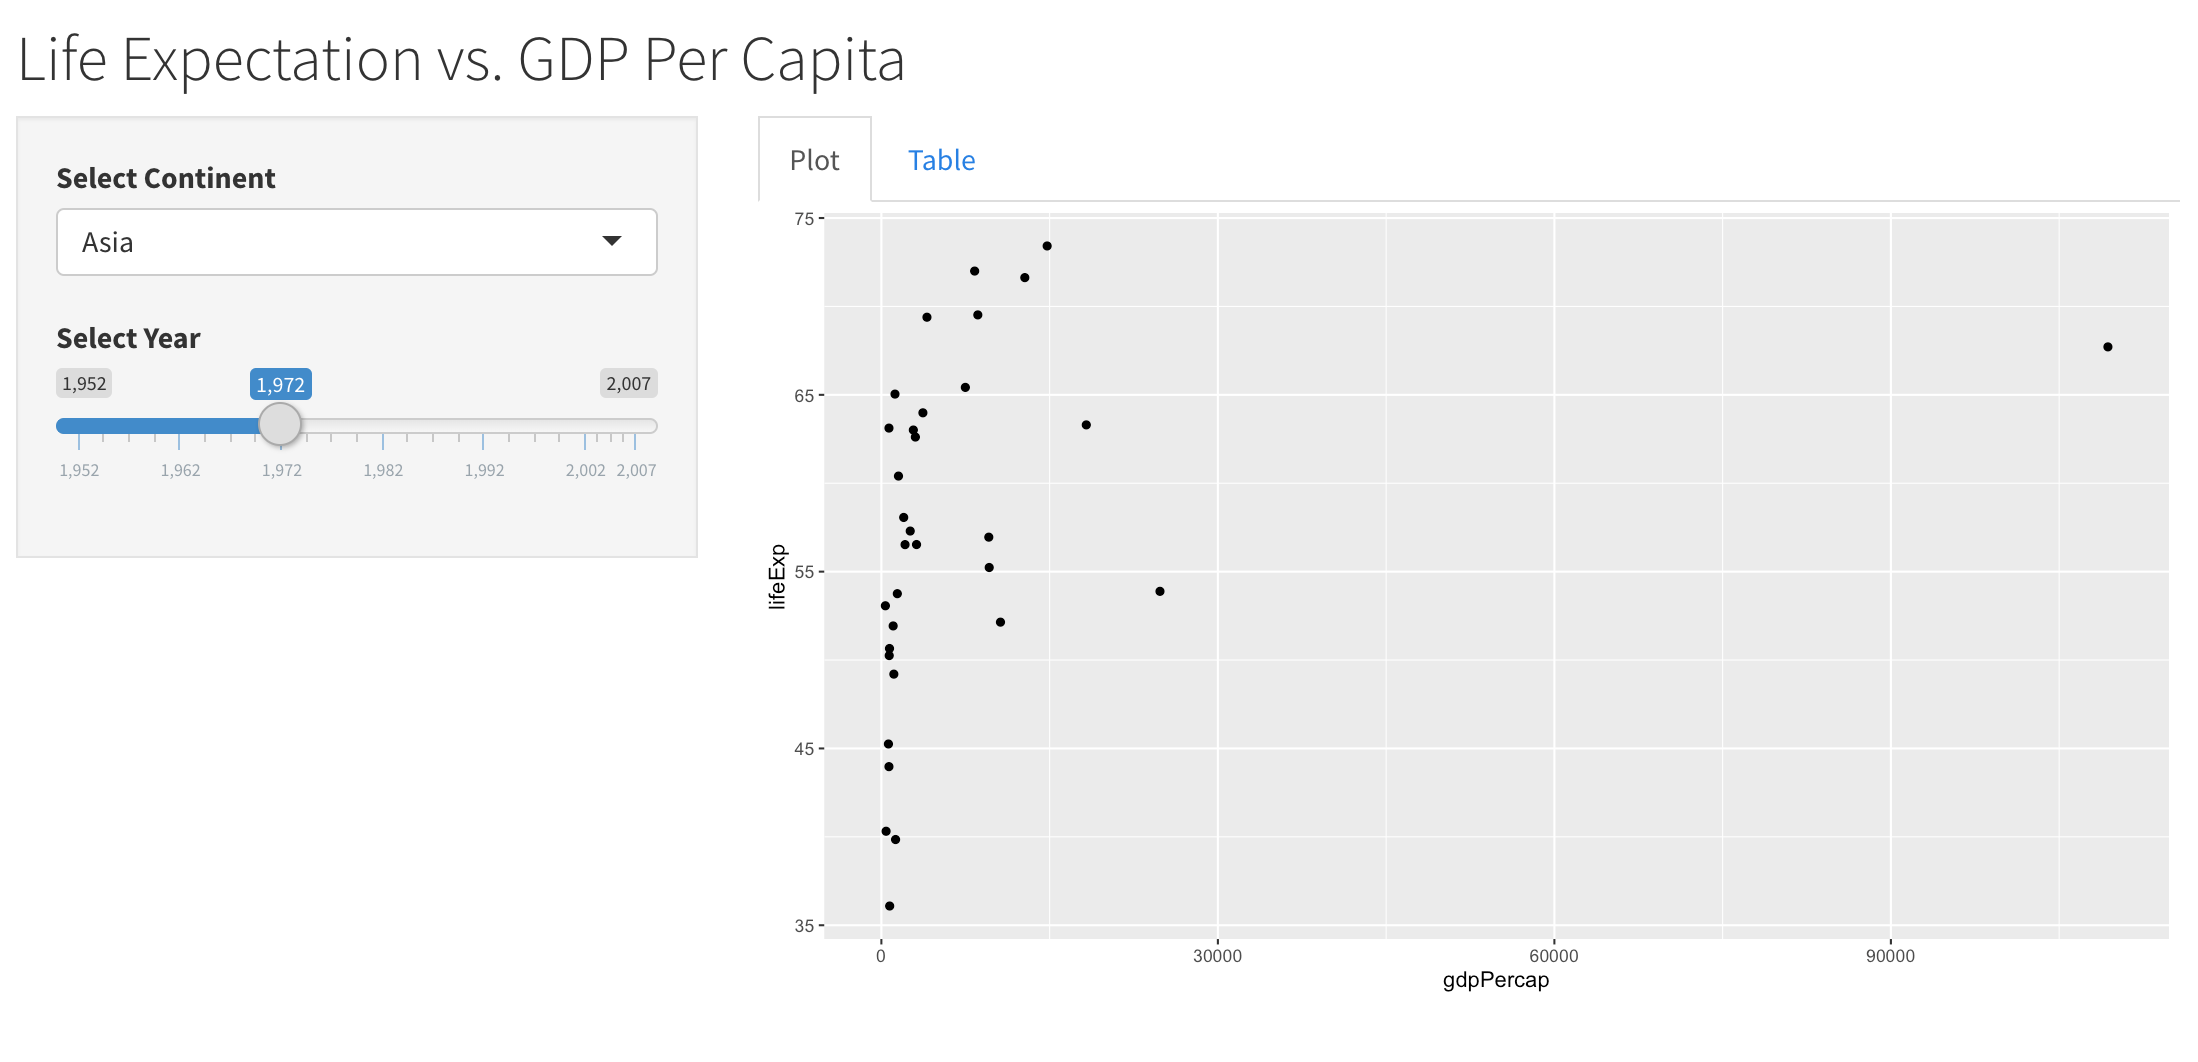
一個應用程式,顯示可互動的散佈圖:各洲與年份的預期壽命對人均 GDP

使用 R 的 Shiny 建立網頁應用程式

探索預期壽命 vs. 人均 GDP

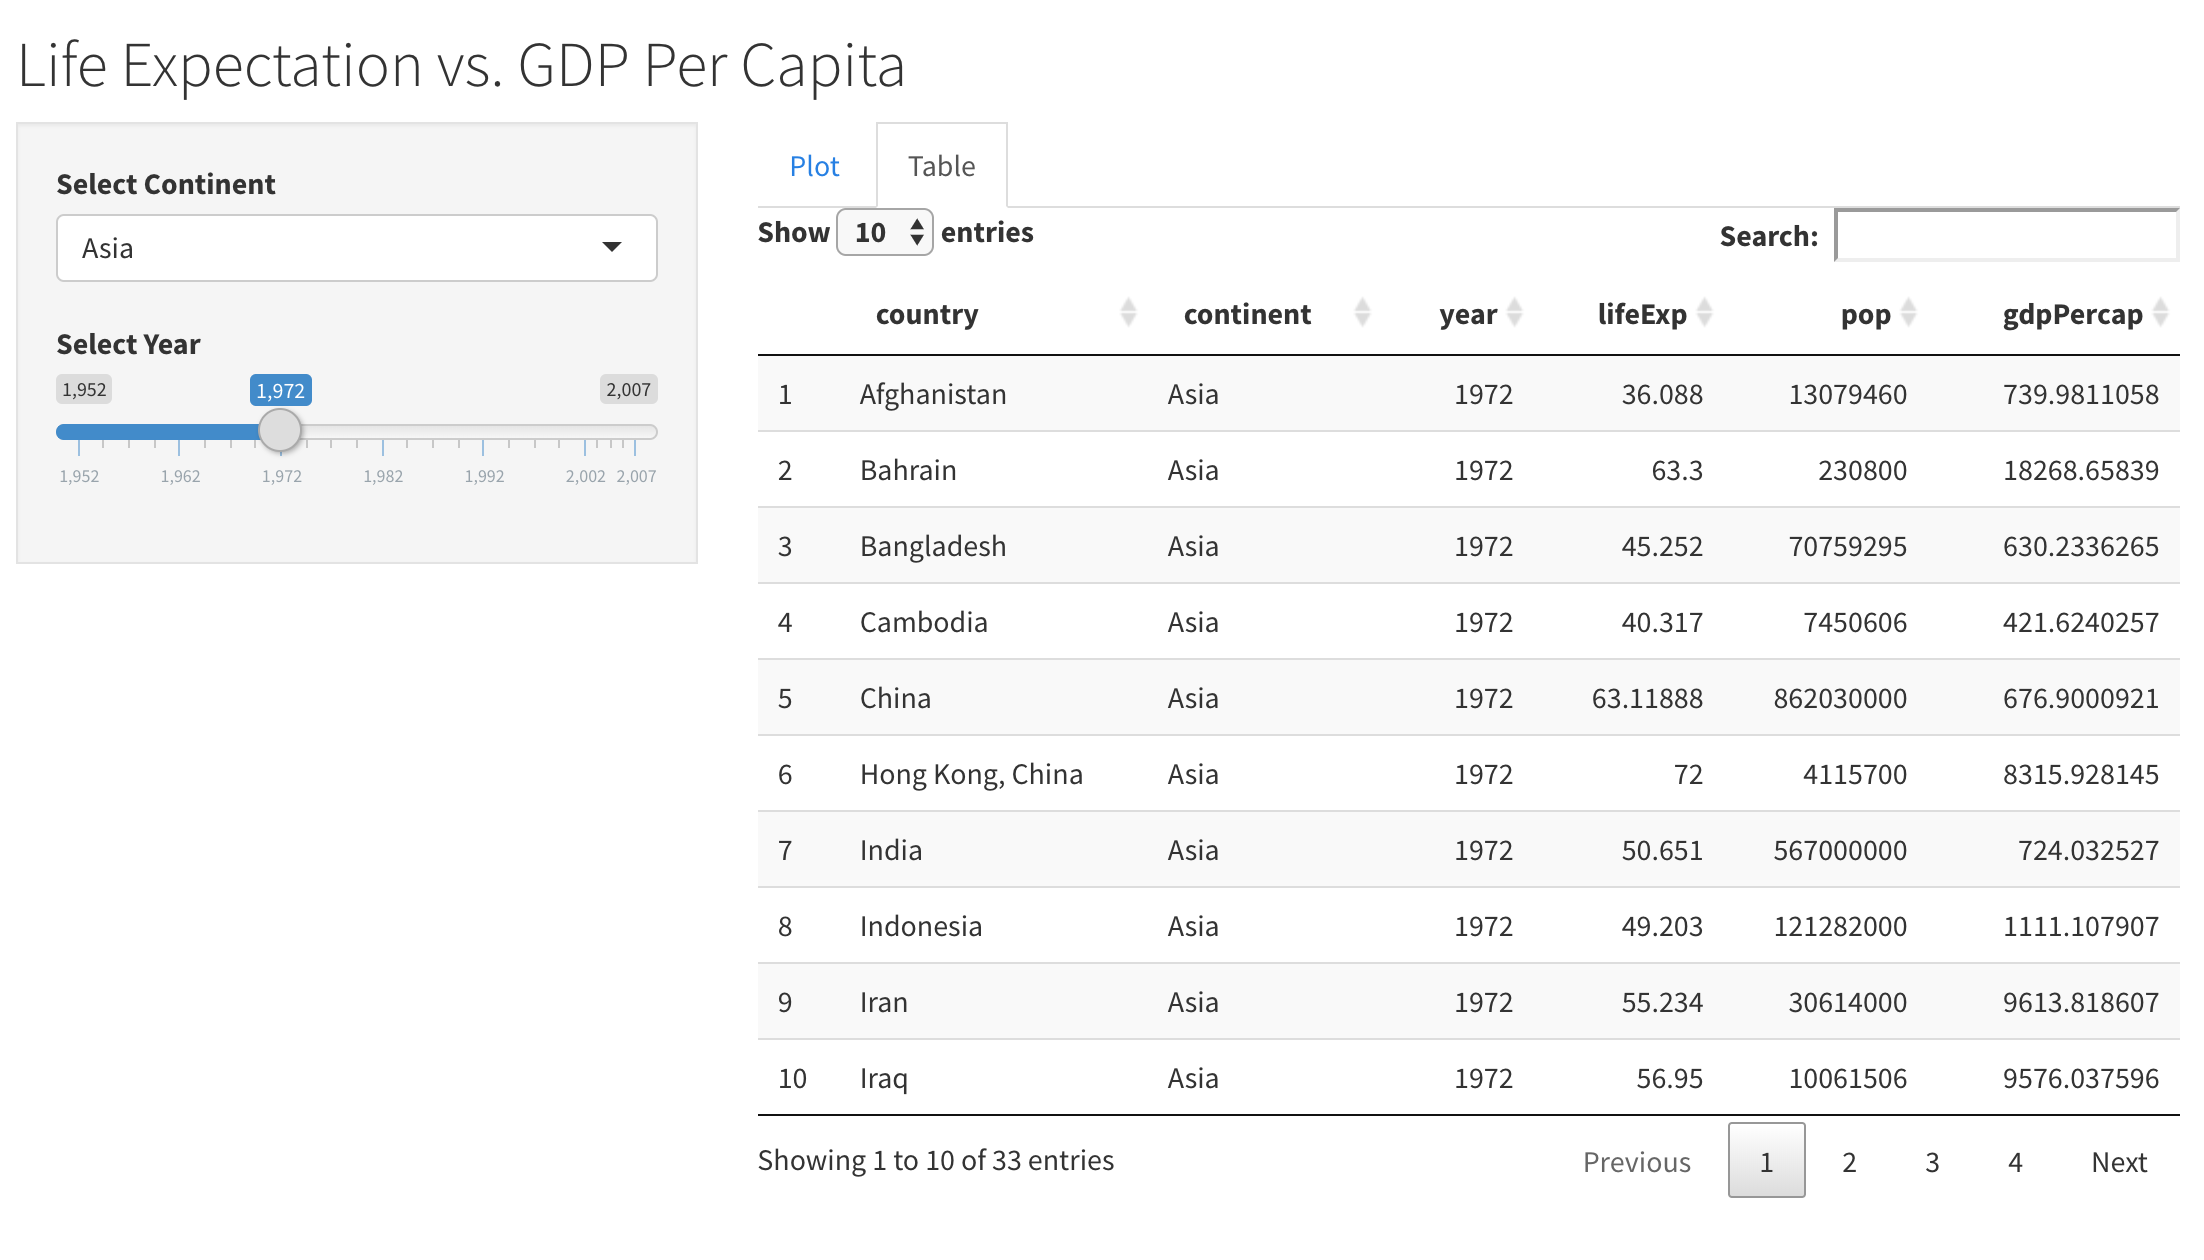
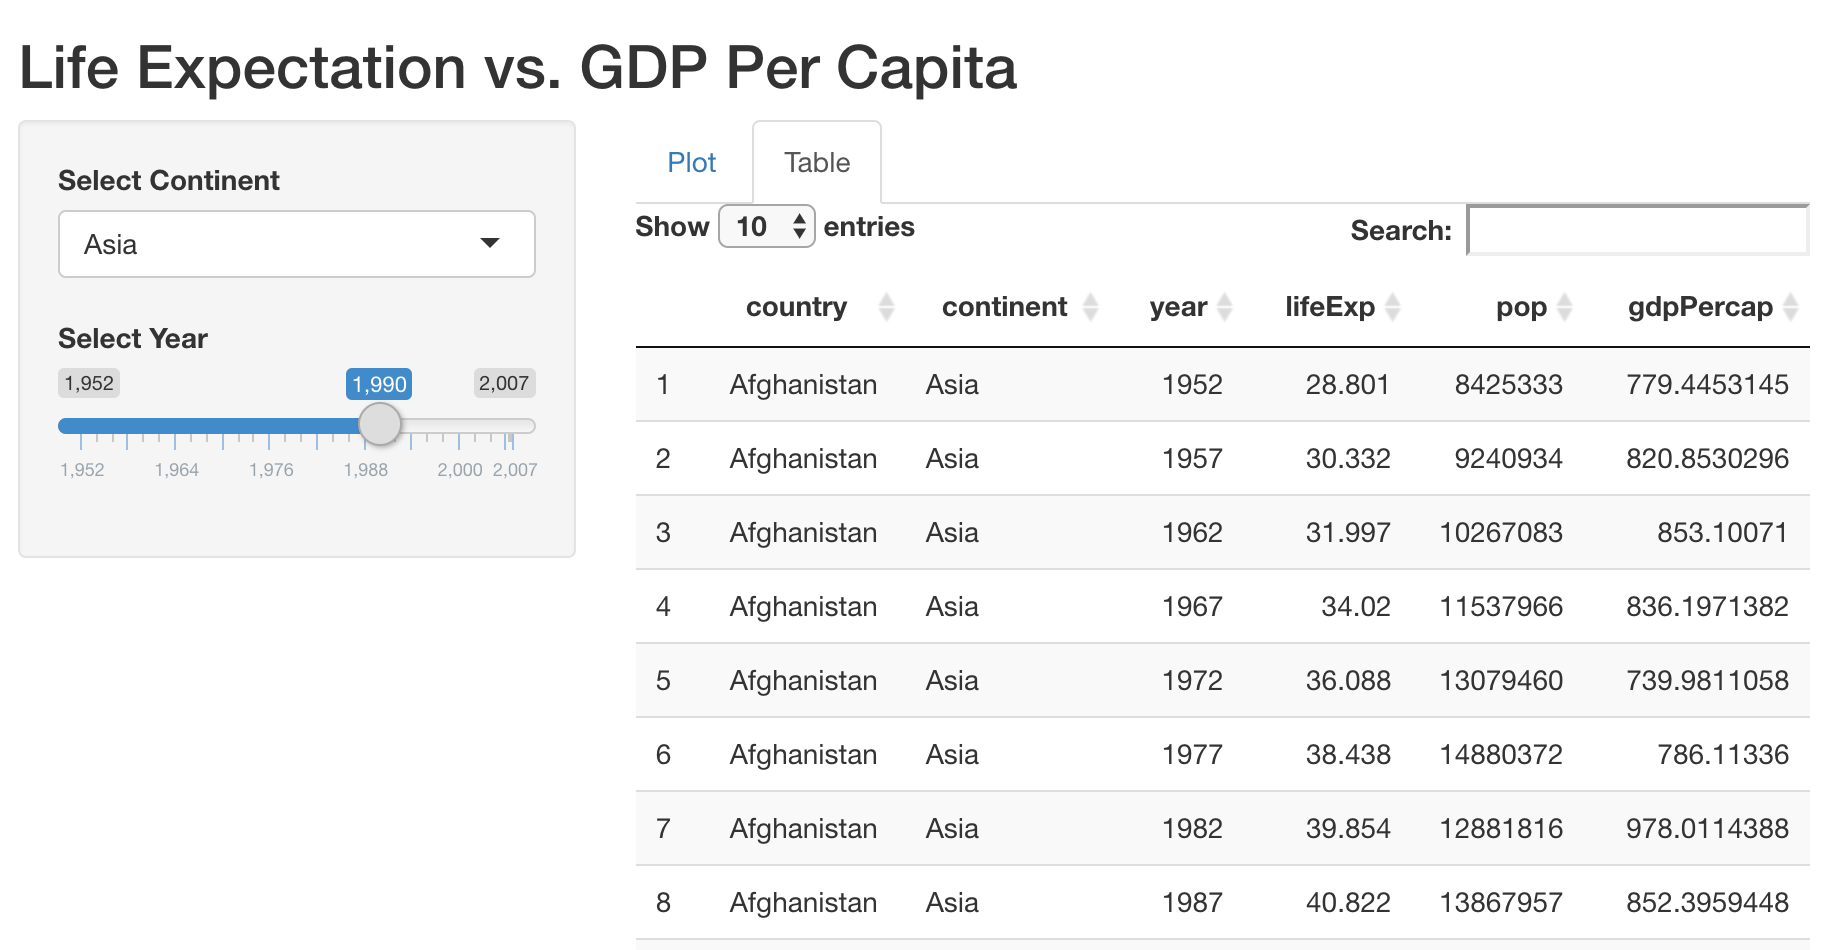
一個應用程式,顯示各洲與年份的預期壽命、人口與人均 GDP 的互動式表格

使用 R 的 Shiny 建立網頁應用程式

建立 Shiny 應用程式:4 步驟

  1. 新增輸入(UI)
  2. 新增輸出(UI/Server)
  3. 更新版面(UI)
  4. 更新輸出(Server)
使用 R 的 Shiny 建立網頁應用程式

步驟 1:新增輸入(UI)

ui <- fluidPage(
  titlePanel("Life Expectation vs. GDP Per Capita"),

selectInput('continent', 'Select Continent', unique(gapminder$continent)),
sliderInput('year', 'Select Year', 1952, 2007, 1990, step = 5) )
server <- function(input, output, session){ } shinyApp(ui = ui, server = server)
使用 R 的 Shiny 建立網頁應用程式

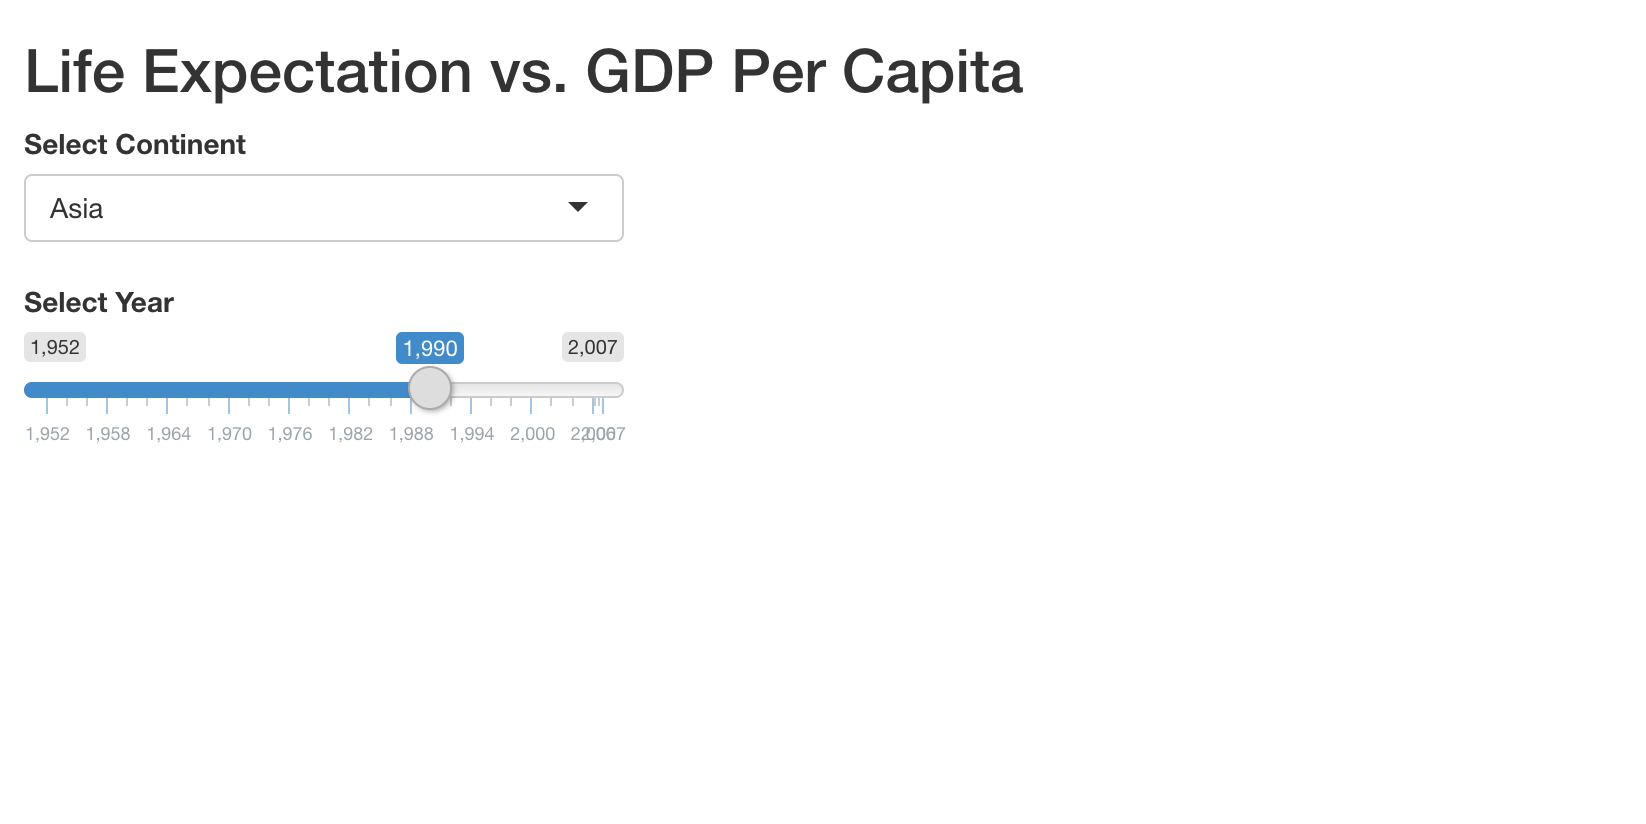
一個應用程式,顯示選擇洲別與年份的控制項

使用 R 的 Shiny 建立網頁應用程式

步驟 2:新增輸出(UI)

ui <- fluidPage(
  titlePanel("Life Expectation vs. GDP Per Capita"),
  selectInput('continent', 'Select Continent', unique(gapminder$continent)),
  sliderInput('year', 'Select Year', 1952, 2007, 1990, step = 5),

plotOutput('plot'), DT::DTOutput('table')
)
使用 R 的 Shiny 建立網頁應用程式

步驟 2:新增輸出(Server)

server <- function(input, output, session){

output$plot <- renderPlot({ ggplot() })
output$table <- DT::renderDT({ gapminder })
}
使用 R 的 Shiny 建立網頁應用程式

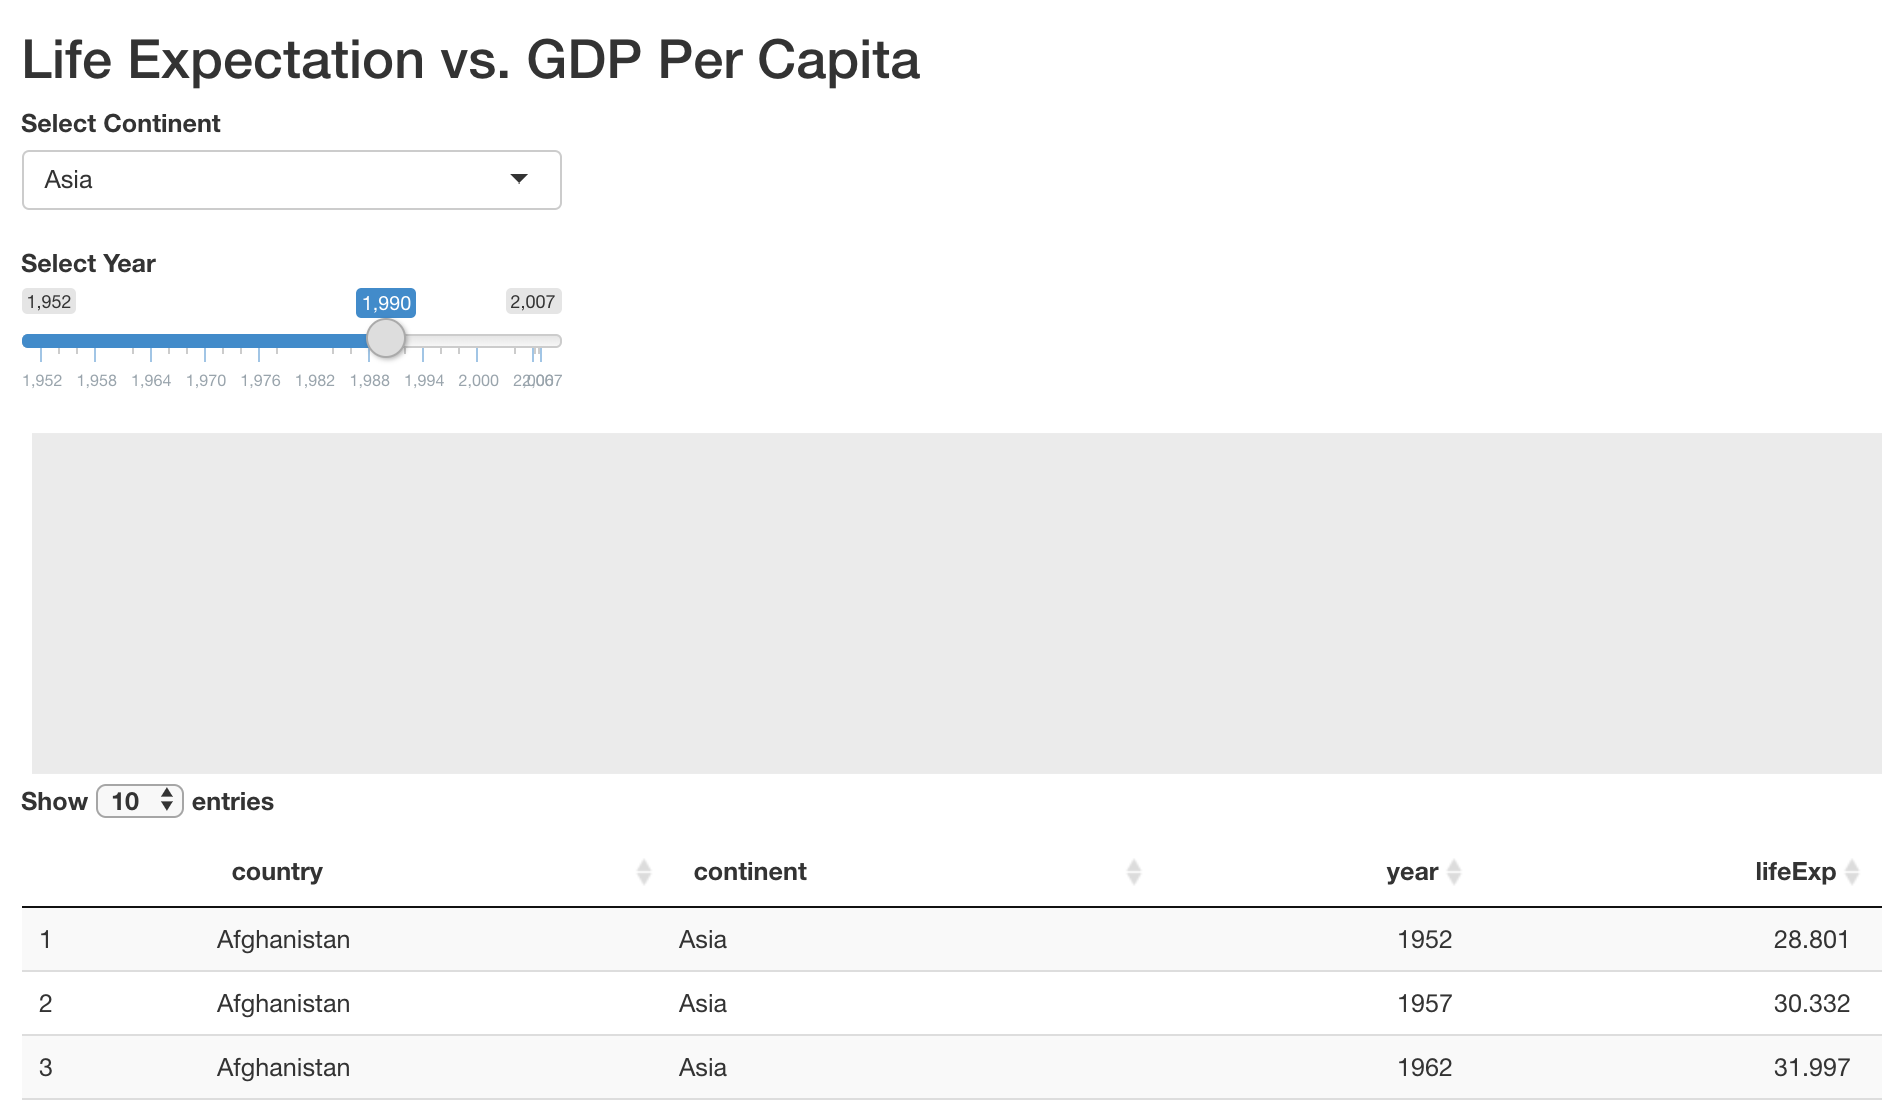
一個應用程式,連同選擇洲別與年份的控制項,顯示空白圖與互動表格

使用 R 的 Shiny 建立網頁應用程式

步驟 3:更新版面(UI)

ui <- fluidPage(
  titlePanel("Life Expectation vs. GDP Per Capita"),

sidebarLayout(
sidebarPanel( selectInput('continent', 'Select Continent', unique(gapminder$continent)), sliderInput('year', 'Select Year', 1952, 2007, 1990, step = 5) ),
mainPanel( plotOutput('plot'), DT::DTOutput('table') )
) )
使用 R 的 Shiny 建立網頁應用程式

步驟 3:更新版面(UI)

ui <- fluidPage(
  titlePanel("Life Expectation vs. GDP Per Capita"),

sidebarLayout(
sidebarPanel( selectInput('continent', 'Select Continent', unique(gapminder$continent)), sliderInput('year', 'Select Year', 1952, 2007, 1990, step = 5) ),
mainPanel( tabsetPanel( tabPanel("Plot", plotOutput('plot')), tabPanel("Table", DT::DTOutput('table')) ) )
) )
使用 R 的 Shiny 建立網頁應用程式

一個應用程式,顯示各洲與年份的預期壽命、人口與人均 GDP 的互動式表格

使用 R 的 Shiny 建立網頁應用程式

步驟 4:更新輸出(Server)

server <- function(input, output, session){
  output$plot <- renderPlot({

data <- gapminder %>% filter(year == input$year) %>% filter(continent == input$continent) print(data) ggplot(data, aes(x = gdpPercap, y = lifeExp)) + geom_point()
}) output$table <- DT::renderDT({
gapminder %>% filter(year == input$year) %>% filter(continent == input$continent) })
}
使用 R 的 Shiny 建立網頁應用程式

一個應用程式,在分頁中顯示各洲與年份的預期壽命對人均 GDP 的互動式散佈圖

使用 R 的 Shiny 建立網頁應用程式

一起來練習吧!

使用 R 的 Shiny 建立網頁應用程式

Preparing Video For Download...