Shiny 入門

使用 R 的 Shiny 建立網頁應用程式

Ramnath Vaidyanathan

VP of Product Research

Shiny 入門
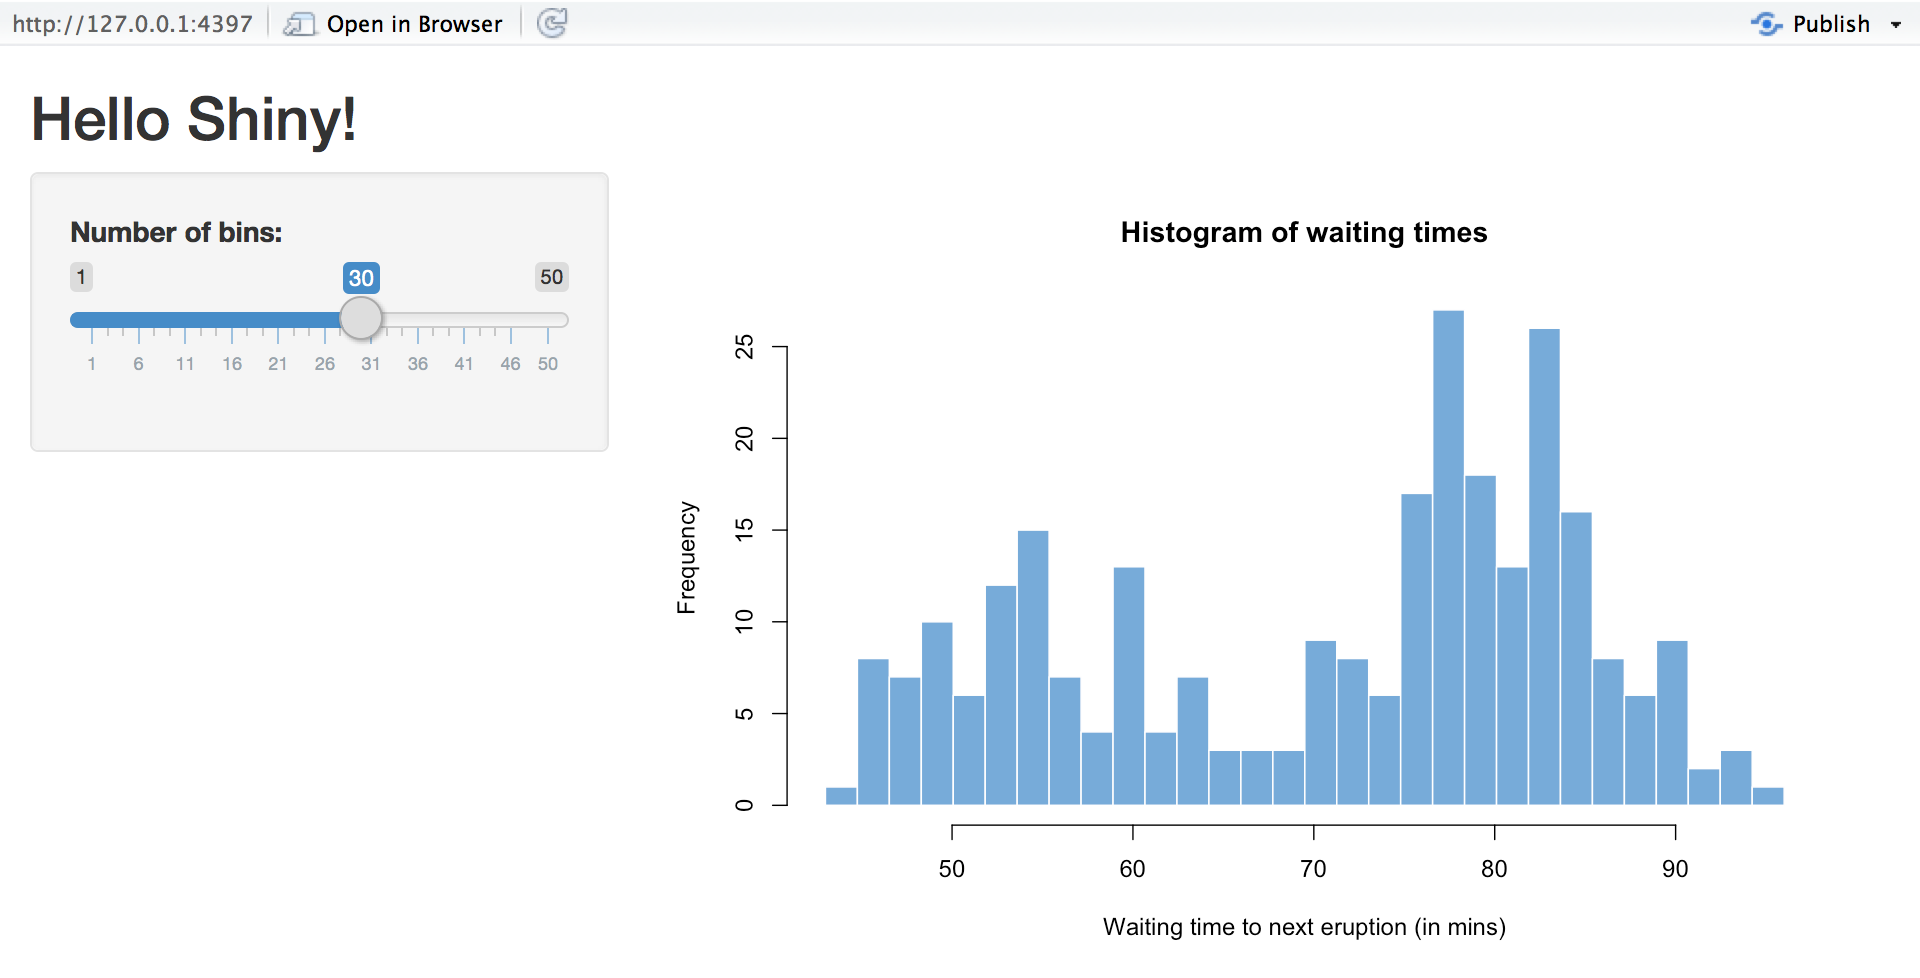
Old Faithful 間歇泉爆發等候時間的 Shiny 網頁應用,長條圖分箱數可互動調整

使用 R 的 Shiny 建立網頁應用程式

什麼是網頁應用?

  • 依使用者輸入/互動即時更新
  • 由 UI 與 server 組成
使用 R 的 Shiny 建立網頁應用程式

什麼是網頁應用?

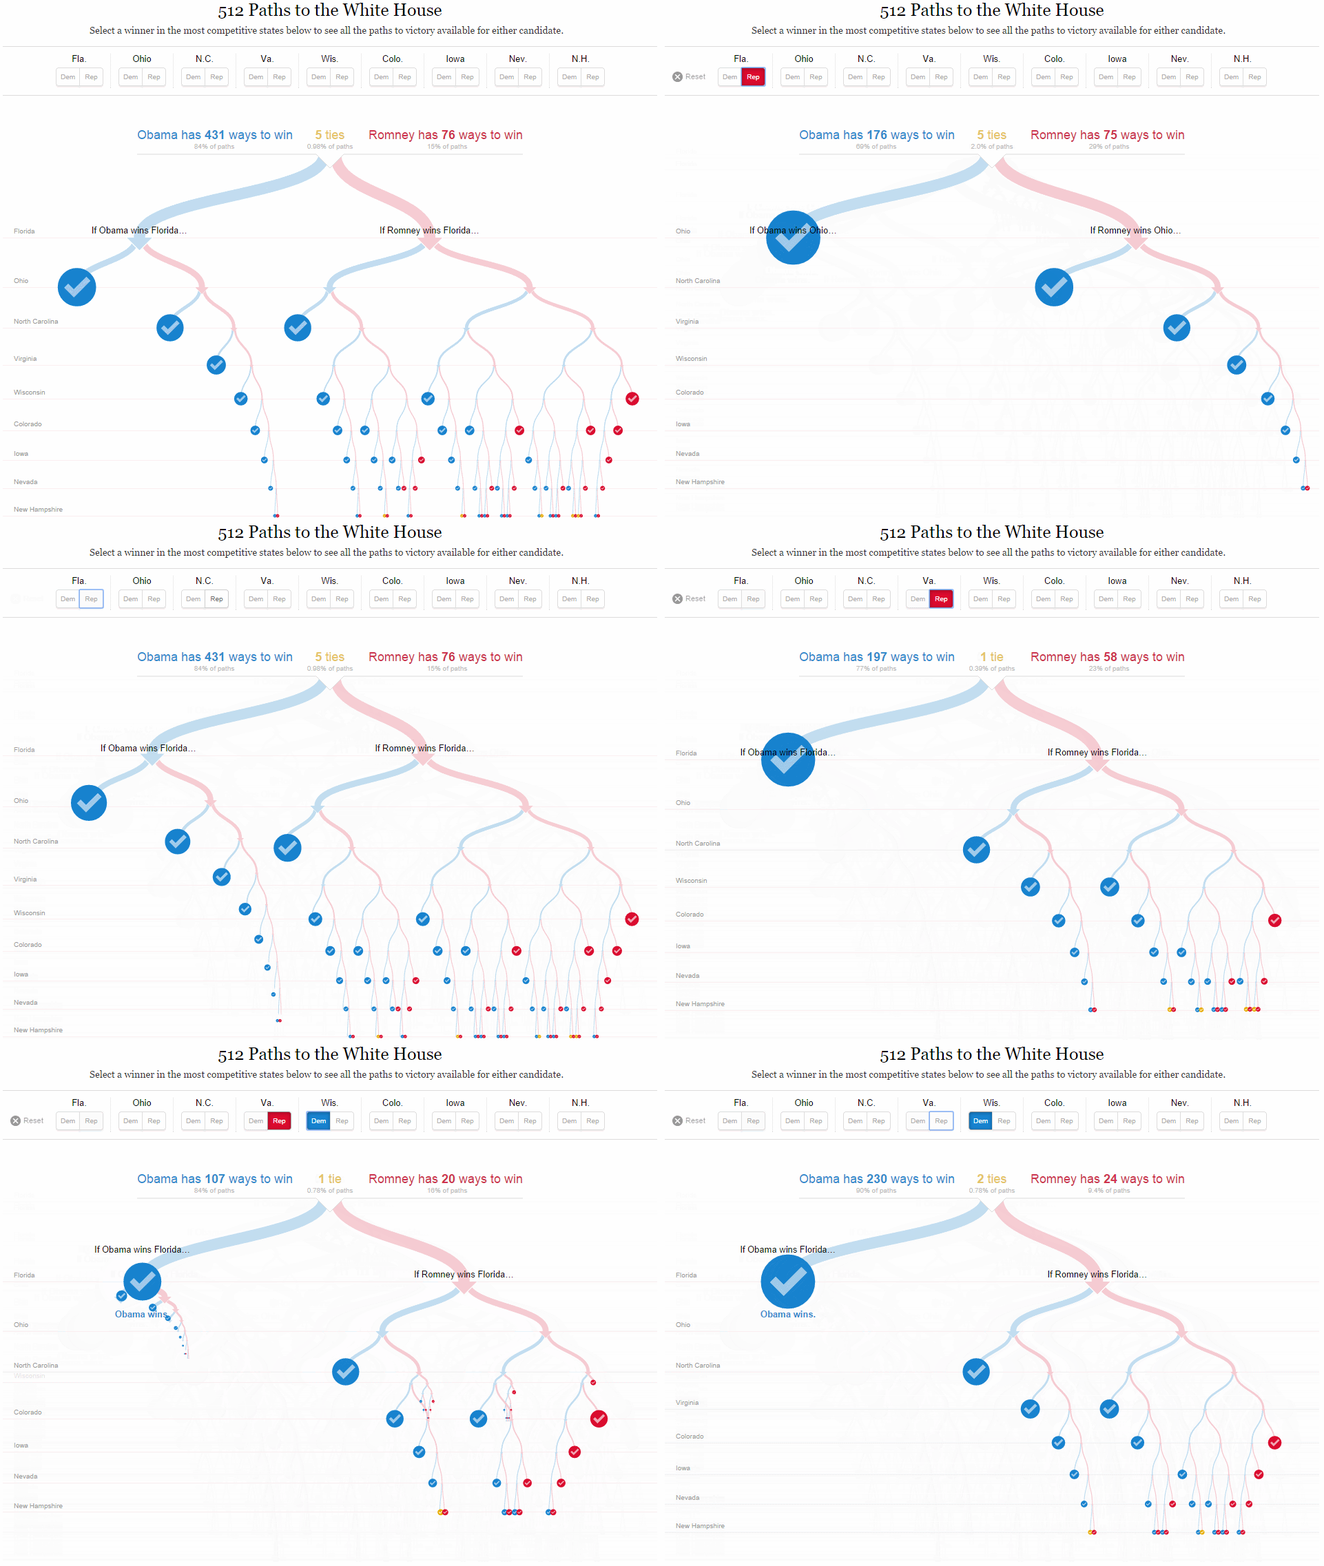
紐約時報「Paths to the White House」網頁應用動圖

  • 顯示不同總統候選人通往白宮的各種路徑。
使用 R 的 Shiny 建立網頁應用程式

什麼是網頁應用?

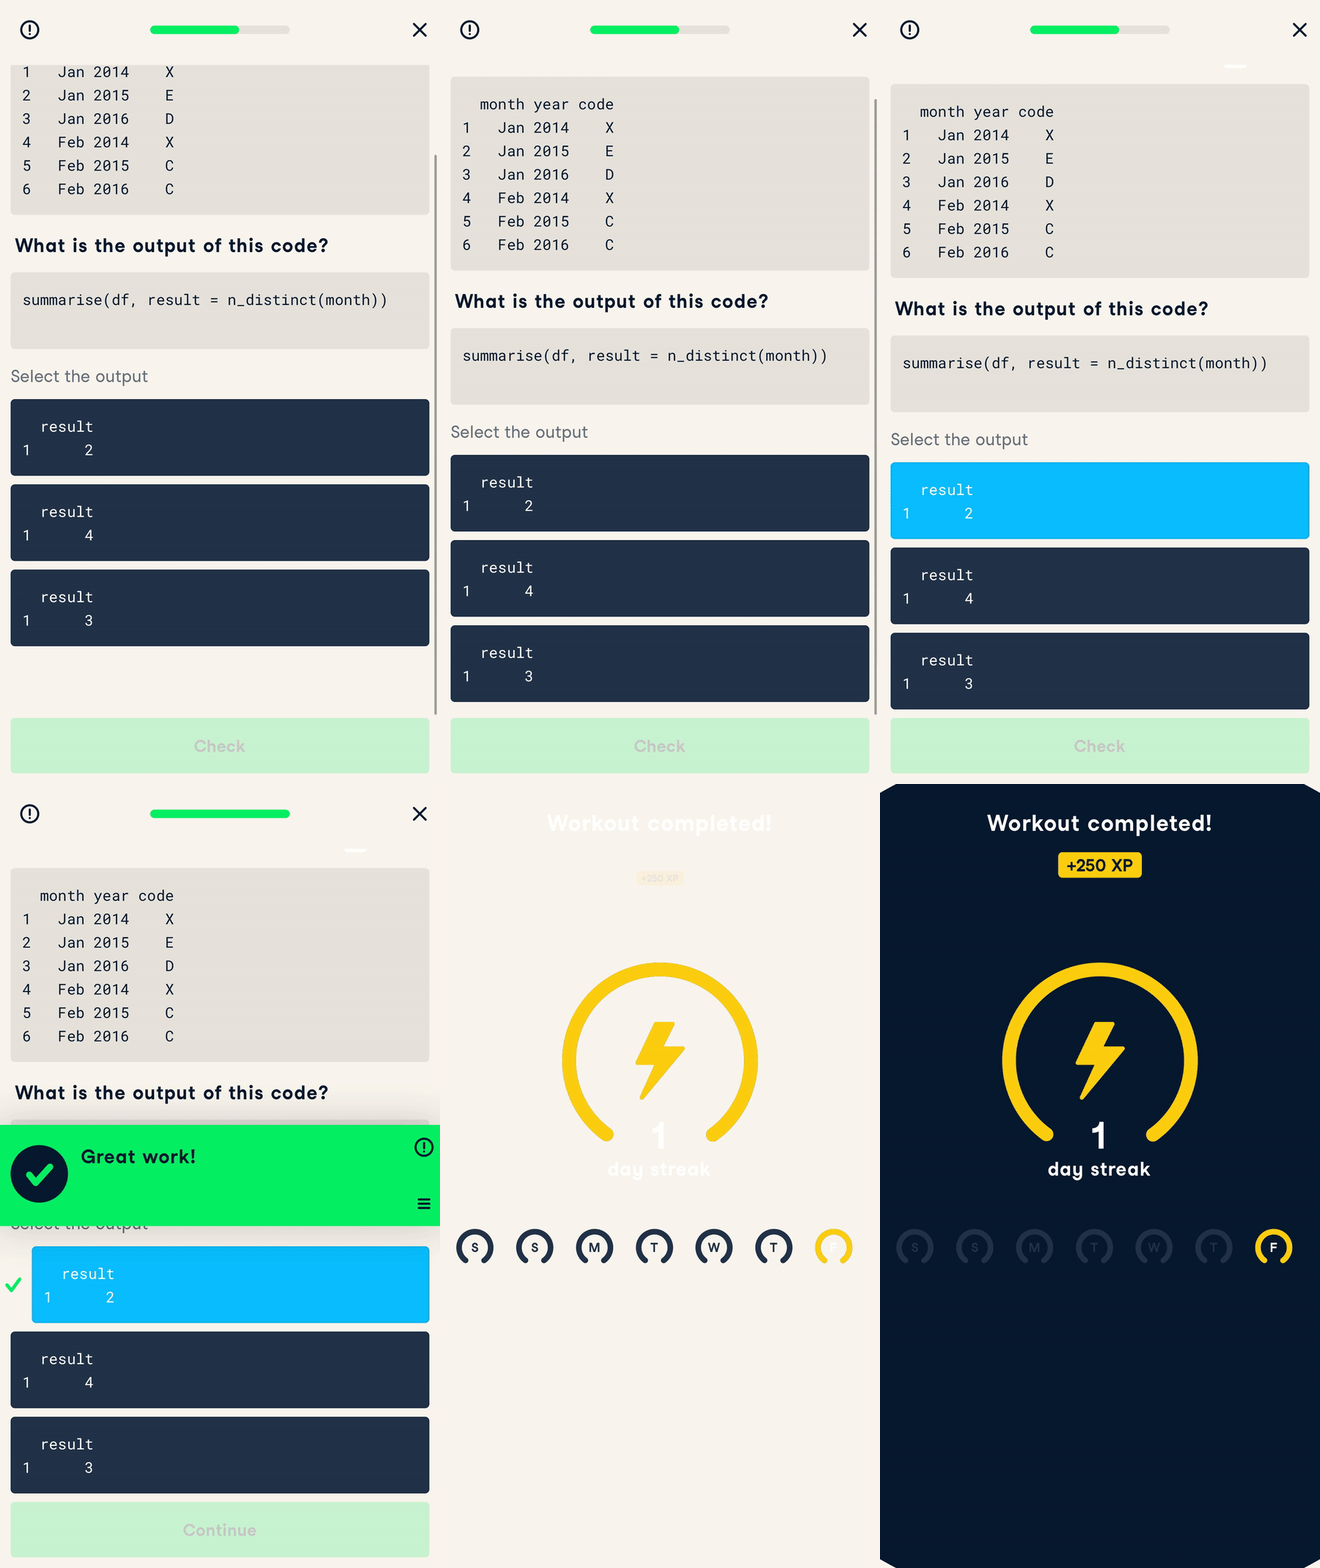
  • DataCamp 行動裝置 App

DataCamp 行動裝置 App 的動圖,顯示一題練習題範例。

使用 R 的 Shiny 建立網頁應用程式

網頁應用如何運作?

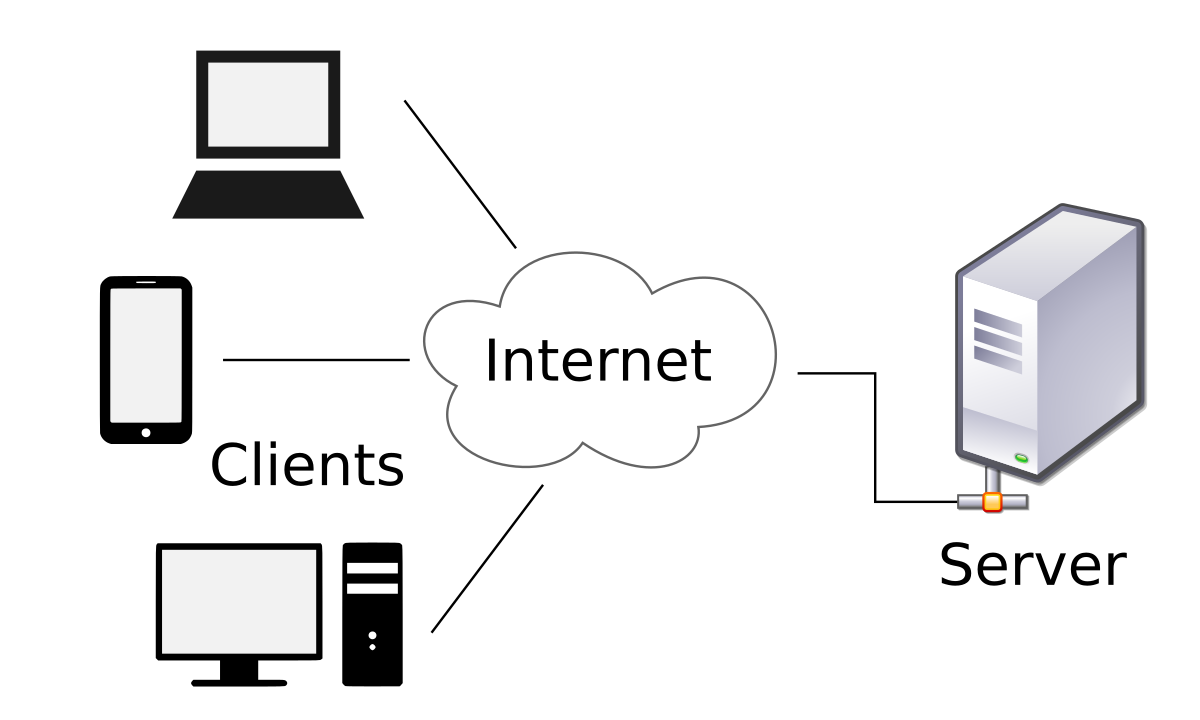
網頁應用會依使用者輸入/互動更新內容。 示意圖:用戶端與伺服器如何連線以支援網頁應用

使用 R 的 Shiny 建立網頁應用程式

什麼是 Shiny?

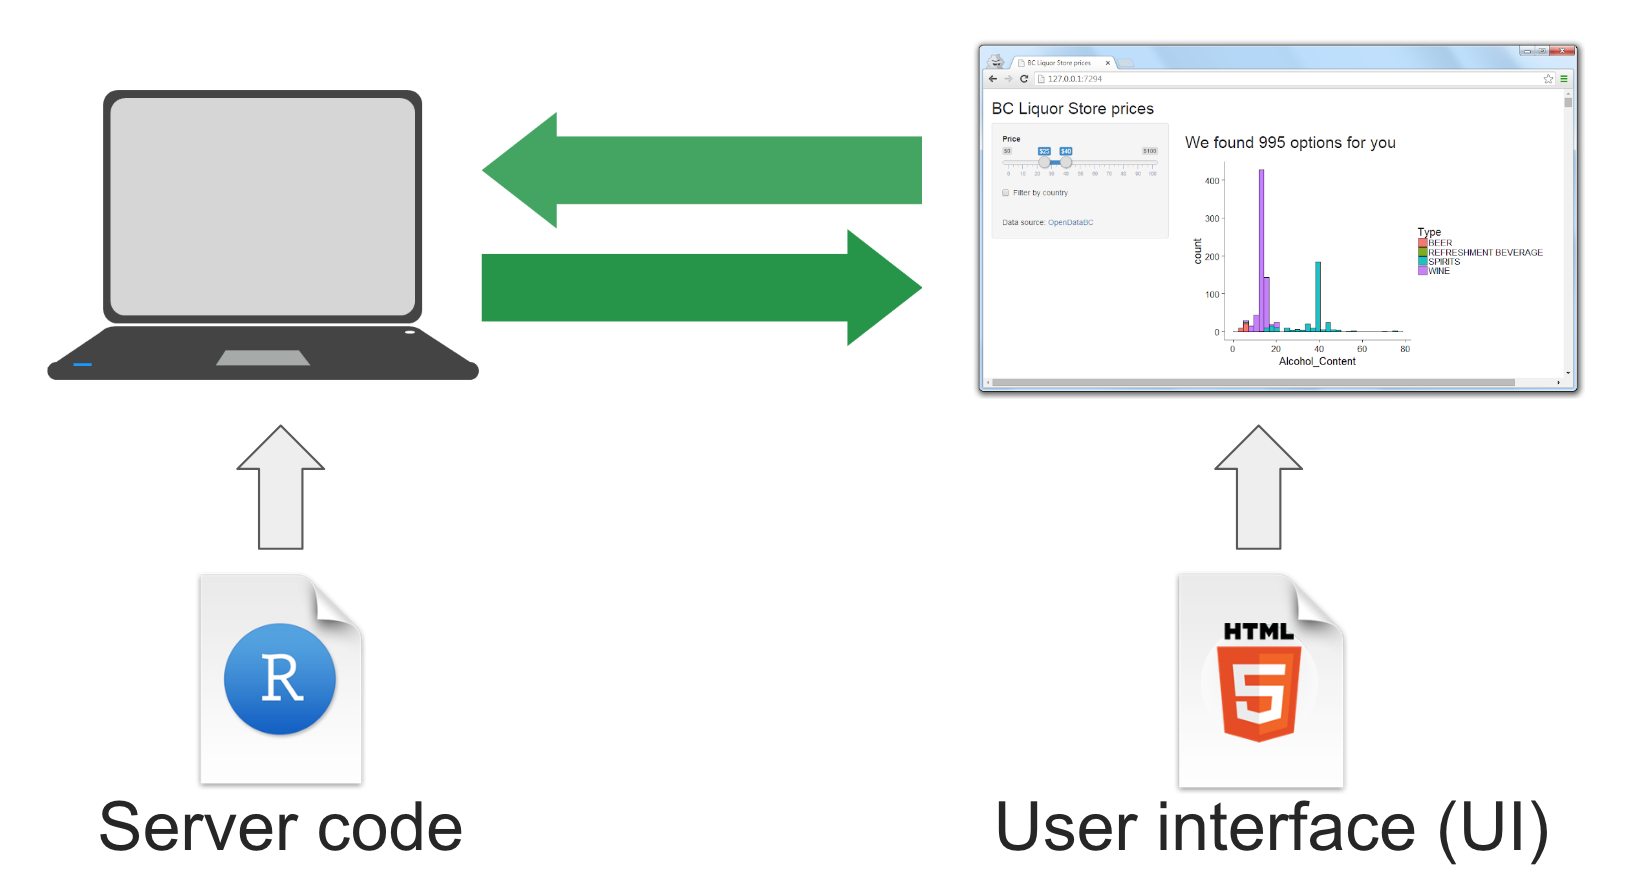
什麼是 Shiny 圖解,顯示 server 程式碼與 UI 介面各自分工、協作產生應用

使用 R 的 Shiny 建立網頁應用程式

資料科學家為何要做網頁應用?

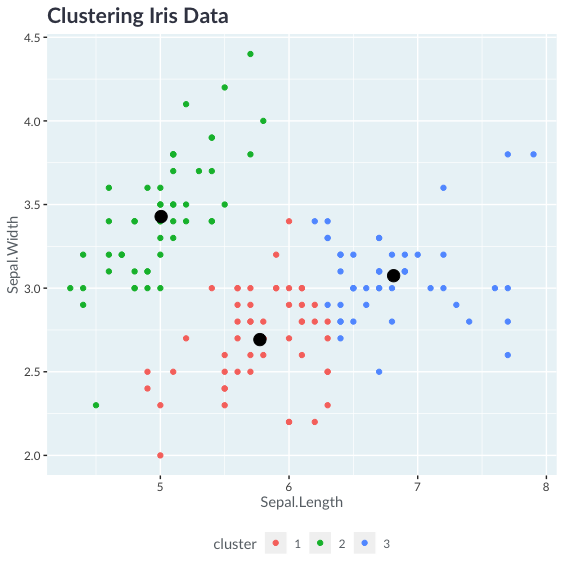
以萼片長度與寬度對 Iris 資料集做分群,形成 3 個明顯叢集

使用 R 的 Shiny 建立網頁應用程式

資料科學家為何要做網頁應用?

plot_kmeans(
  data = iris, 
  x = 'Sepal.Length', 
  y = 'Sepal.Width', 
  nb_clusters = 3
)

以萼片長度與寬度對 Iris 資料集做分群,形成 3 個明顯叢集

使用 R 的 Shiny 建立網頁應用程式

資料科學家為何要做網頁應用?

library(shiny)
ui <- fluidPage(
  h1('K-Means Clustering App'),
  selectInput('x', 'Select x', names(iris), 'Sepal.Length'),
  selectInput('y', 'Select y', names(iris), 'Sepal.Width'),
  numericInput('nb_clusters', 'Select number of clusters', 3),
  plotly::plotlyOutput('kmeans_plot')
)

server <- function(input, output, session){
  output$kmeans_plot <- plotly::renderPlotly({
    plot_kmeans(iris, input$x, input$y, input$nb_clusters)
  })
}

shinyApp(ui = ui, server = server)
使用 R 的 Shiny 建立網頁應用程式

資料科學家為何要做網頁應用?

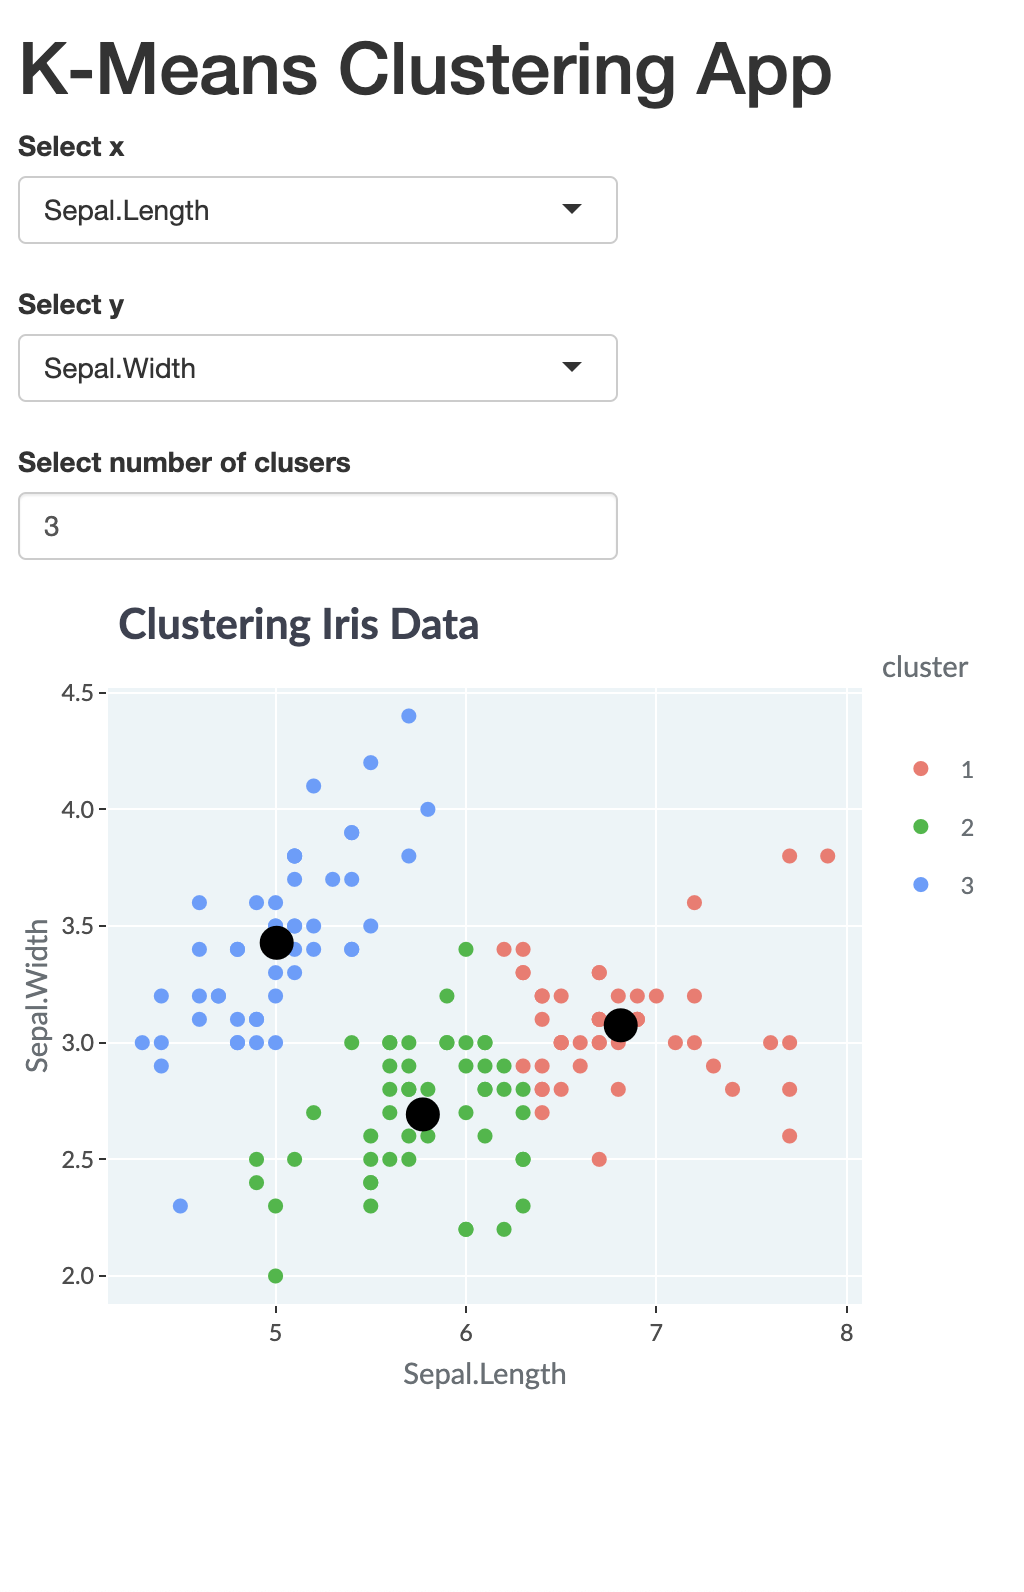
對 Iris 資料集做 K-means 分群的網頁應用

使用 R 的 Shiny 建立網頁應用程式

一起來練習吧!

使用 R 的 Shiny 建立網頁應用程式

Preparing Video For Download...