使用 DVC 進行資料版本控管入門
Ravi Bhadauria
Machine Learning Engineer
outs
stages:
  train_and_evaluate:
    outs:
    - metrics.json
    - plots.png
$$ $$
metrics
stages:
  train_and_evaluate:
    outs:
    - plots.png
    metrics:
      - metrics.json:
        cache: false
$ dvc metrics show
Path          accuracy    f1_score    precision    recall
metrics.json  0.947       0.8656      0.988        0.7702
dvc repro
$ dvc metrics diff
Path          Metric     HEAD    workspace    Change
metrics.json  accuracy   0.947   0.9995       0.0525
metrics.json  f1_score   0.8656  0.9989       0.1333
metrics.json  precision  0.988   0.9993       0.0113
metrics.json  recall     0.7702  0.9986       0.2284
stages:
  train_and_evaluate:
    ...
    plots:
    - predictions.csv: # 預測結果檔名
        template: confusion # 圖表樣式

        x: predicted_label # csv 的 X 軸欄位
        y: true_label # csv 的 Y 軸欄位
        x_label: 'Predicted label'
        y_label: 'True label'
        title: Confusion matrix

        cache: false # 儲存到 Git
stages: train_and_evaluate: ... plots: - predictions.csv: # 預測結果檔名 template: confusion # 圖表樣式
x: predicted_label # csv 的 X 軸欄位 y: true_label # csv 的 Y 軸欄位 x_label: 'Predicted label' y_label: 'True label' title: Confusion matrix
cache: false # 儲存到 Git
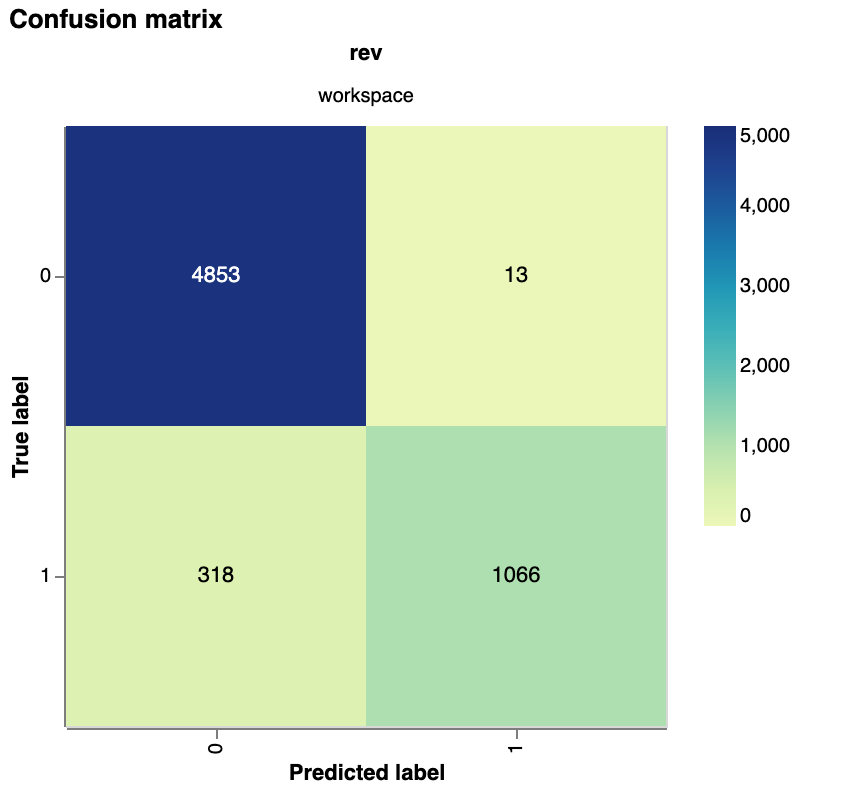
$ dvc plots show predictions.csv
file:///path/to/index.html
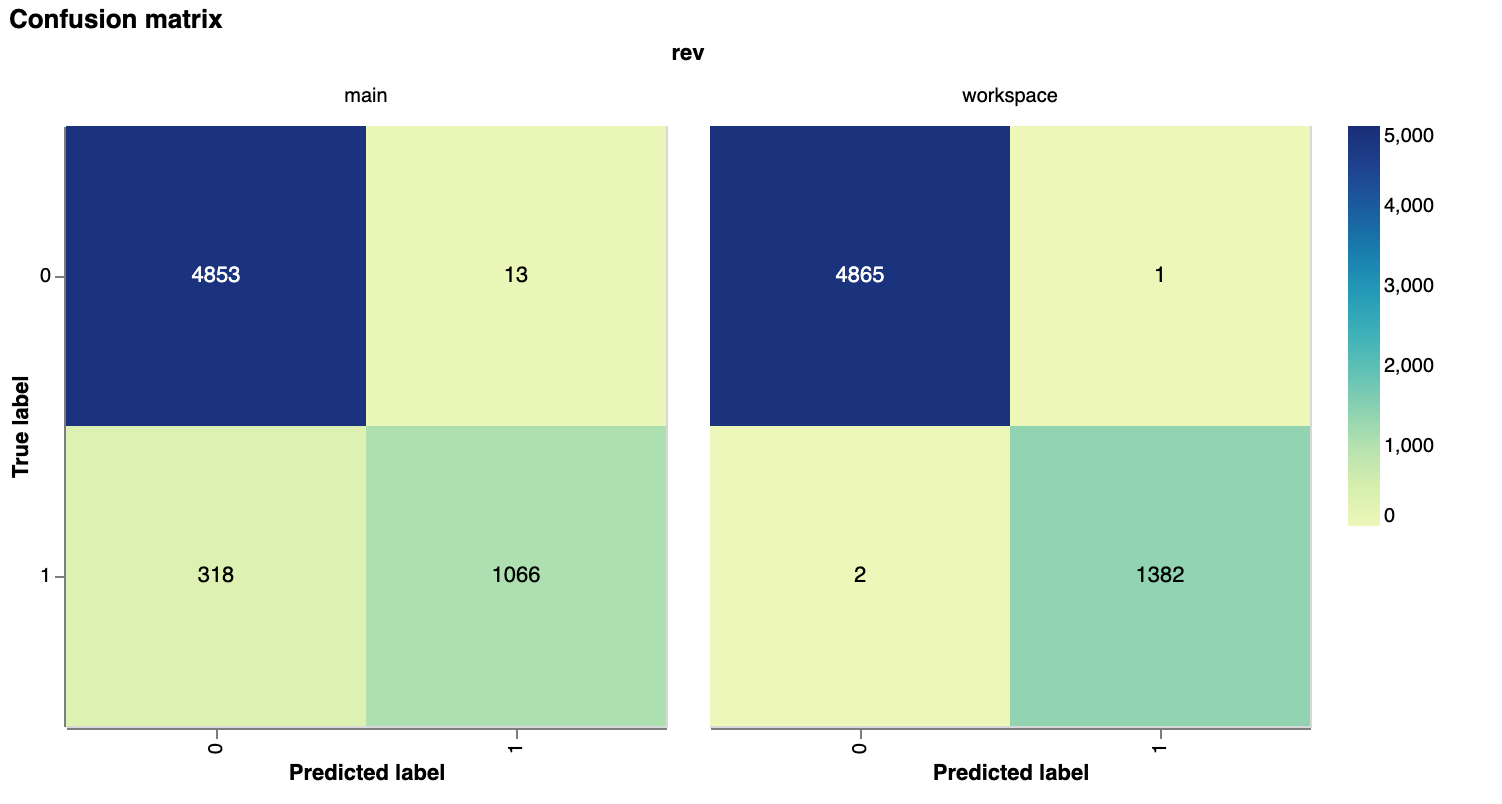
# 將 predictions.csv 的圖表與 main 分支比較
$ dvc plots diff --target predictions.csv <branch name or commit SHA>