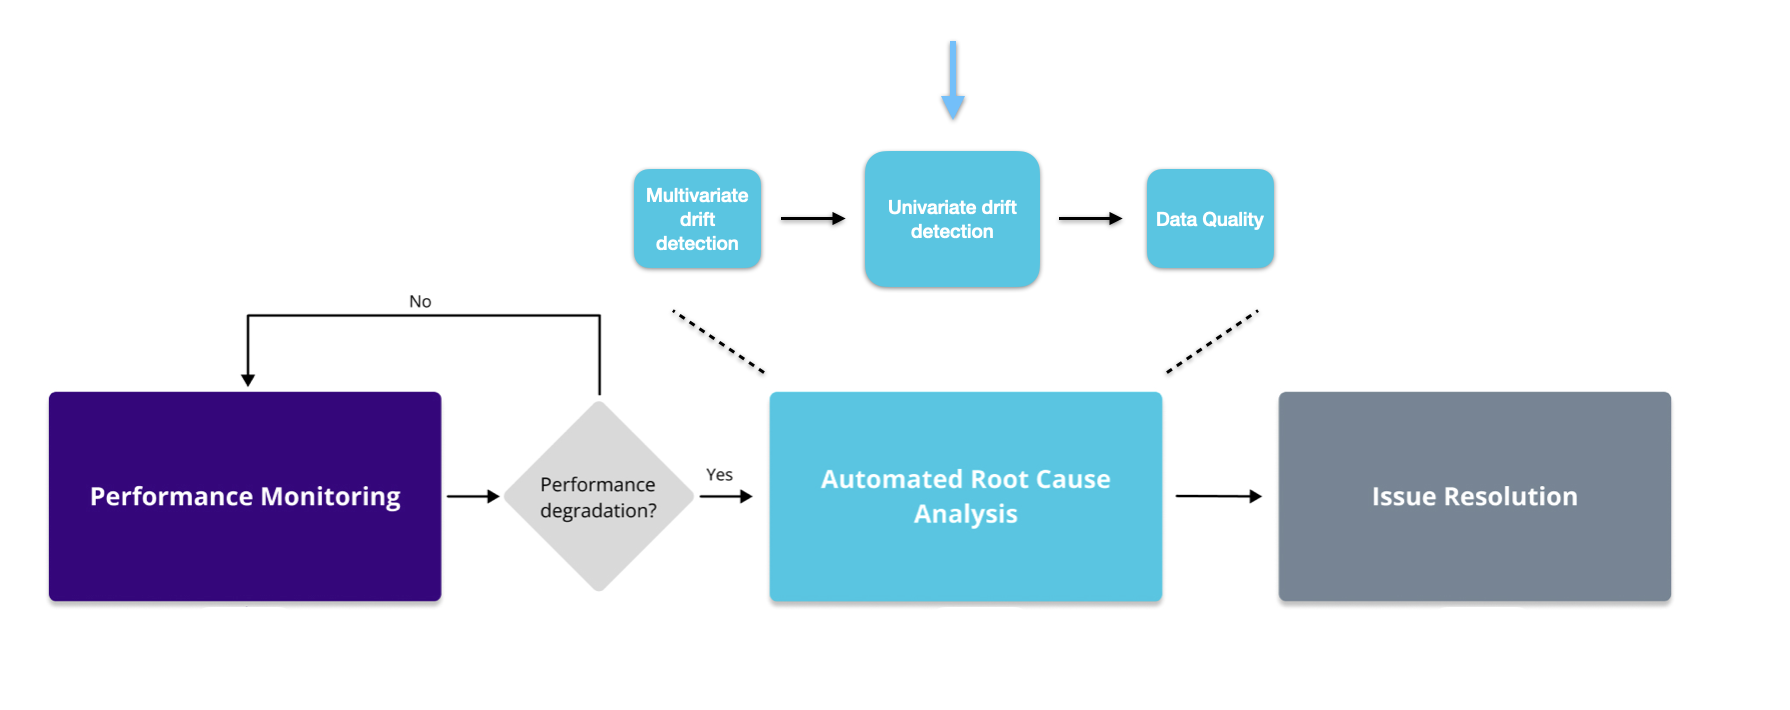
在 Python 中監控 Machine Learning
Hakim Elakhrass
CEO and co-founder

Kolgomorov-Smirnov-僅限連續
L-infinity-僅限類別
Chi2-僅限類別
# 初始化單變量漂移計算器
uv_calc = nannyml.UnivariateDriftCalculator(
continuous_methods=['wasserstein', 'hellinger'],
categorical_methods=['jensen_shannon', 'l_infinity', 'chi2'],
column_names=feature_column_names,
timestamp_column_name='timestamp',
chunk_period='d'
)
# 擬合、計算並繪圖
uv_calc.fit(reference)
uv_results = uv_calc.calculate(analysis)
uv_results.plot().show()
# 篩選單變量結果
filtered_figure = uv_results.filter(column_names=['trip_distance', 'fare_amount'],
methods=['jensen_shannon'])
# 繪製篩選後結果
filtered_figure.show().plot()
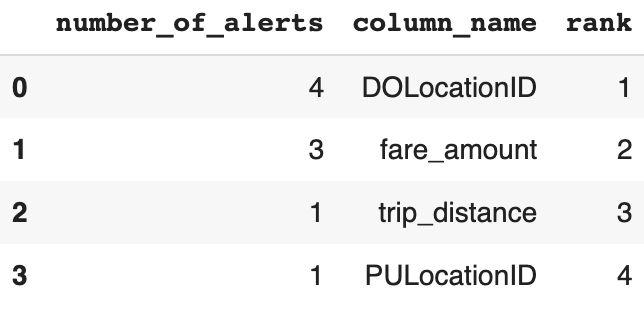
# 初始化警示計數排序器
alert_count_ranker = nannyml.AlertCountRanker()
alert_count_ranked_results = alert_count_ranker.rank(
uv_results,
only_drifting=False)
# 顯示結果
display(alert_count_ranked_results)
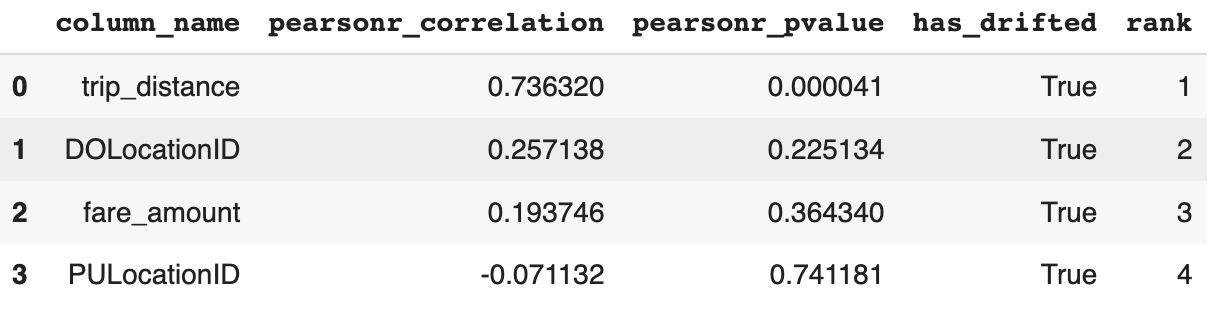
# 初始化相關性排序器
correlation_ranker = nannyml.CorrelationRanker()
correlation_ranker.fit(perf_results.filter(period='reference'))
correlation_ranked_results = correlation_ranker.rank(uv_results, perf_results)
# 顯示結果
display(correlation_ranked_results)
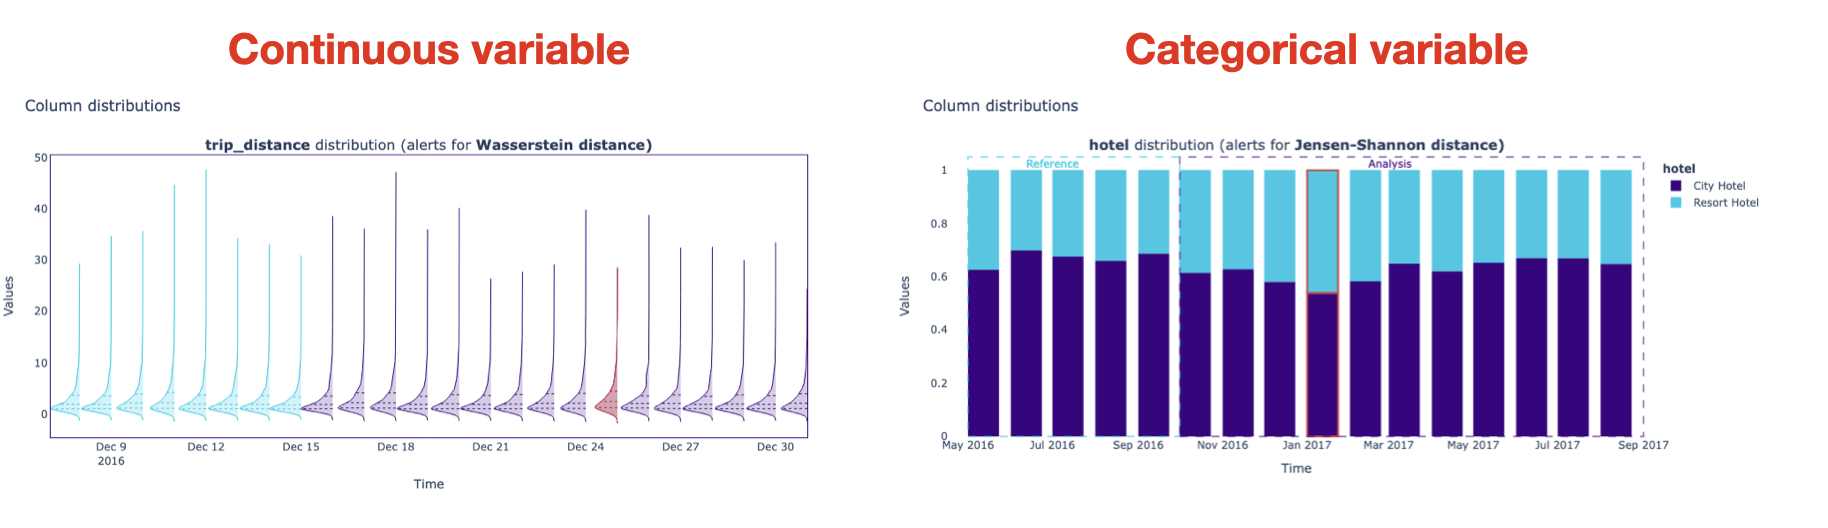
# 建立分布圖
distribution_results = uv_results.plot(kind='distribution')
# 顯示圖表
distribution_results.show()

在 Python 中監控 Machine Learning