使用計算與估計結果

在 Python 中監控 Machine Learning

Maciej Balawejder

Data Scientist

如何分塊資料?
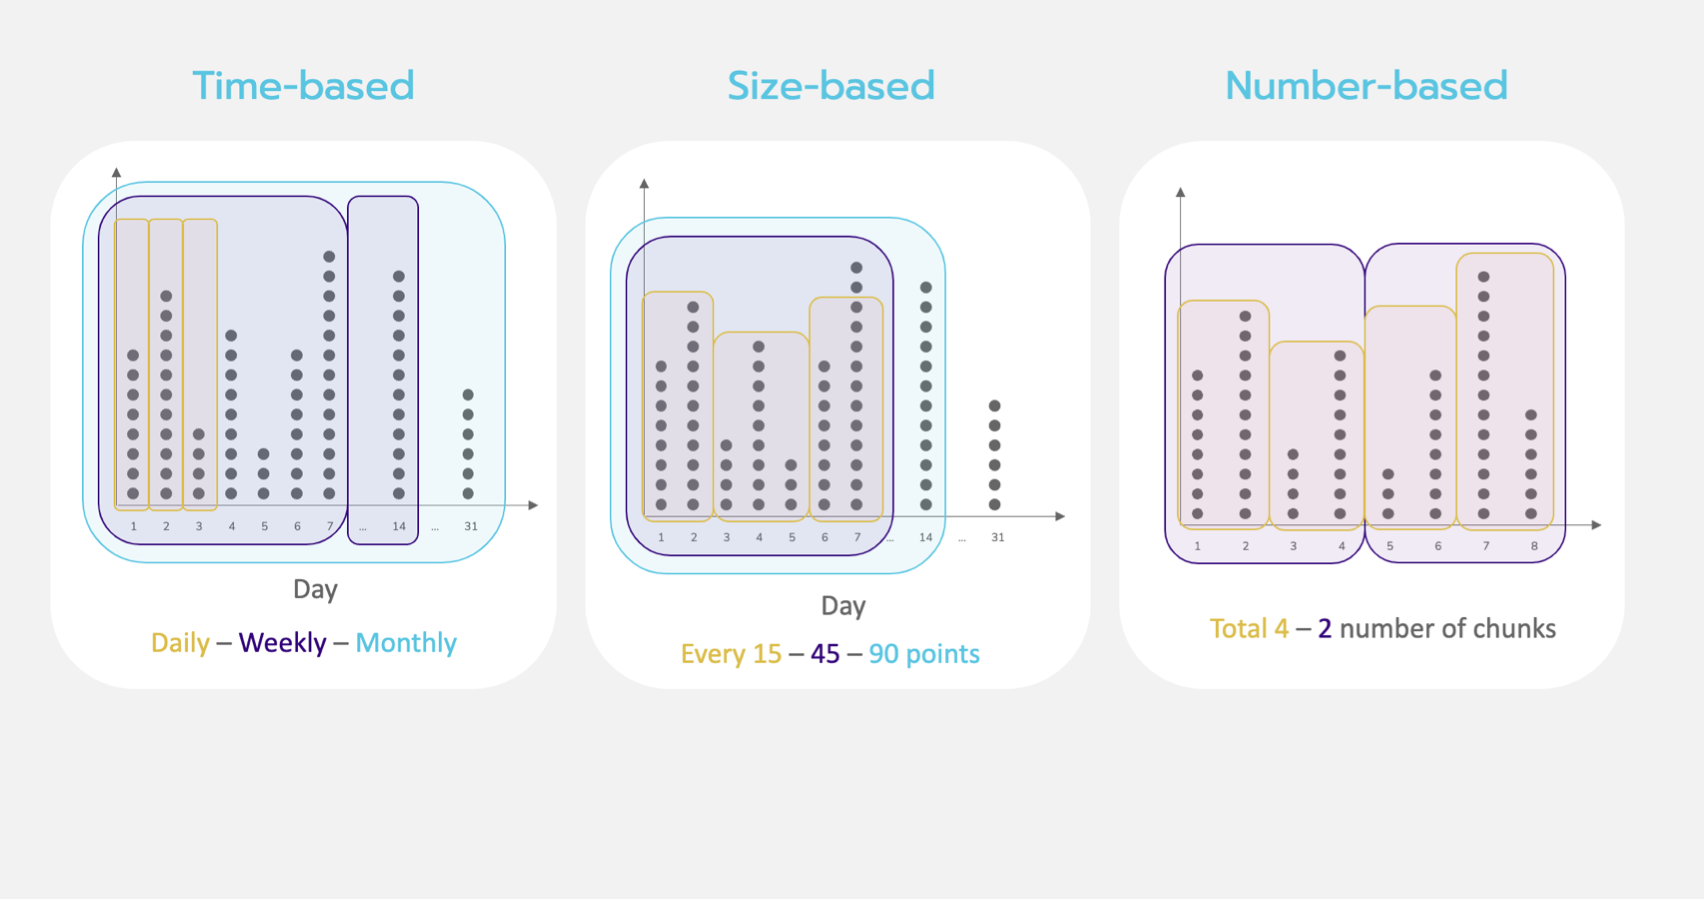
圖片顯示三種分塊方式:依型別、依大小、依數量。

在 Python 中監控 Machine Learning

指定不同的分塊

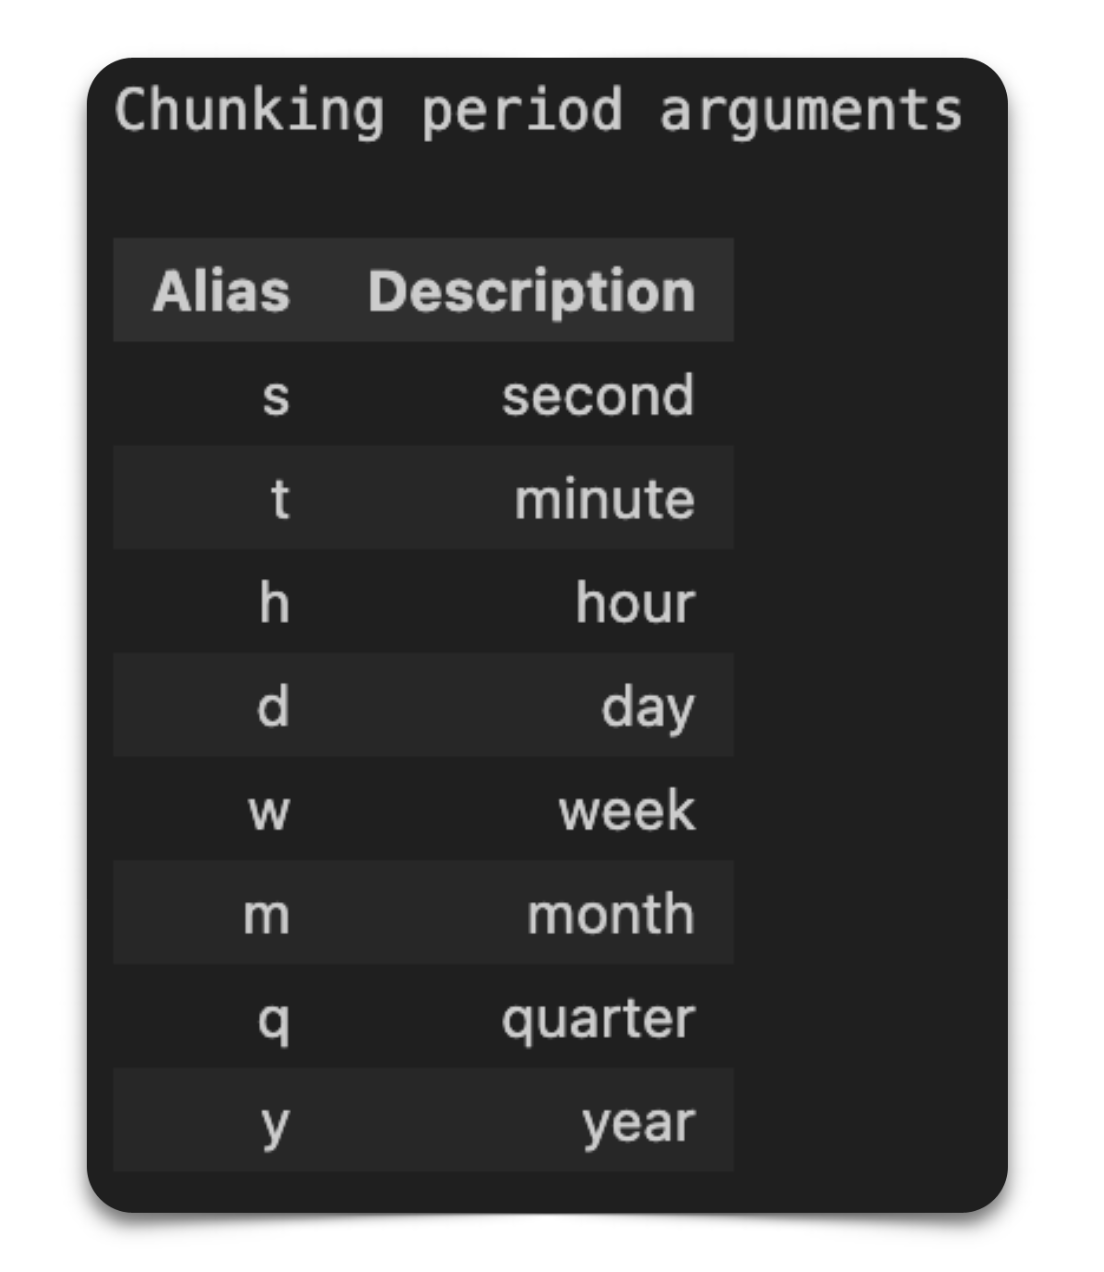
圖片顯示可作為引數傳入分塊期間參數的時間型別別名。

# Initialize the algorithm
cbpe = nannyml.CBPE(
   problem_type='classification_binary',
   y_pred_proba='predicted_probability',
   y_pred='prediction',
   y_true='employed',
   metrics=['roc_auc'],
   chunk_period='m',
   # chunk_size = 5000, 
   # chunk_number = 10
)
在 Python 中監控 Machine Learning

初始化自訂門檻

標準差門檻

  • 手動設定下限與上限的標準差倍數
# Standard deviation thresholds
stdt = StandardDeviationThreshold(
    std_lower_multiplier=3, 
    std_upper_multiplier=3
    )

固定門檻

  • 手動設定上下限的固定值
# Constant thresholds
ct = ConstantThreshold(
    lower=0.85, 
    upper=0.95
    )
在 Python 中監控 Machine Learning

指定自訂門檻

# Import threshold methods(last slide)
from nannyml.thresholds import ConstantThreshold, StandardDeviationThreshold

# Passing thresholds to the CBPE algorithm
estimator = nannyml.CBPE(...
    metrics = ['roc_auc', 'accuracy'],
    thresholds={'roc_auc': ct, 'accuracy' : stdt}
)

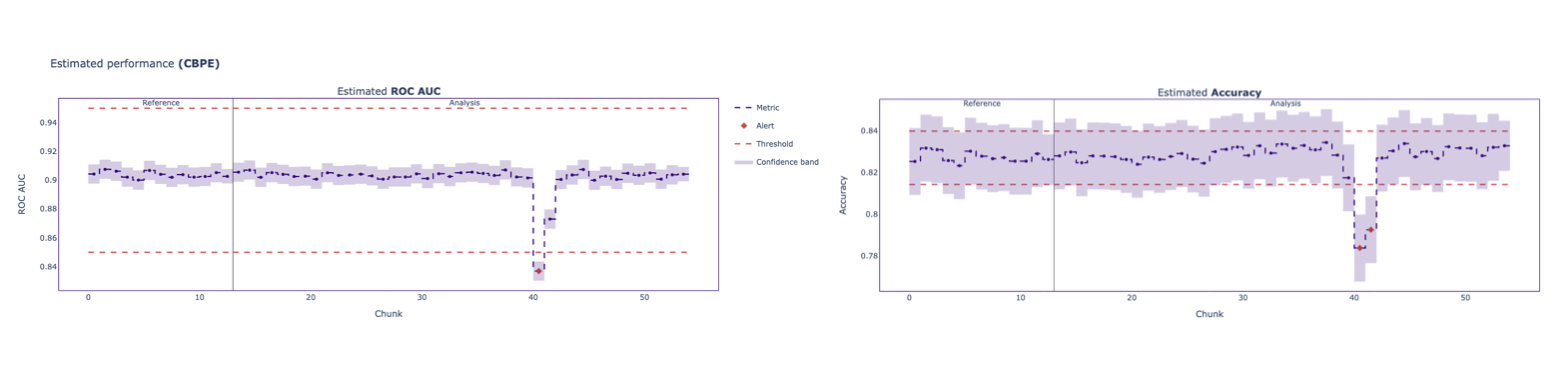
圖片顯示 ROC AUC 與 accuracy 指標的估計效能圖,並套用自訂門檻。

在 Python 中監控 Machine Learning

篩選結果

  • 依期間
    filtered_results = results.filter(period='analysis')
    
  • 依指標

    filtered_results = results.filter(metrics=['mae'])
    
  • 同時篩選

    filtered_results = results.filter(period='analysis', metrics=['mae'])
    
在 Python 中監控 Machine Learning

匯出為 dataframe

# Export results to dataframe format
results.filter(period='analysis').to_df()

圖片顯示 dataframe 格式的結果。

在 Python 中監控 Machine Learning

一起來練習吧!

在 Python 中監控 Machine Learning

Preparing Video For Download...