Python 的生醫影像分析
Stephen Bailey
Instructor
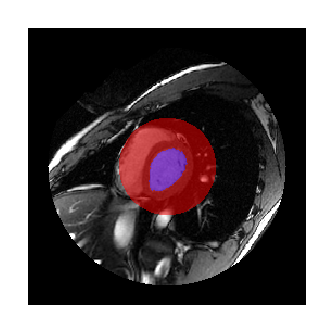
以下是單一時間點的心臟時間序列標記:

scipy.ndimage.measurements
ndi.mean()
ndi.median()
ndi.sum()
ndi.maximum()
ndi.standard_deviation()
ndi.variance()
可對所有維度計算的函式,也可指定標記區域。
自訂函式:
ndi.labeled_comprehension()
import imageio.v2 as imageio import scipy.ndimage as ndi vol=imageio.volread('SCD-3d.npz') label=imageio.volread('labels.npz')# 全部像素 ndi.mean(vol)
3.7892
# 已標記像素
ndi.mean(vol, label)
89.2342
# 標記 1
ndi.mean(vol, label, index=1)
163.2930
# 標記 1 與 2
ndi.mean(vol, label, index=[1,2])
[163.2930, 60.2847]
hist=ndi.histogram(vol, min=0, max=255, bins=256)obj_hists=ndi.histogram(vol, 0, 255, 256, labels, index=[1, 2]) len(obj_hists)
2
plt.plot(obj_hists[0],
label='Left ventricle')
plt.plot(obj_hists[1],
label='Other labelled pixels')
plt.legend()
plt.show()
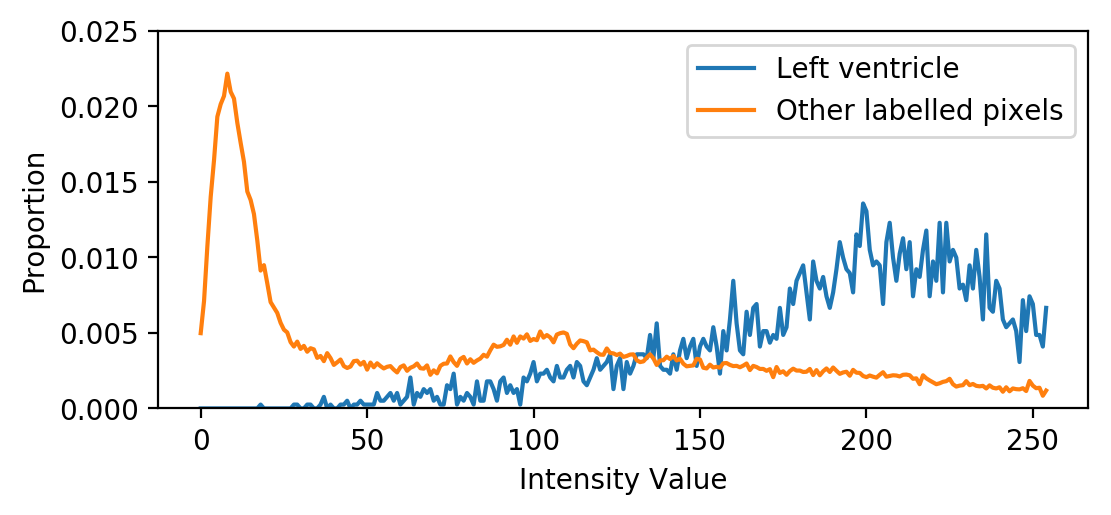
含多種組織的長條圖會出現多個峰值
分割良好的組織,其長條圖常近似常態分佈
Python 的生醫影像分析