導論

在 Python 視覺化地理空間資料

Mary van Valkenburg

Data Science Program Manager, Nashville Software School

位置

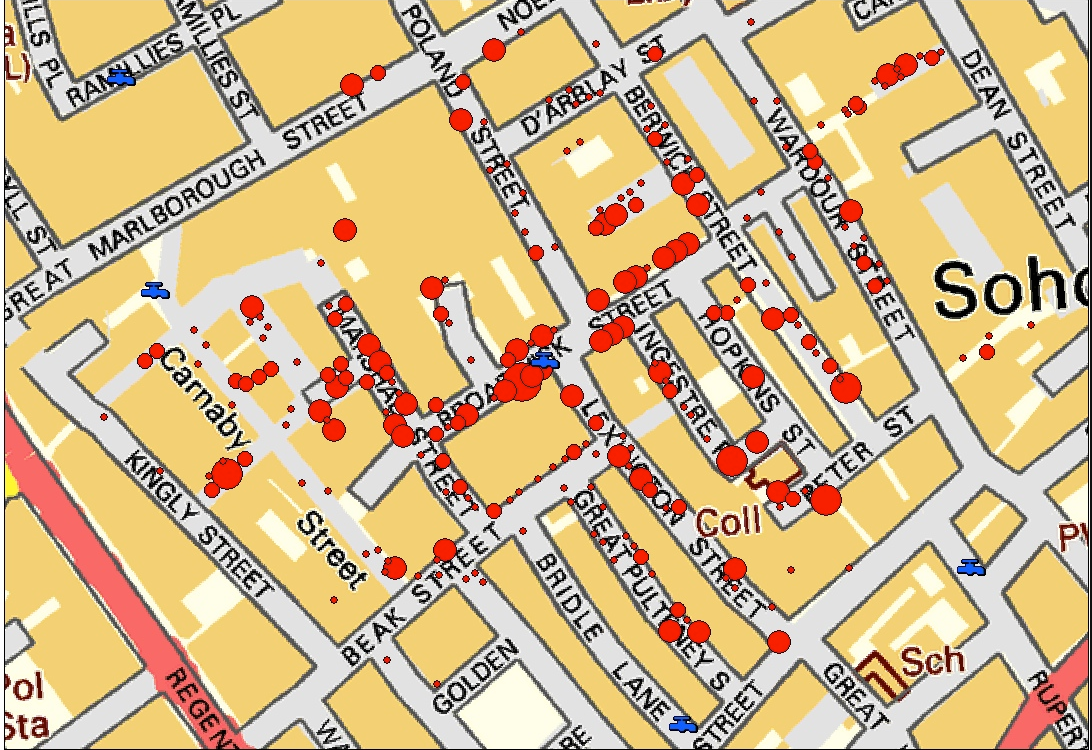
  • 1854 年倫敦霍亂爆發
  • 超過 600 人死亡

瘴氣雲

在 Python 視覺化地理空間資料

Snow 的點狀地圖

在 Python 視覺化地理空間資料

本課你將學到

  • 如何將地理座標畫成散佈圖
  • 使用 geopandas 繪製幾何圖形
  • DataFrame 建立 GeoDataFrame
  • 如何做資料集的空間連接
  • 為圖表加入街道地圖
  • 何時與如何建立等值區域圖
在 Python 視覺化地理空間資料

經度與緯度

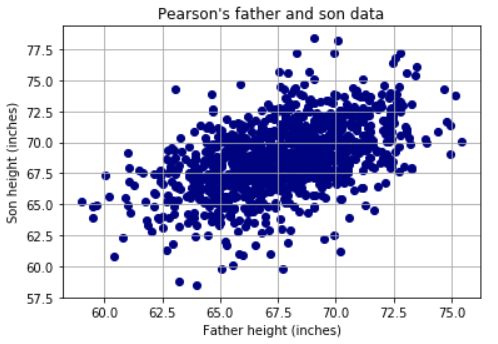
父子身高散佈圖

帶有經緯度網格的地球

在 Python 視覺化地理空間資料
plt.scatter(schools.Longitude, 
            schools.Latitude, 
            c = 'darkgreen', 
            marker = 'p')
plt.show()
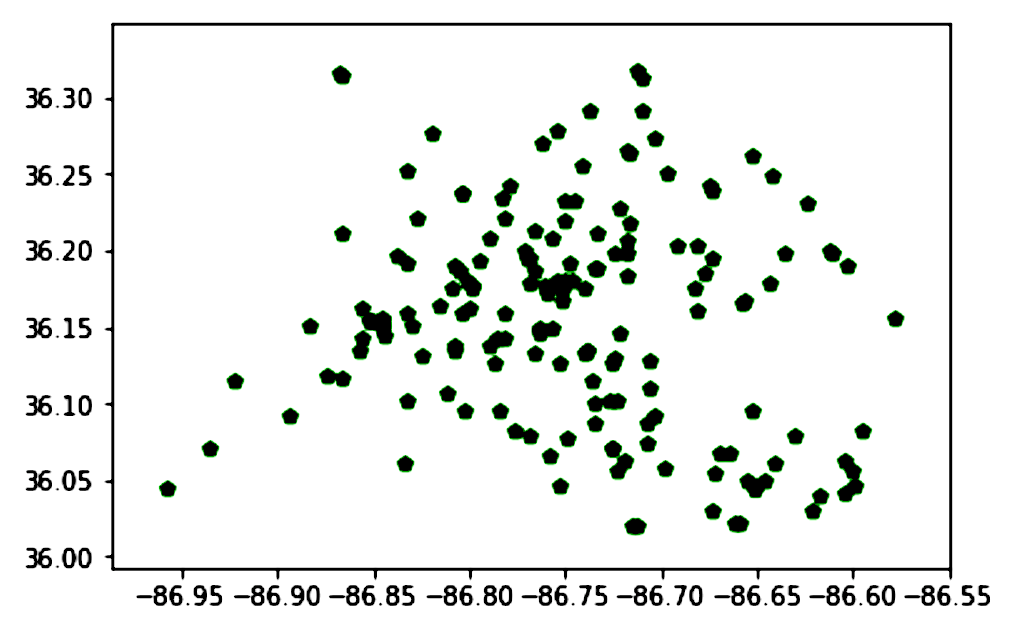
學校位置的純散佈圖

plt.scatter(schools.Longitude, schools.Latitude, 
            c = 'darkgreen', marker = 'p')
plt.xlabel('Longitude')
plt.ylabel('Latitude')
plt.title('Nashville Public Schools')
plt.grid()
plt.show()
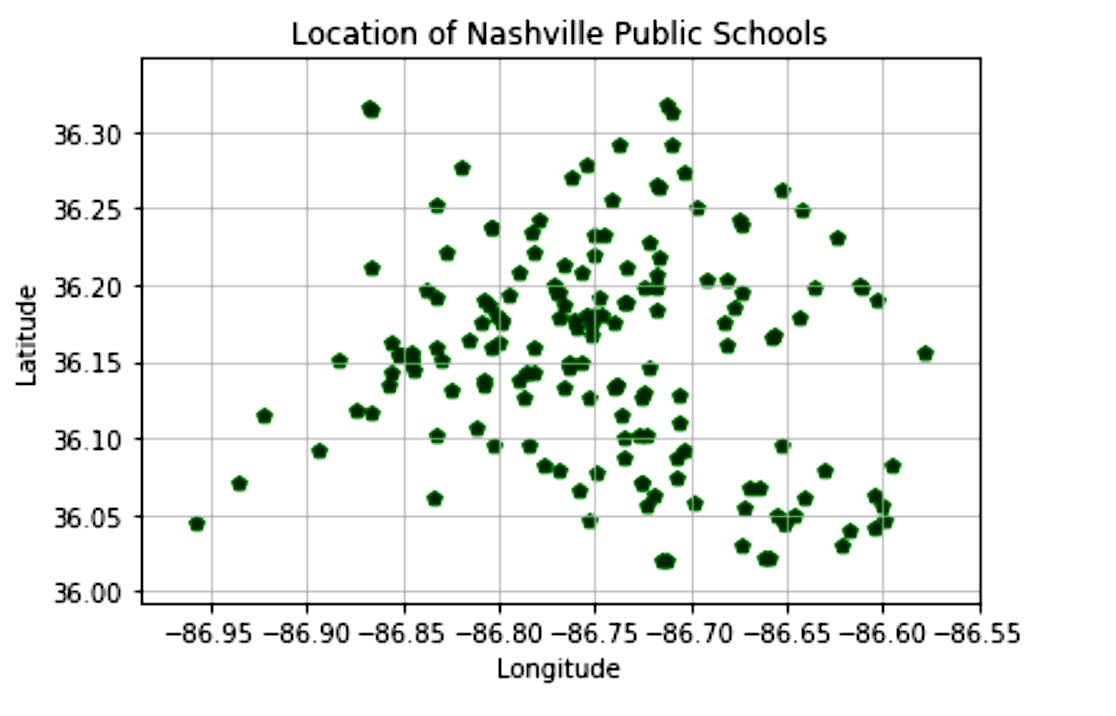
含標籤、標題、格線的學校位置散佈圖

在 Python 視覺化地理空間資料

擷取經緯度

bus_stops.head()
Stop ID    StopName       Location
4431      MCC5_11    (36.16659, -86.781996)
588       CHA7AWN    (36.165, -86.78406)
590       CHA8AWN    (36.164393, -86.785451)
541       CXONGULC   (36.162249, -86.790464)
5231      7AVUNISM   (36.163822, -86.783791)

在 Python 視覺化地理空間資料

擷取經緯度

bus_stops['lat'] = [loc[0] for loc in bus_stops.Location]
bus_stops['lng'] = [loc[1] for loc in bus_stops.Location]
bus_stops.head()
Stop ID    StopName  Location                  lat         lng
4431      MCC5_11   (36.16659, -86.781996)    36.16659    -86.781996    
588       CHA7AWN  (36.165, -86.78406)        36.165      -86.78406
590       CHA8AWN  (36.164393, -86.785451)    36.164393   -86.785451
541       CXONGULC  (36.162249, -86.790464)   36.162249   -86.790464
5231      7AVUNISM  (36.163822, -86.783791)   36.163822   -86.783791

在 Python 視覺化地理空間資料

用正規表示式擷取經緯度

bus_stops2.head()
Stop ID        Location            
4431       MCC - BAY 11\nNashville, TN\n(36.16659, -86.78199)
588        CHARLOTTE AVE\nNashville, TN\n(36.165, -86.78406)
590        CHARLOTTE AV\nNashville, TN\n(36.164393, -86.785451)
541        CHARLOTTE\nNashville, TN\n(36.162249, -86.790464)
5231       Nashville, TN\n(36.163822, -86.783791)
在 Python 視覺化地理空間資料

用正規表示式擷取經緯度

lat_lng_pattern = re.compile(r'\((.*),\s*(.*)\)', flags=re.MULTILINE)
def extract_lat_lng(address):
    try:
        lat_lng_match = lat_lng_pattern.search(address)
        lat = float(lat_lng_match.group(1))
        lng = float(lat_lng_match.group(2))
        return (lat, lng)
    except:
        return (np.NaN, np.NaN)
lat_lngs = [extract_lat_lng(location)for location in \
           bus_stops2.loc[:, 'Location']]
bus_stops2['lat'] = [lat for lat, lng in lat_lngs]
bus_stops2['lng'] = [lng for lat, lng in lat_lngs]

在 Python 視覺化地理空間資料

Nashville 開放資料

nashville.data.gov 螢幕擷取畫面

巨大雞頭

在 Python 視覺化地理空間資料

一起來練習吧!

在 Python 視覺化地理空間資料

Preparing Video For Download...