使用 Folium

在 Python 視覺化地理空間資料

Mary van Valkenburg

Data Science Program Manager, Nashville Software School

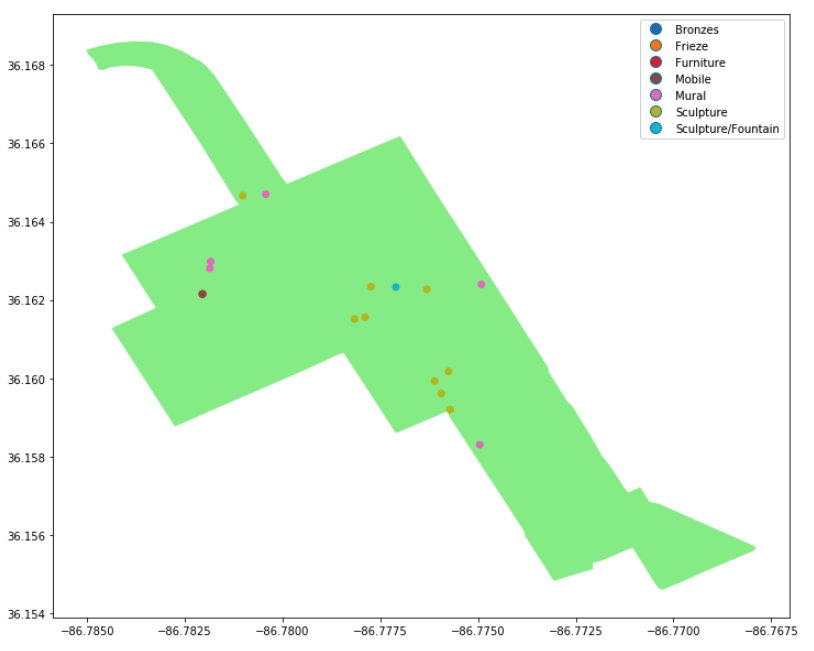
淡綠多邊形與藝術地點點位的圖

在 Python 視覺化地理空間資料

Folium

  • Python 套件
  • 互動地圖
  • 建構於 Leaflet.js 之上

folium 樹葉標誌

在 Python 視覺化地理空間資料

folium.Map()

import folium
# construct a map centered at the Eiffel Tower
eiffel_tower = folium.Map(location = [48.8583736,2.2922926])

# display the map
display(eiffel_tower)
在 Python 視覺化地理空間資料

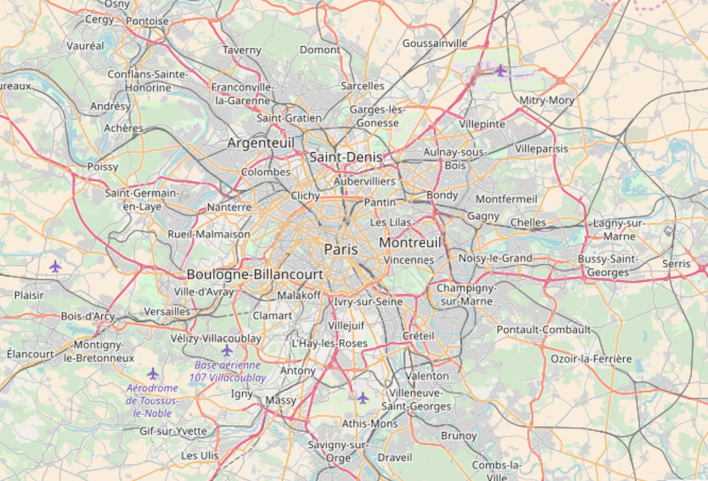
巴黎街道地圖

在 Python 視覺化地理空間資料

設定縮放層級

import folium
# construct a map centered at the Eiffel Tower
eiffel_tower = folium.Map([location = 48.8583736,2.2922926], zoom_start = 12)

# display the map
display(eiffel_tower)
在 Python 視覺化地理空間資料

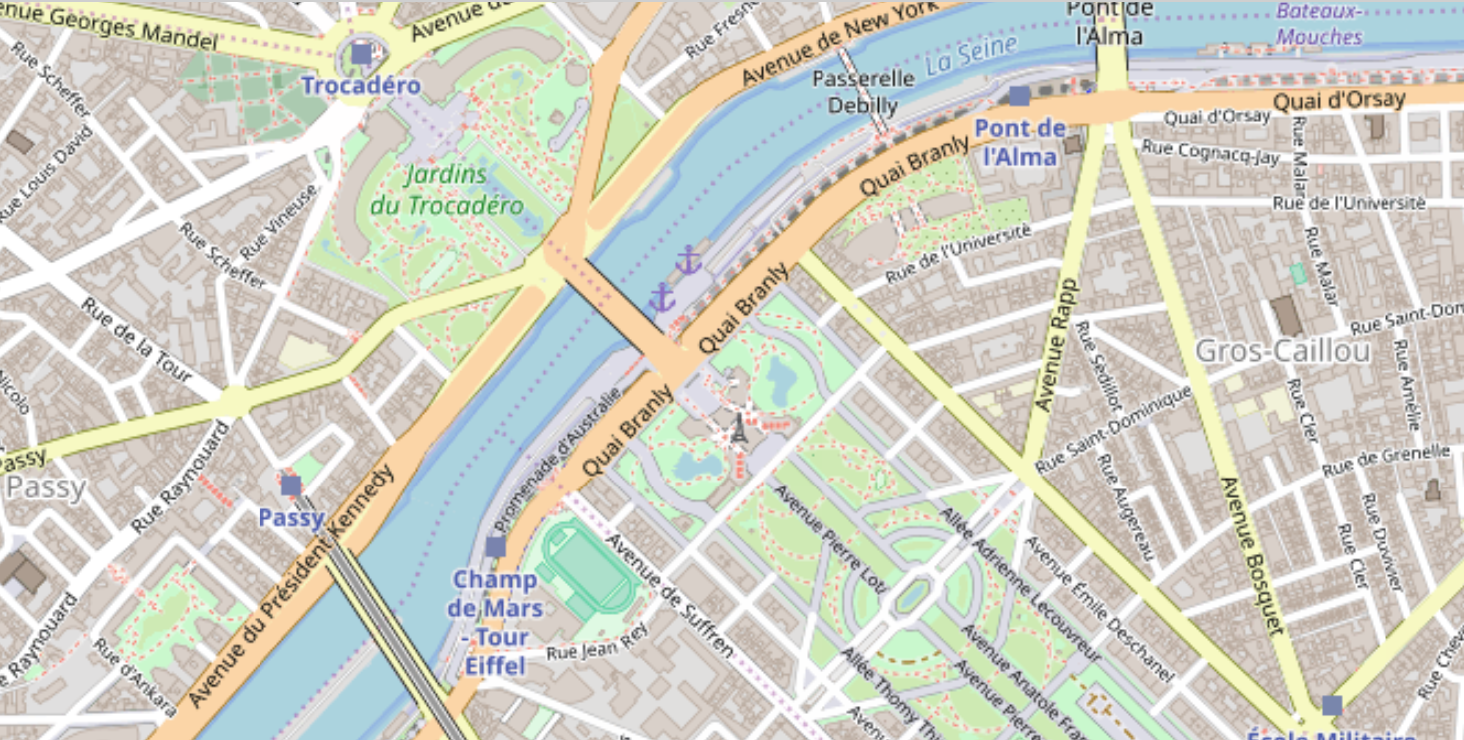
放大後的巴黎街道地圖與小小的艾菲爾鐵塔

在 Python 視覺化地理空間資料

由幾何重心建立 Folium 位置

district_one.head()
district  center                   geometry
1         POINT (-86.860 36.262)   (POLYGON ((-86.771 36.383...    
center_point = district_one.center[0]
type(center_point)
<class 'shapely.geometry.point.Point'>
在 Python 視覺化地理空間資料

由幾何重心建立 Folium 位置

# reverse the order for folium location array
district_center = [center_point.y, center_point.x]

# print center point and district_center
print(center_point)
print(district_center)
POINT (-86.86086595994405 36.2628221811899)
[36.262822181189904, -86.86086595994405]
在 Python 視覺化地理空間資料

在 folium 地圖上加入多邊形

# create a folium map centered on district 1
district1_map = folium.Map(location = district_center)
# add the outline of district one
folium.GeoJson(district_one.geometry).add_to(district1_map)
# display the resulting map
display(district1_map)
在 Python 視覺化地理空間資料

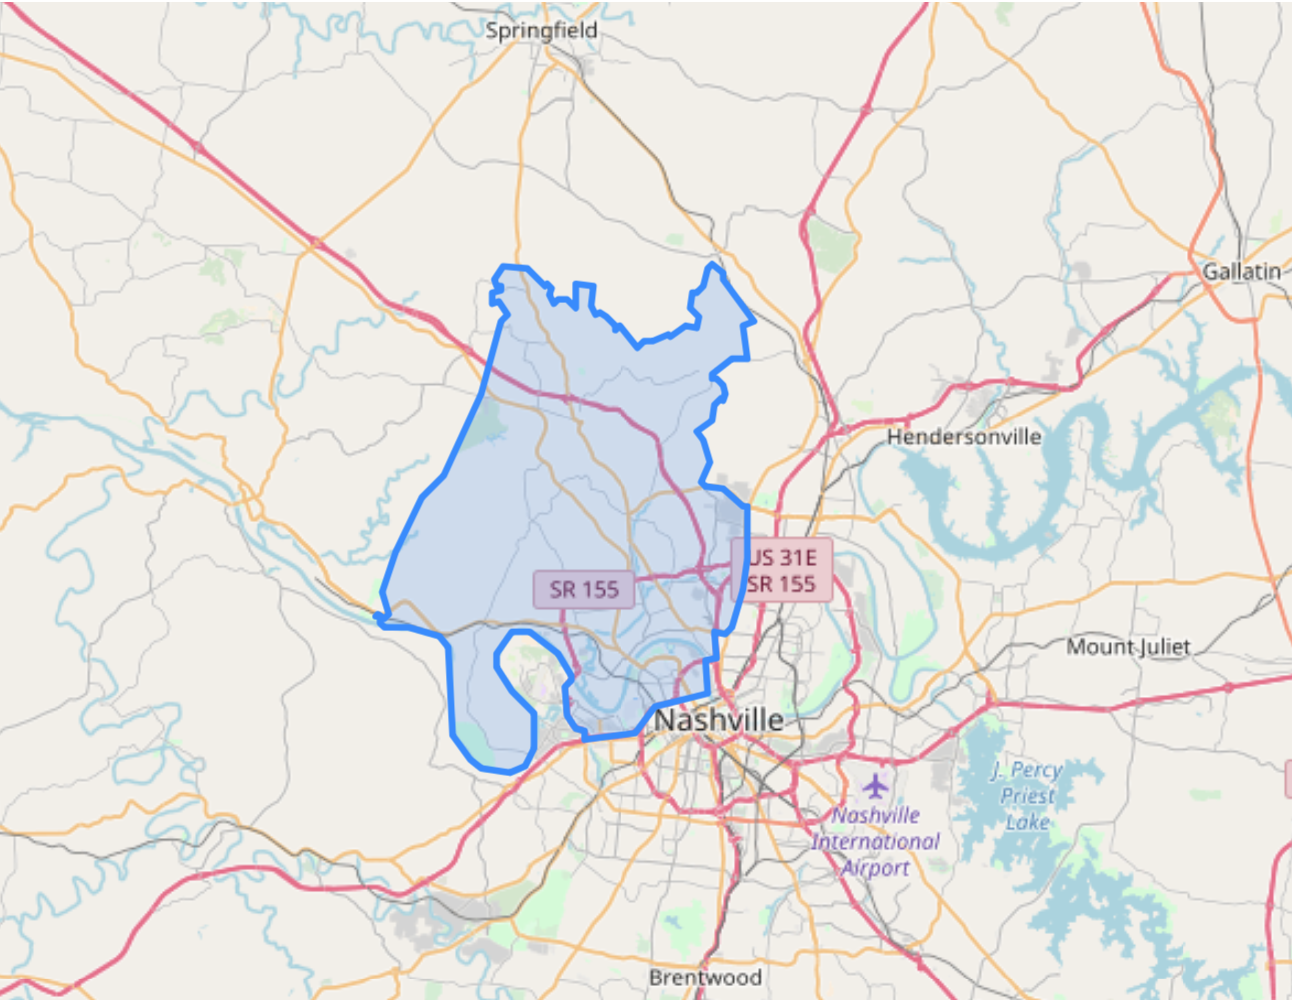
帶藍色多邊形的地圖

在 Python 視覺化地理空間資料

一起來練習吧!

在 Python 視覺化地理空間資料

Preparing Video For Download...