使用 GeoJSON 繪圖

在 Python 視覺化地理空間資料

Mary van Valkenburg

Data Science Program Manager, Nashville Software School

社區 GeoJSON

{ "type": "FeatureCollection",
  "features": [
    { "type":"Feature",
      "properties":{
    "name":"Historic Buena Vista"
    },"geometry":{
        "type":"MultiPolygon","coordinates":[[[[-86.79511056795417,36.17575....
neighborhoods = gpd.read_file('./data/neighborhood_boundaries.geojson')
neighborhoods.head(1)
        name             geometry
Historic Buena Vista    (POLYGON ((-86.79511056795417 36.17575964963348...)))
在 Python 視覺化地理空間資料

Geopandas 相依套件

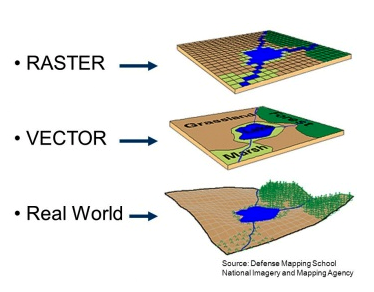
柵格與向量的表示

  • Fiona
    • 提供 OGR 的 Python API
  • GDAL/OGR
    • GDAL:轉換柵格資料
    • OGR:轉換向量資料
在 Python 視覺化地理空間資料

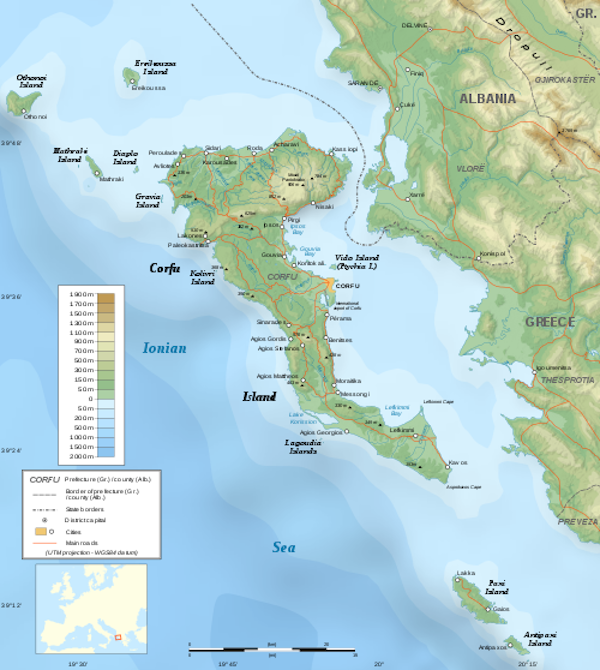
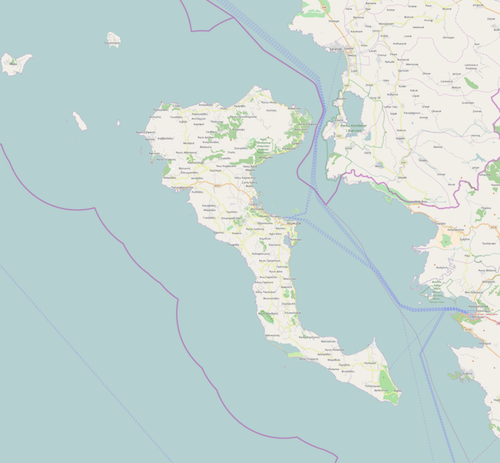
柵格 vs 向量圖形

科孚島的柵格影像 科孚島的柵格影像

科孚島的向量影像 科孚島的向量影像

在 Python 視覺化地理空間資料

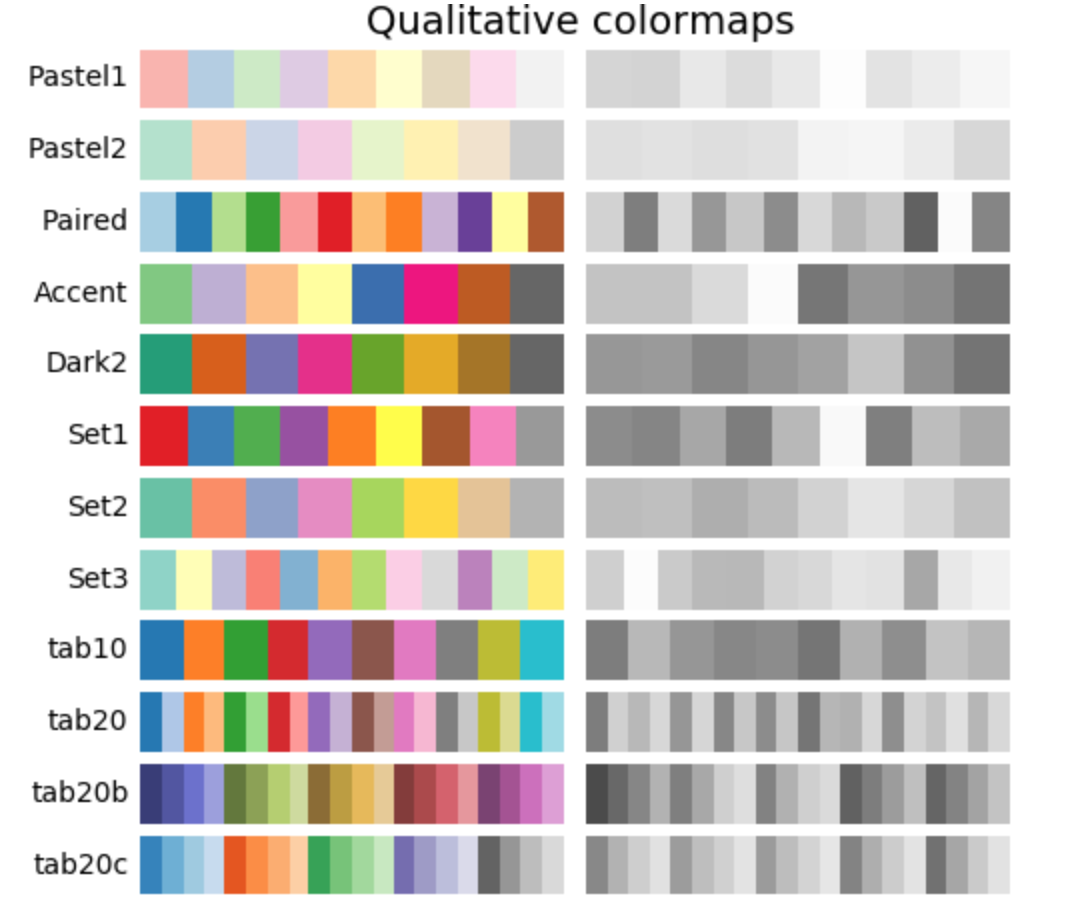
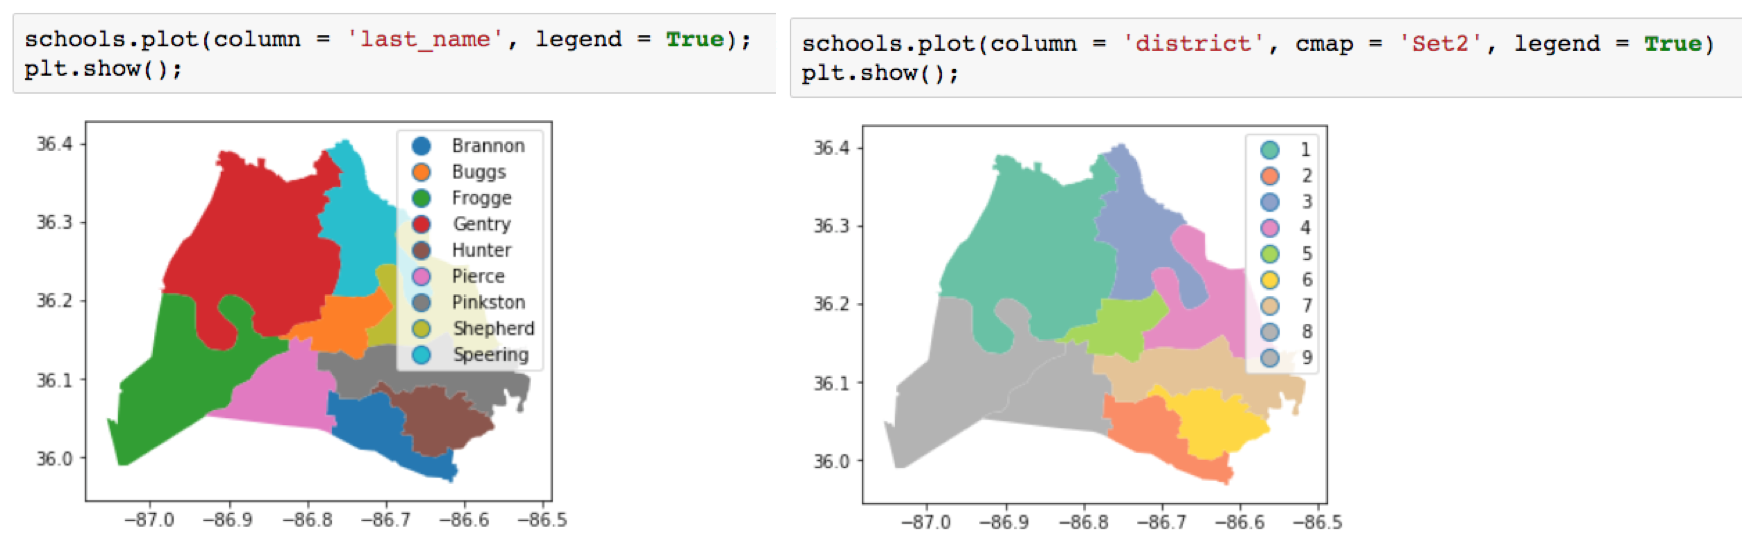
色階(Colormaps)

在 Python 視覺化地理空間資料

搭配色彩繪圖

school_districts.head(3)
first_name     last_name    position    district      geometry
Sharon         Gentry       Member       1    (POLYGON ((-86.771 36.383)...))
Jill           Speering     Vice-Chair   3    (POLYGON ((-86.753 36.404)...))
Jo Ann         Brannon      Member       2    (POLYGON ((-86.766 36.083)...))

色階比較

在 Python 視覺化地理空間資料
council_dists.plot(
                   column='district', 
                   cmap='Set3', 
                   legend=True)
plt.title('Council Districts')
plt.show();
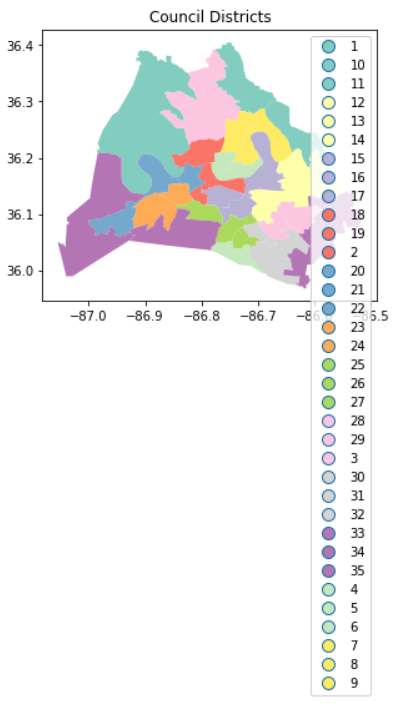
含長型圖例的議會選區圖

leg_kwds={'title':'District Number', 
          'loc': 'upper left', 
          'bbox_to_anchor':(1, 1.03), 
          'ncol':3}
council_dists.plot(column='district', 
                   cmap='Set3',
                   legend=True, 
             legend_kwds=leg_kwds)
plt.title('Council Districts')
plt.show();
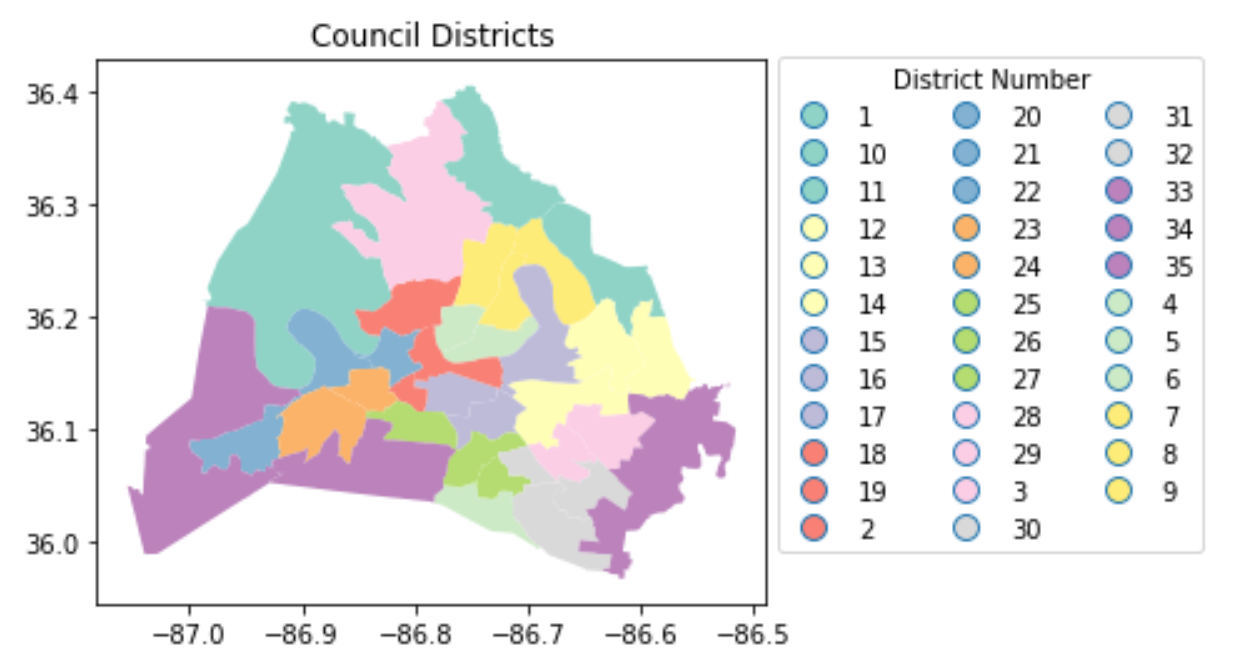
含多欄圖例的議會選區圖

在 Python 視覺化地理空間資料

一起來練習吧!

在 Python 視覺化地理空間資料

Preparing Video For Download...