從 Plotly 到 Dash
使用 Dash 與 Plotly 建立儀表板

Alex Scriven
Data Scientist
我們的應用
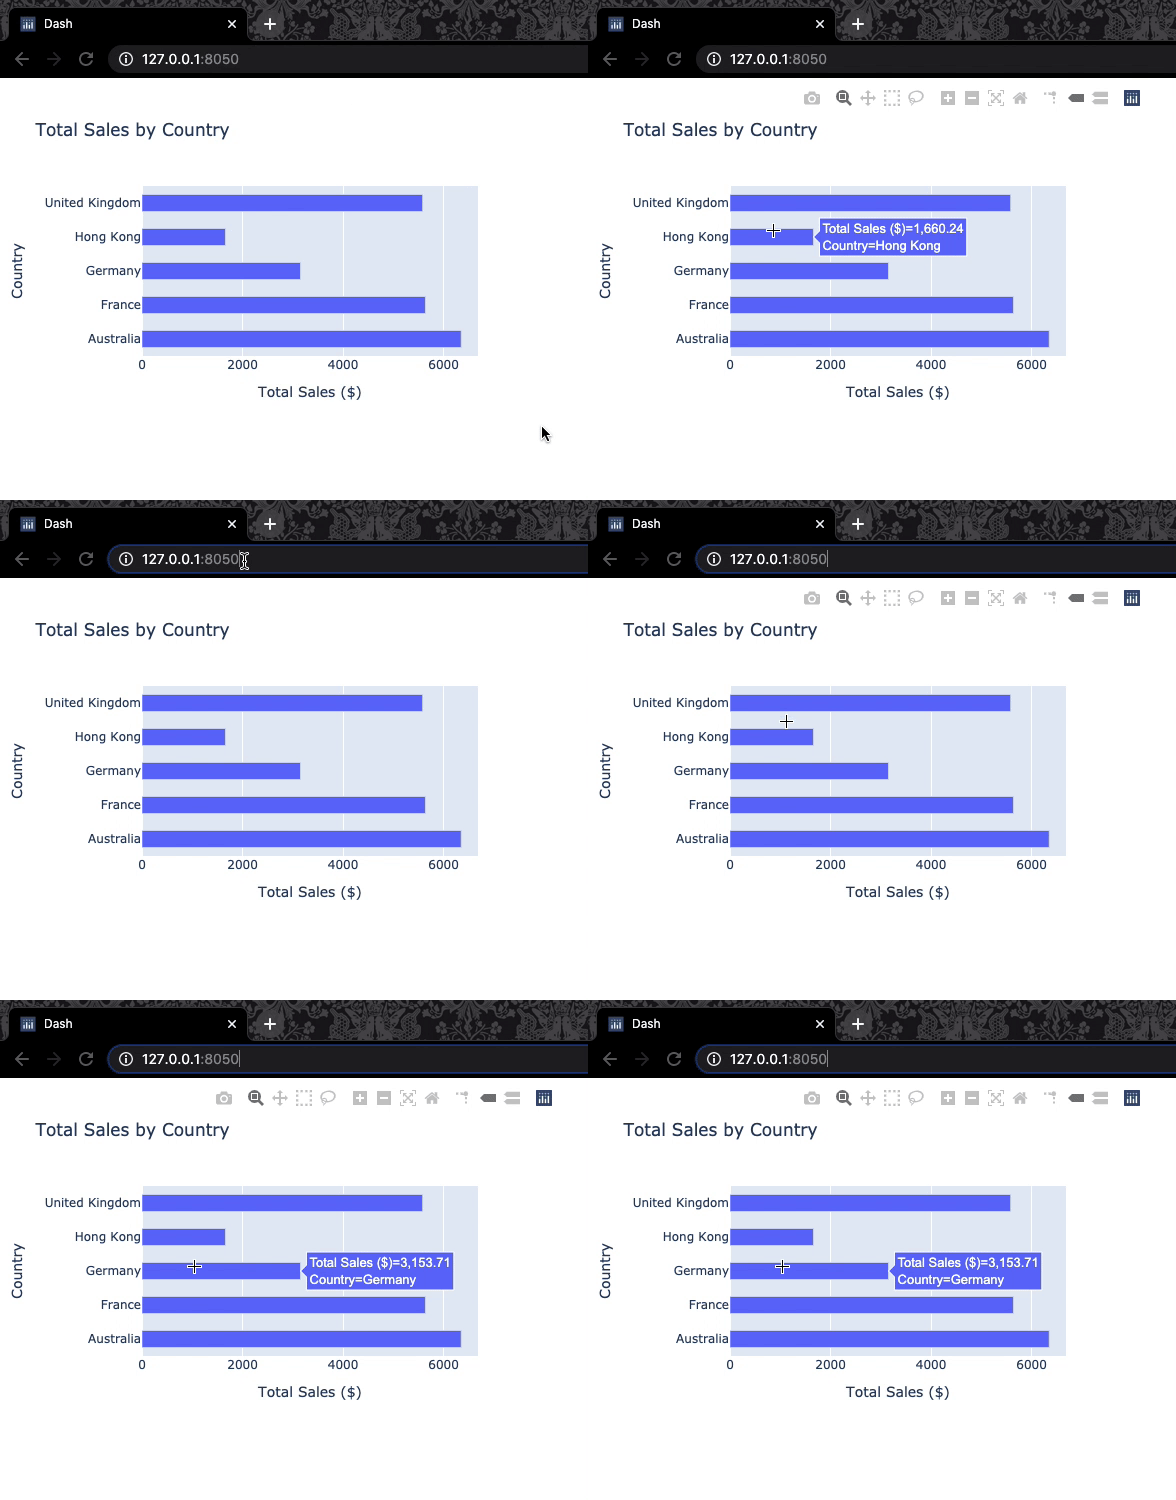
透過瀏覽器(如 Google Chrome)存取
服務啟動中,更新並儲存
.py檔即可在瀏覽器即時看到變更

瀏覽器中的應用
在 DataCamp 使用 Dash
- 與其他 DataCamp 練習的差異:
- 練習頂端有設定程式碼
- 一次全部執行(非逐行)
- 程式碼更長
- 完整可用的儀表板(展開視窗即可查看)

使用 Dash 與 Plotly 建立儀表板
Alex Scriven
Data Scientist
透過瀏覽器(如 Google Chrome)存取
服務啟動中,更新並儲存 .py 檔即可在瀏覽器即時看到變更

