你的第一個 shinydashboard

使用 shinydashboard 建立儀表板

Png Kee Seng

Researcher

到目前為止

  • 規劃使用者介面(UI)線框
    • 標頭、側邊欄、主體
  • 定義輸出,以及它們與使用者輸入的互動
  • server 會負責這個角色

插圖

header <- dashboardHeader(...)
sidebar <- dashboardSidebar(...)
body <- dashboardBody(...)

ui <- dashboardPage(header, sidebar, body)
server <- function(input, output) { ... }
shinyApp(ui, server)
使用 shinydashboard 建立儀表板

server

  • 需要定義輸出與輸入
  • 指定輸出,以及與使用者輸入的互動方式
  • 定義自訂協助函式可減少雜訊、提升可讀性
    • 將這些協助函式放在程式碼最上方

server 就像把你的指示傳達到廚房的貼心服務生。在 shinyApp 的 server 中,告訴 R 輸入該如何與輸出互動。

使用 shinydashboard 建立儀表板

加入圖表

  • 回到全球足球錦標儀表板
  • 加入 team 1 的 hexbin 圖
  • 接著把這個圖放進 server
  • 若也想要 team 2 的同款圖呢?
soccer %>%
  ggplot(aes(x=`1_passes_compeletd`, 
             y=`1_goal_prevented`)) +
  geom_hex(bins=10) + theme_classic()
server <- function(input, output){
  output$plot1 <- renderPlot({
  fifa %>%
    ggplot(aes(x=`1_passes_compeletd`, 
               y=`1_goal_prevented`)) +
    geom_hex(bins=10) + theme_classic()
  })
}
使用 shinydashboard 建立儀表板

在 server 內定義 ggplot 物件

server <- function(input, output) {
  output$plot1 <- renderPlot({
    if (input$team == 1){

fifa %>% ggplot(aes(x=`1_passes_compeletd`, y=`1_goal_prevented`)) + geom_hex(bins=10) + theme_classic()
} else if (input$team == 2){
fifa %>% ggplot(aes(x=`2_passes_compeletd`, y=`2_goal_prevented`)) + geom_hex(bins=10) + theme_classic()
} }) }
使用 shinydashboard 建立儀表板

使用協助函式

plot_hex <- function(team){
  if (team == 1){
    soccer %>% ggplot(aes(x=`1_passes_compeletd`, 
                        y=`1_goal_prevented`)) +
      geom_hex(bins=10) + theme_classic()
  }
  else if (team == 2){
    soccer %>% ggplot(aes(x=`2_passes_compeletd`, 
                        y=`2_goal_prevented`)) +
      geom_hex(bins=10) + theme_classic()
  }
}
使用 shinydashboard 建立儀表板

使用協助函式

使用協助函式

server <- function(input, output) {
  output$plot1 <- renderPlot(plot_hex(input$team)) 
}
  • 這樣是否更易讀?

未使用協助函式

server <- function(input, output) {
  output$plot1 <- renderPlot({
    if (input$team == 1){
      soccer %>% ggplot(aes(x=`1_passes_compeletd`, 
              y=`1_goal_prevented`)) +
        geom_hex(bins=10) + theme_classic()
      }
    else if (input$team == 2){
      soccer %>% ggplot(aes(x=`2_passes_compeletd`, 
              y=`2_goal_prevented`)) +
        geom_hex(bins=10) + theme_classic()
      }
    })
}
使用 shinydashboard 建立儀表板

整合全部元件

# A complete shinydashboard

header <- dashboardHeader(title = "Soccer tournament")
sidebar <- dashboardSidebar(sidebarMenu(menuItem("Passes/goals", tabName = "passtab"), menuItem("Empty", tabName = "emptytab")))
body <- dashboardBody(tabItems( tabItem("passtab", fluidRow(box(selectInput("team", "Team number", choices = c(1,2))), box(plotOutput("plot1"))) ), tabItem("emptytab")) )
ui <- dashboardPage(header, sidebar, body)
server <- function(input, output) { output$plot1 <- renderPlot(plot_hex(input$team)) }
shinyApp(ui, server)
使用 shinydashboard 建立儀表板

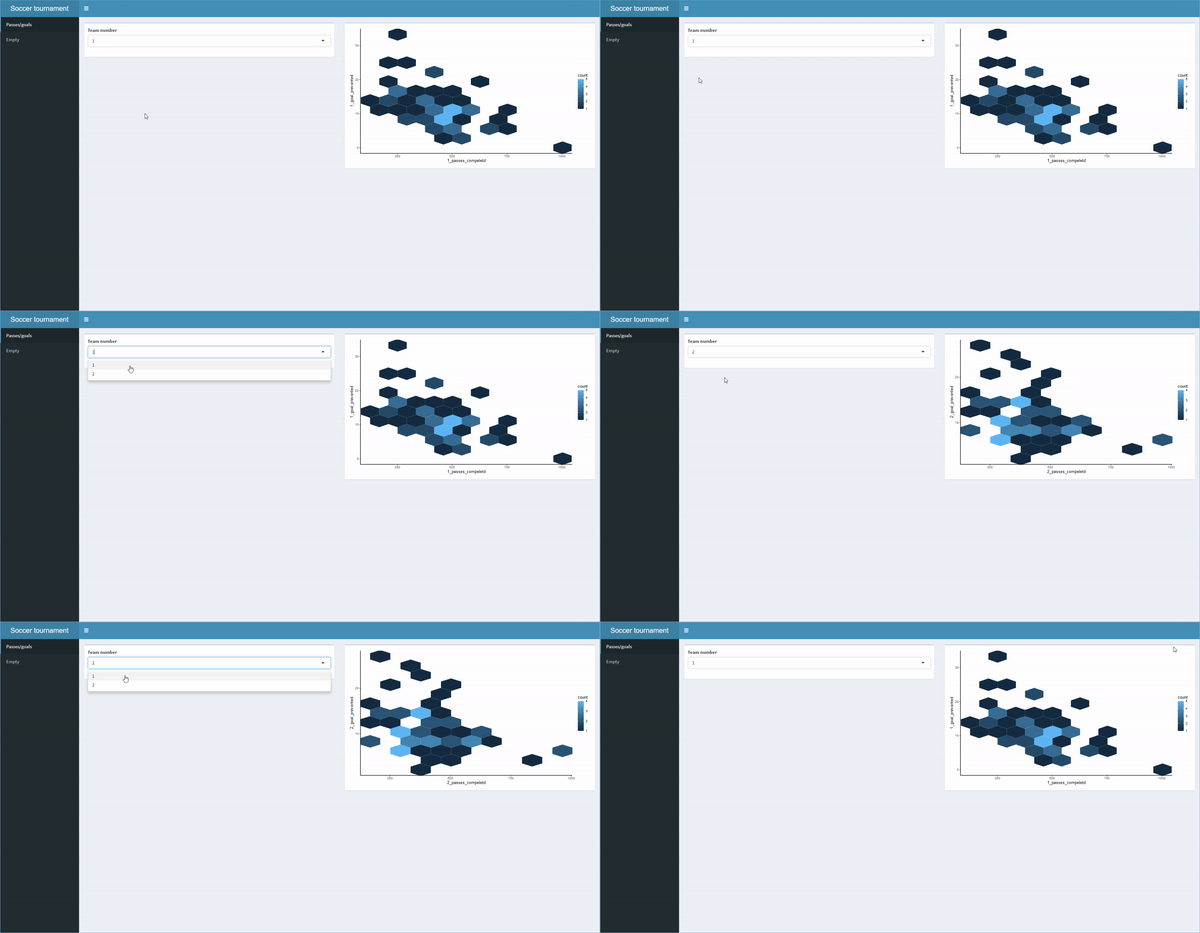
一段動畫展示完成後的 shinydashboard。使用者可在不同頁面或分頁間切換,並輸入以獲得不同輸出。

使用 shinydashboard 建立儀表板

一起來練習吧!

使用 shinydashboard 建立儀表板

Preparing Video For Download...