shinydashboard 中的互動元件

使用 shinydashboard 建立儀表板

Png Kee Seng

Researcher

情境

  • 我們在倫敦的旅遊代理商工作。

  • 觀光客需要住宿。

  • 我們能怎麼幫忙?

倫敦圖示

  • 價格區間內的房源數量
  • 私人房間比例
  • 平均價格
  • 一些圖表
  • 一個資料表
  • 倫敦地圖
1 Image by Freepik
使用 shinydashboard 建立儀表板

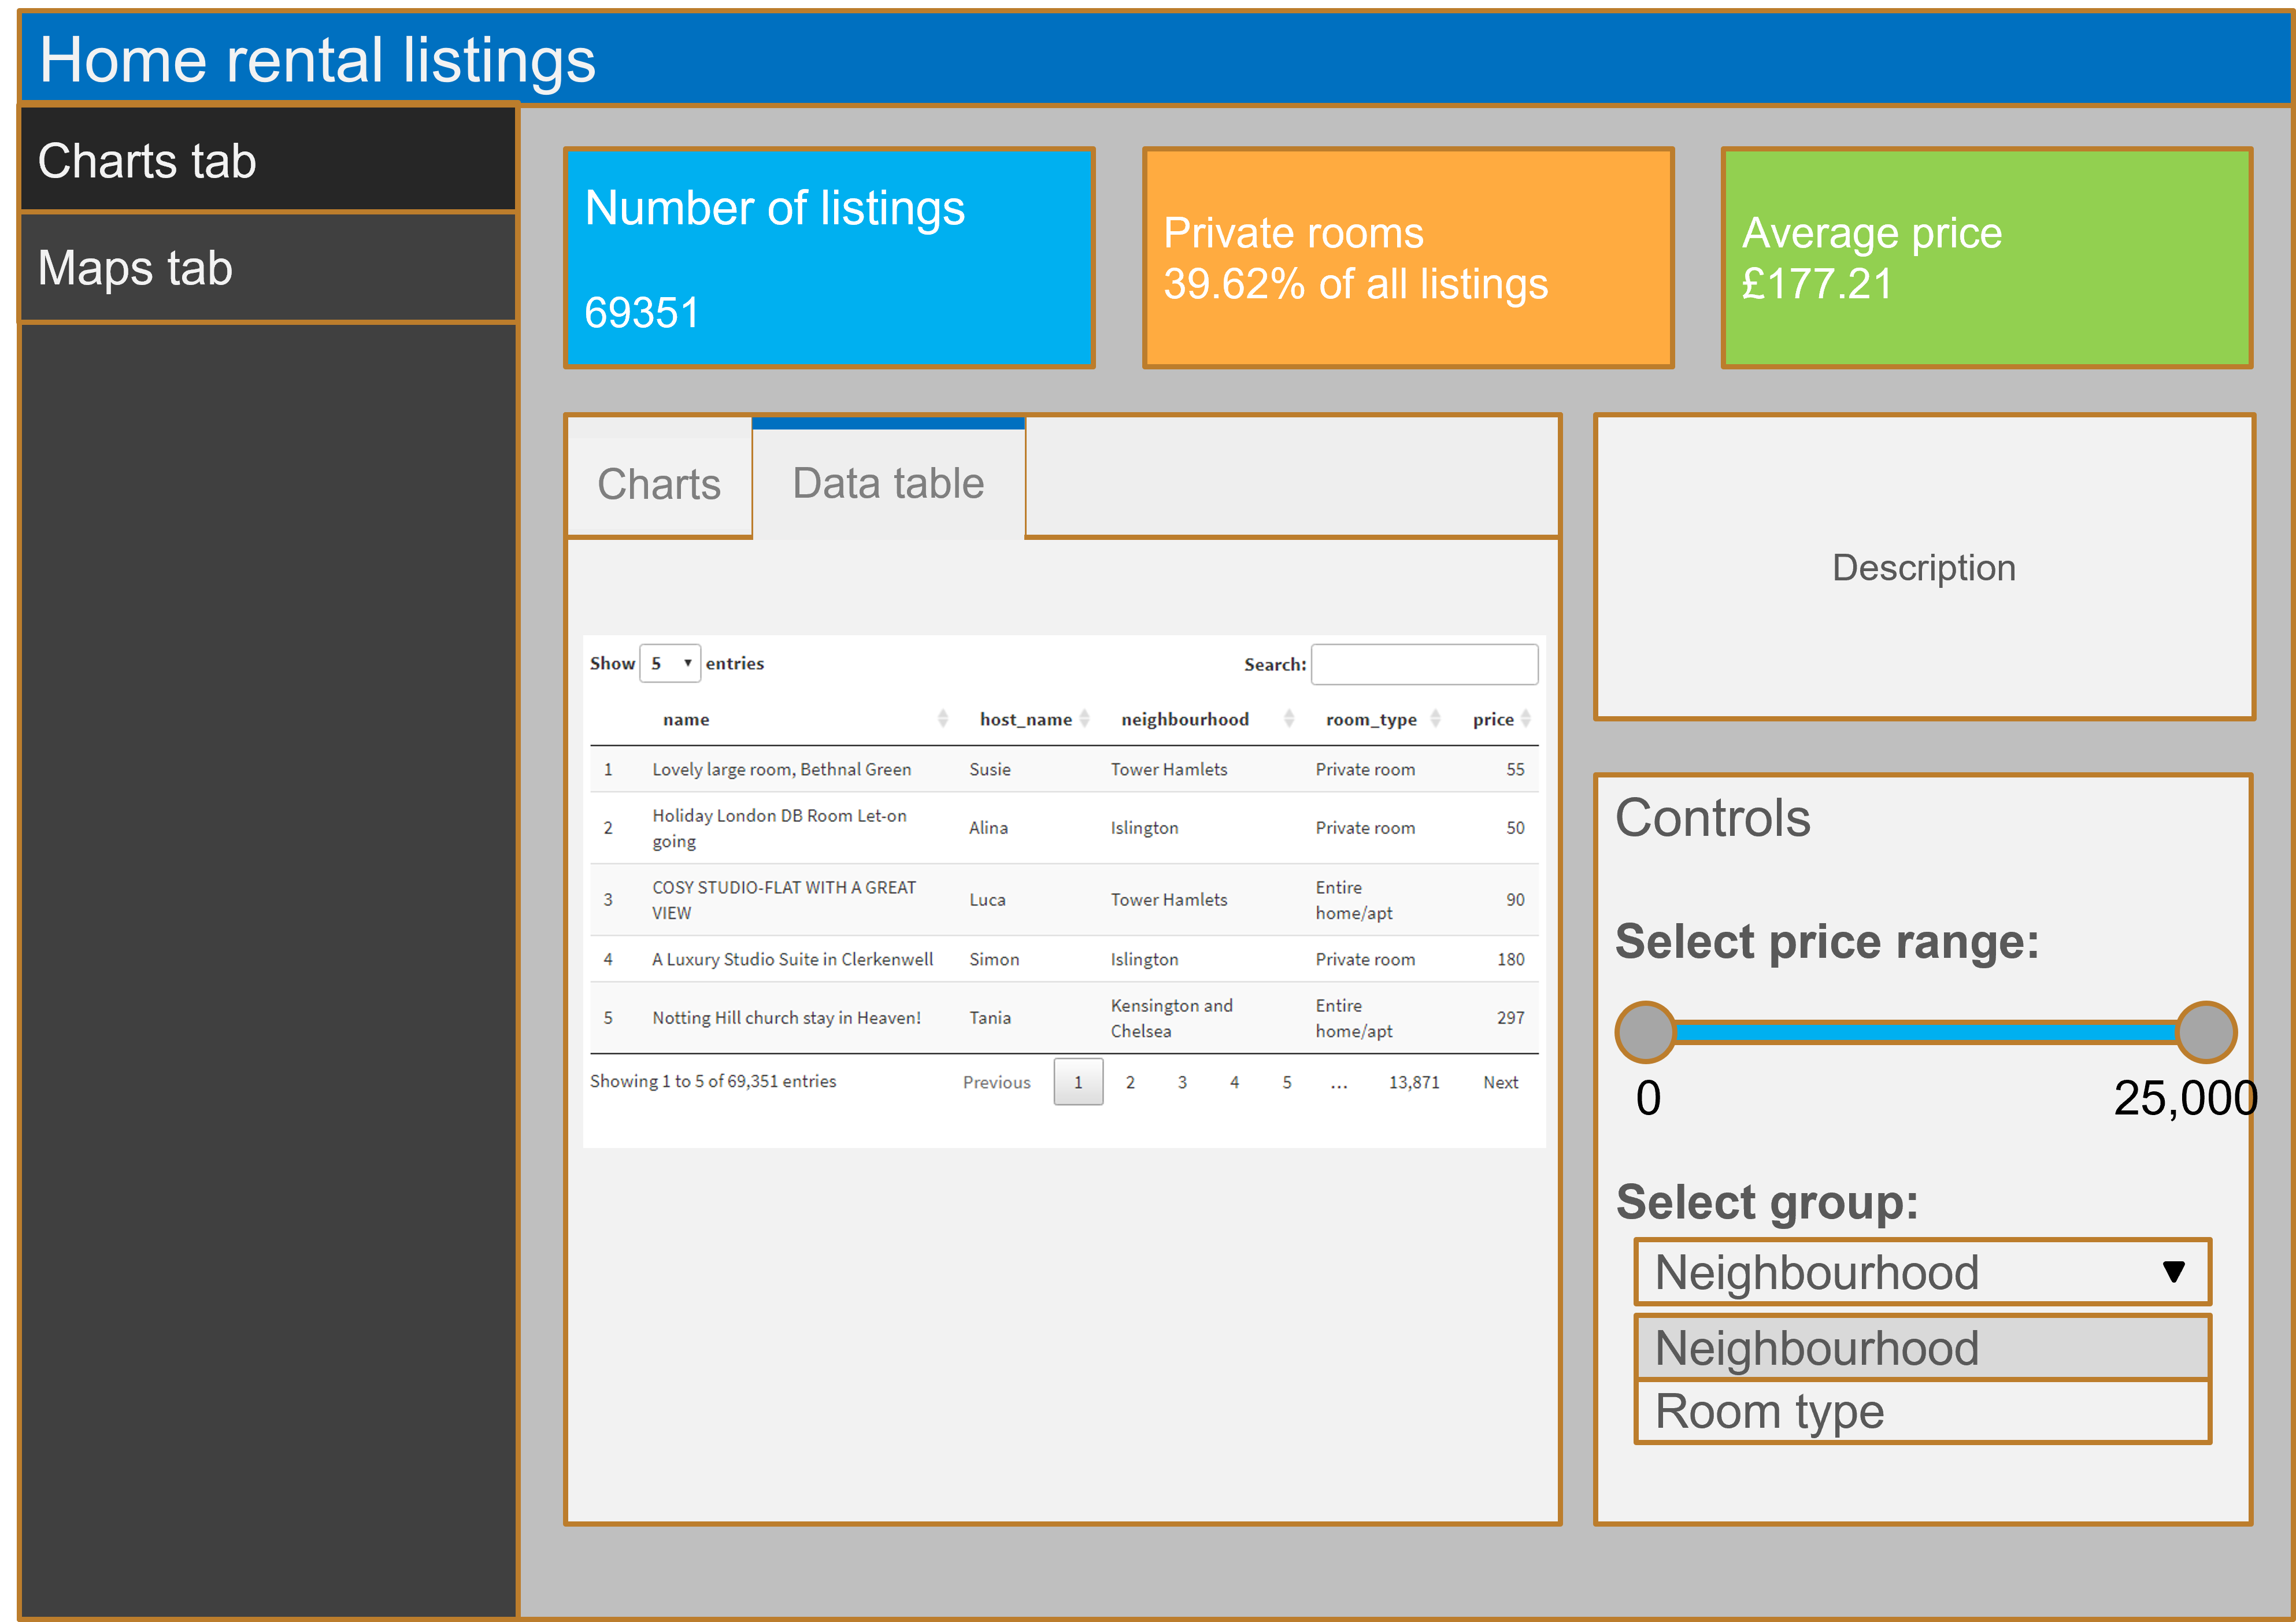
儀表板草圖

儀表板的草圖。

使用 shinydashboard 建立儀表板

建立儀表板:設定框架

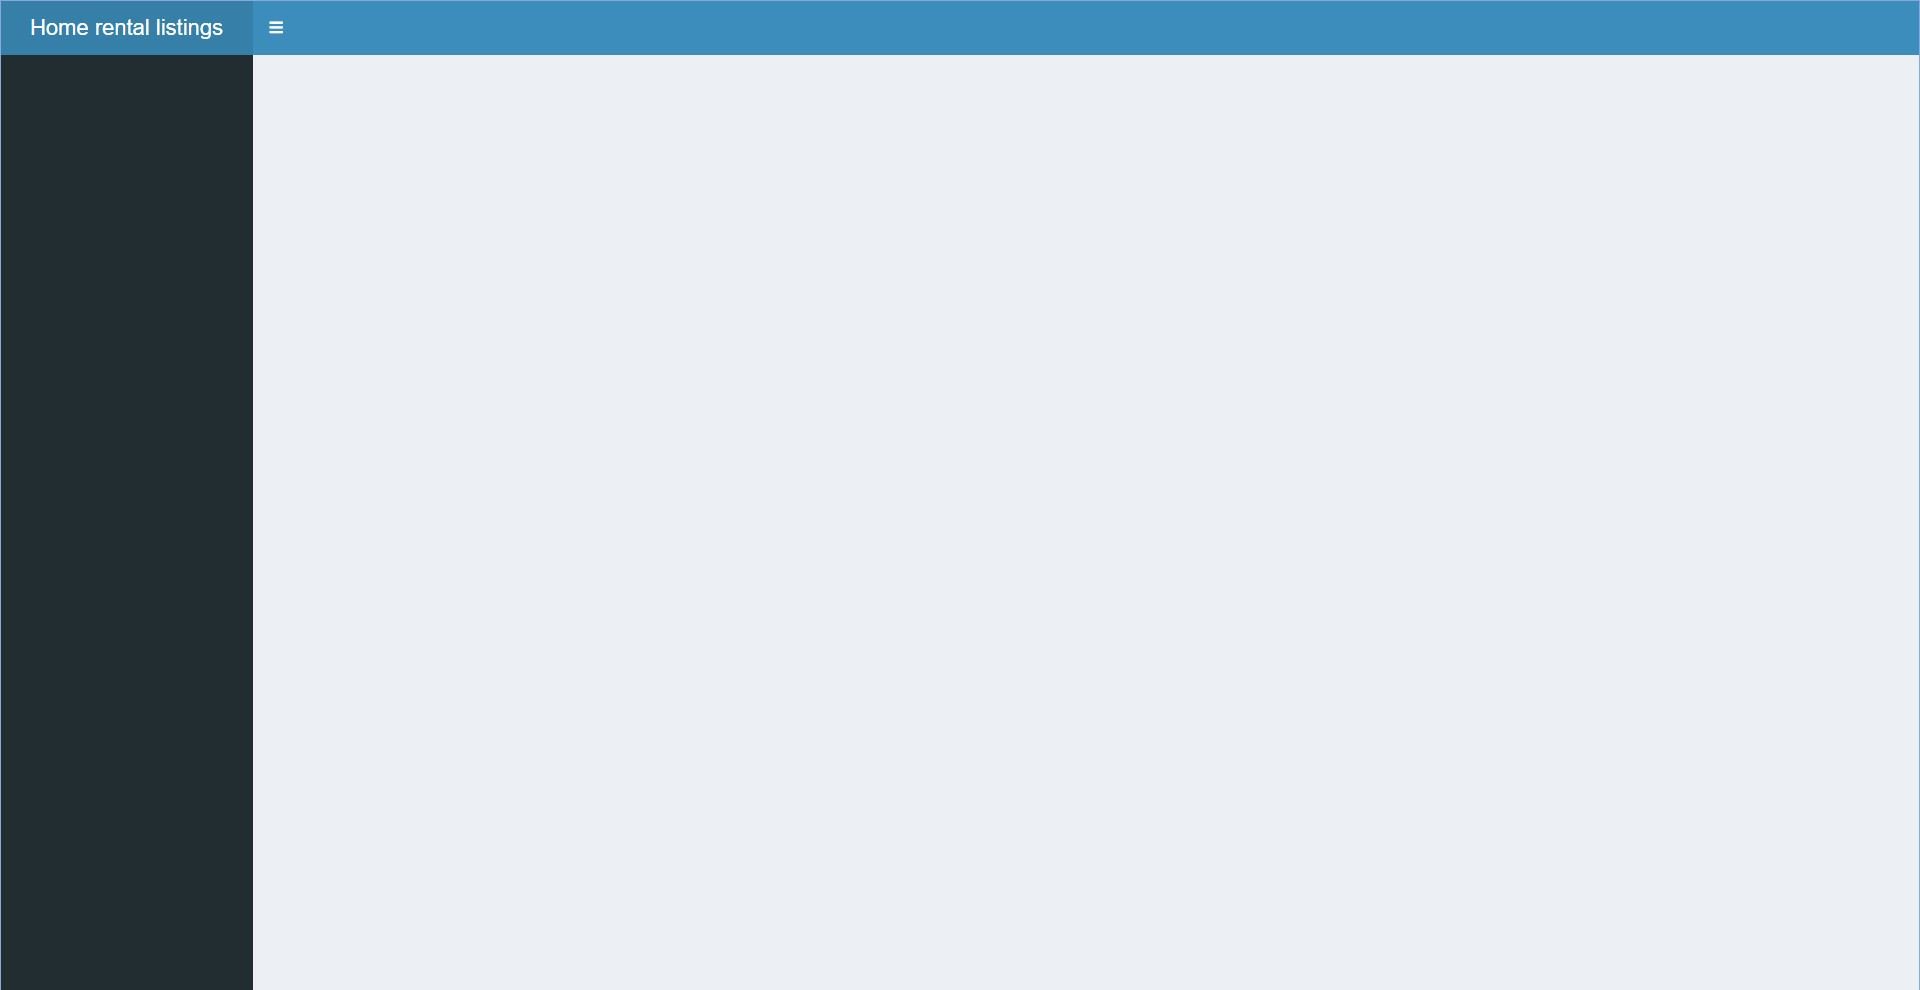
先建立空的 shinydashboard 並設定標題與側邊欄按鈕,完成線框。

header <- dashboardHeader(
  title = "Home rental listings")
sidebar <- dashboardSidebar()
body <- dashboardBody()
ui <- dashboardPage(header, 
                    sidebar, 
                    body)
server <- function(input, output) {}
shinyApp(ui, server)
使用 shinydashboard 建立儀表板

建立儀表板:加入 ValueBox

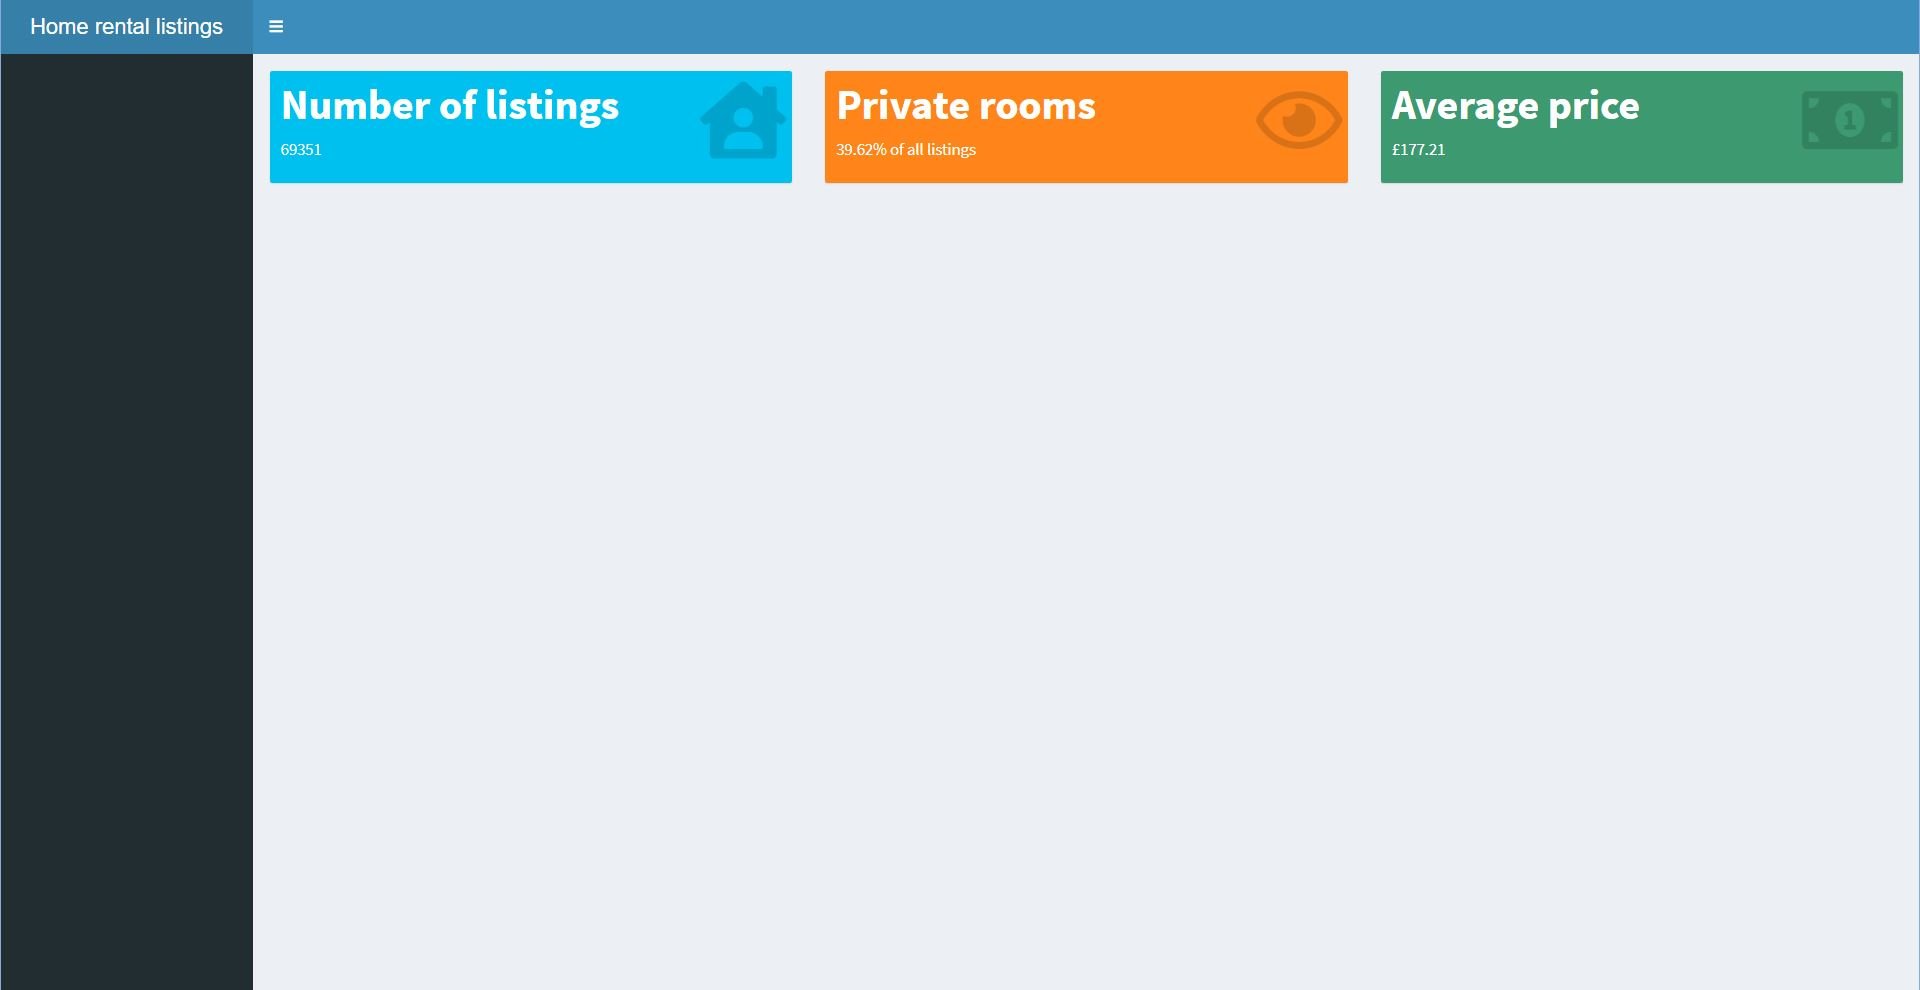
加入 valueBox 作為線框的一部分。

body

fluidRow(
    valueBoxOutput(outputId = "count"),
    valueBoxOutput(outputId = "prop"),
    valueBoxOutput(outputId = "avg"))

server

output$count <- renderValueBox({
    valueBox(..., icon = ...)})
output$prop <- renderValueBox(...)
...
使用 shinydashboard 建立儀表板

建立儀表板:加入控制項

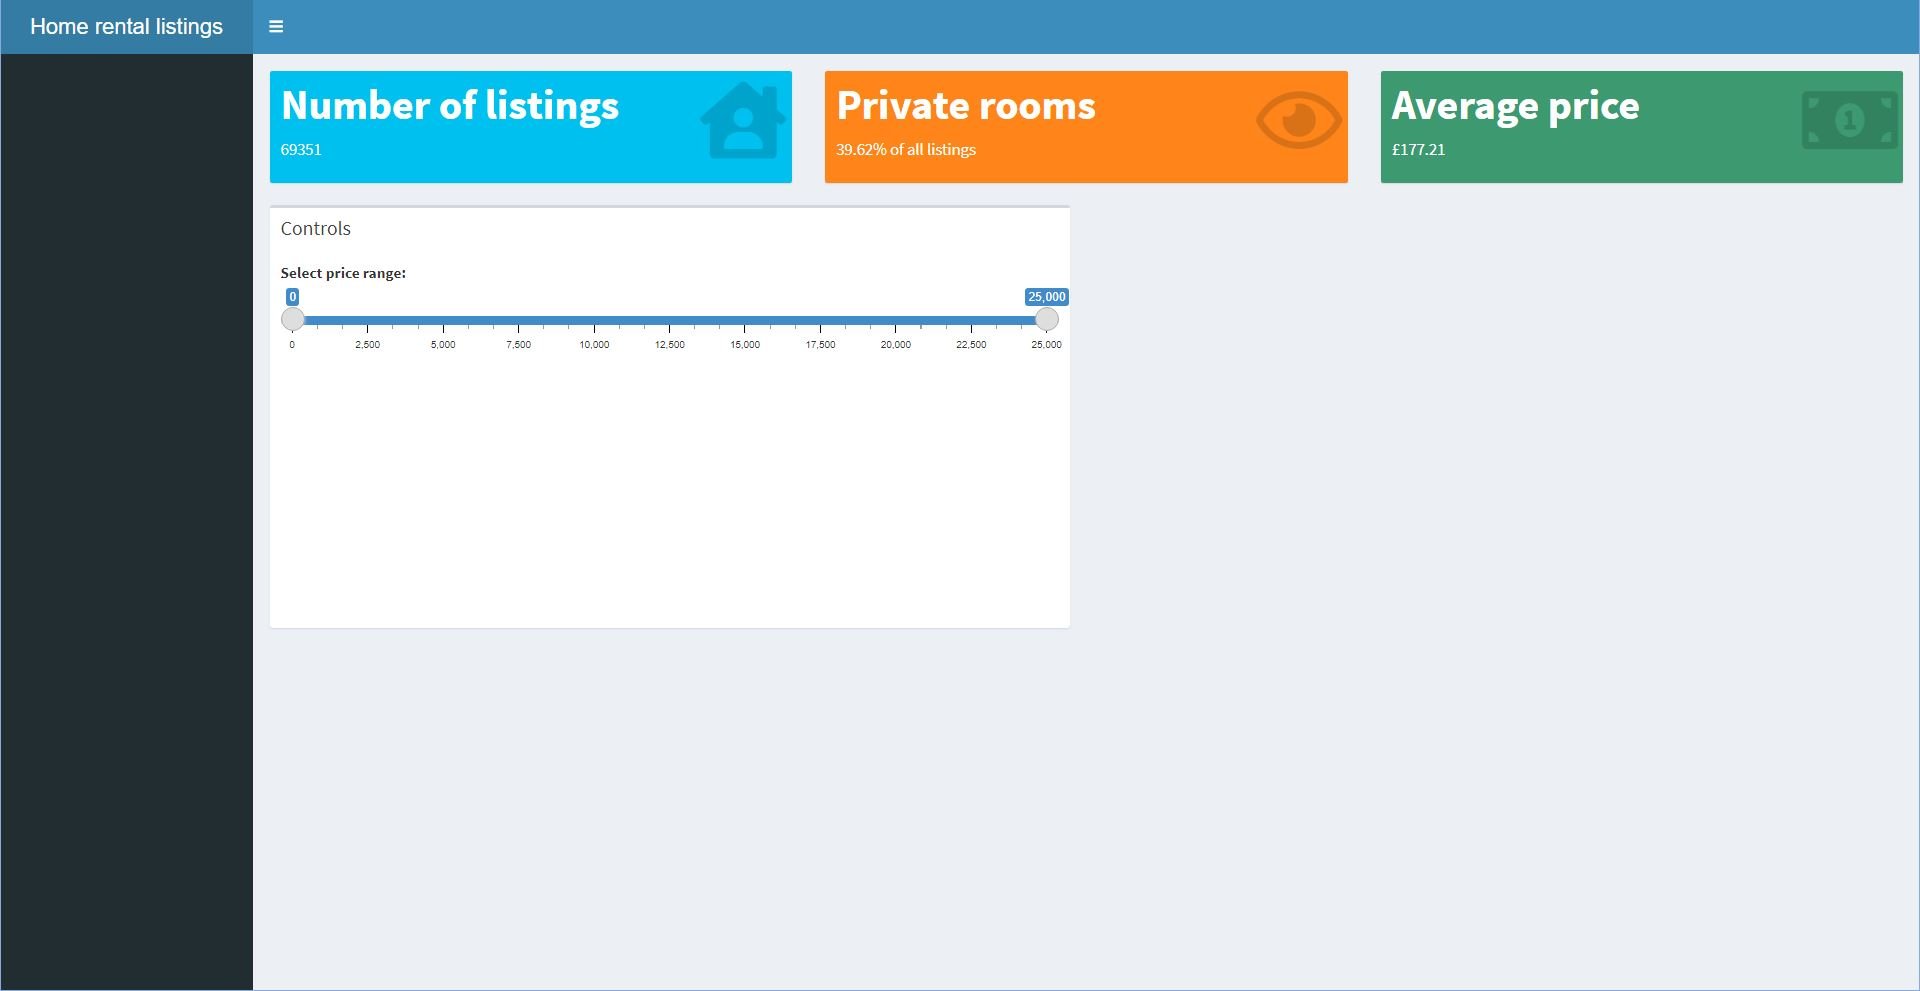
加入輸入元件——提供使用者控制。

body

box(
    side = "right", ...,
    sliderInput(inputId = "range",
        label = "Select price range:",
        min = 0,
        max = 25000,
        value = c(0,25000))
        ))

更新 server,使用 input$range[1]input$range[2]

使用 shinydashboard 建立儀表板

建立儀表板:加入互動式圖表

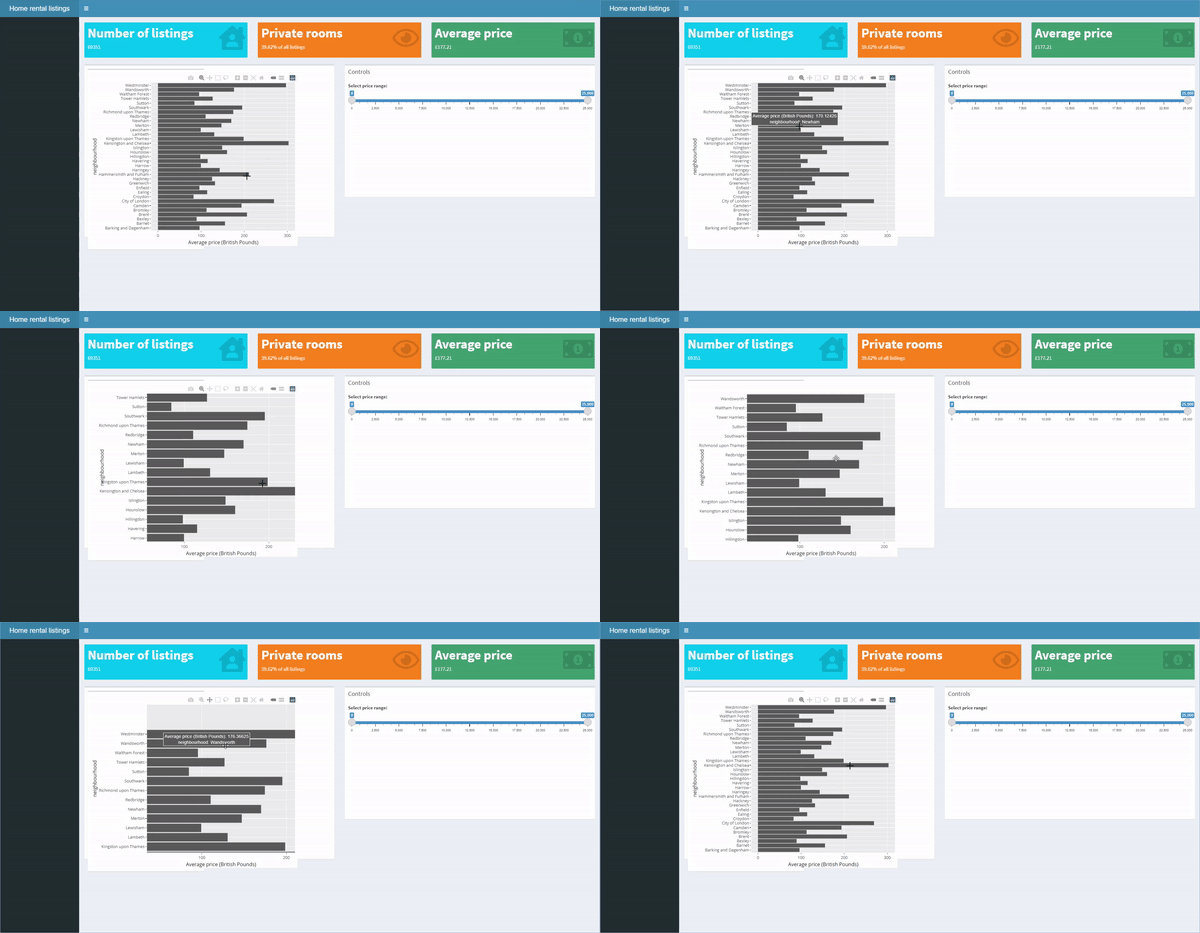
使用 plotly 加入互動式圖表。

body

plotlyOutput("plots", 
    height = 500, 
    width = 600)

server

output$plots <- renderPlotly({
      ...
  })
使用 shinydashboard 建立儀表板

建立儀表板:再加一個圖表

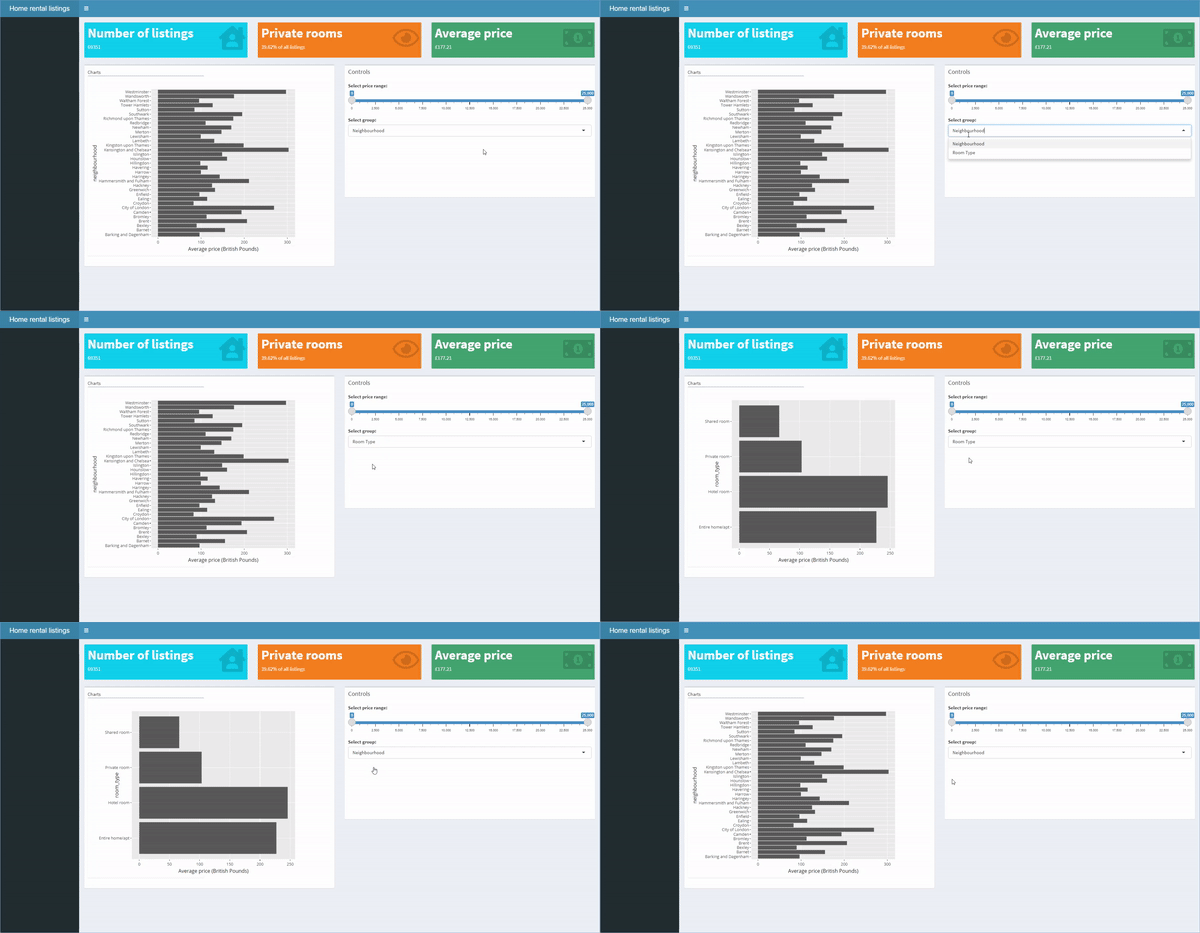
在同一頁面加入第二個圖表,並可用下拉選單切換。

body

selectInput(inputId = "select", 
    label = "Select group:", 
    choices = c("Neighbourhood", 
            "Room Type"))

server

output$plots <- renderPlotly({
    if (input$select == ...){plot1}
    else if(input$select == ...){plot2}
  })
使用 shinydashboard 建立儀表板

建立儀表板:加入說明與分頁標籤

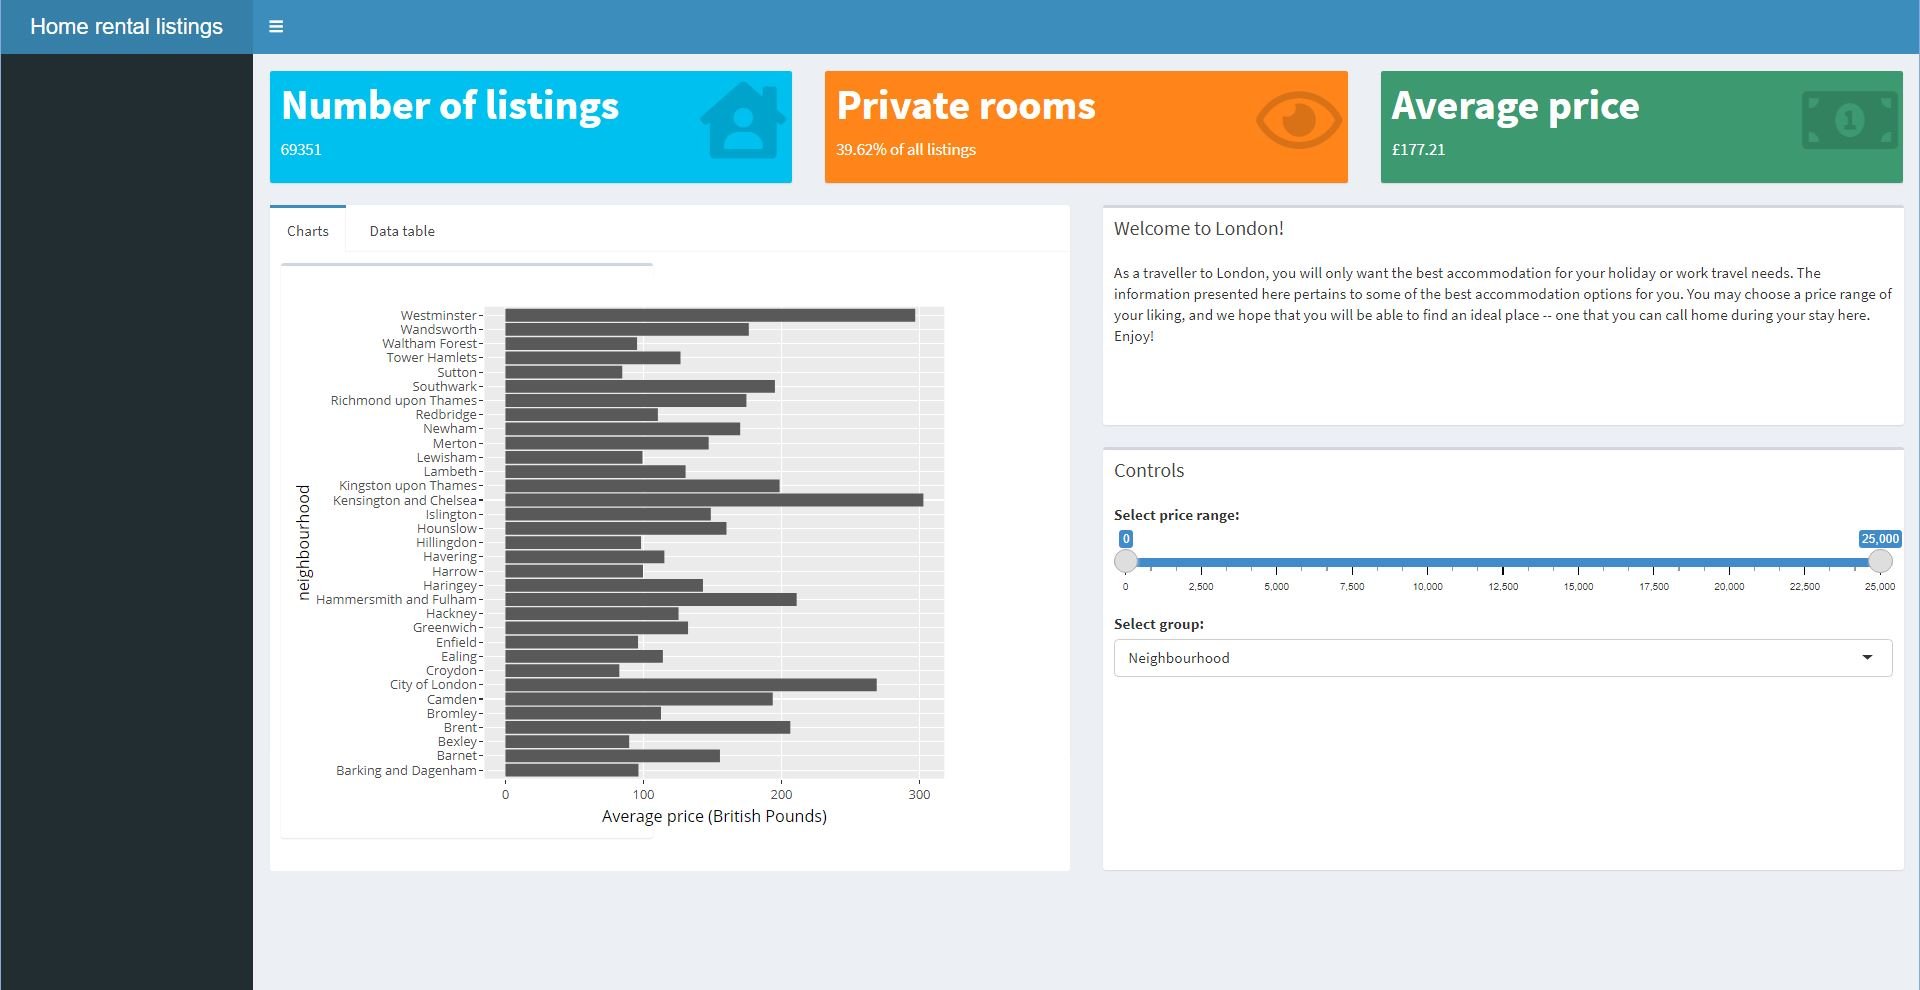
加入說明文字,解釋此儀表板。

body

box(side = "right", ...,
    title = "Welcome to London!", 
    "...")

更新 body

tabBox(id = "tabset", ...,
    tabPanel("Charts", ...),
    tabPanel("Data table", ...)
使用 shinydashboard 建立儀表板

建立儀表板:加入互動式表格

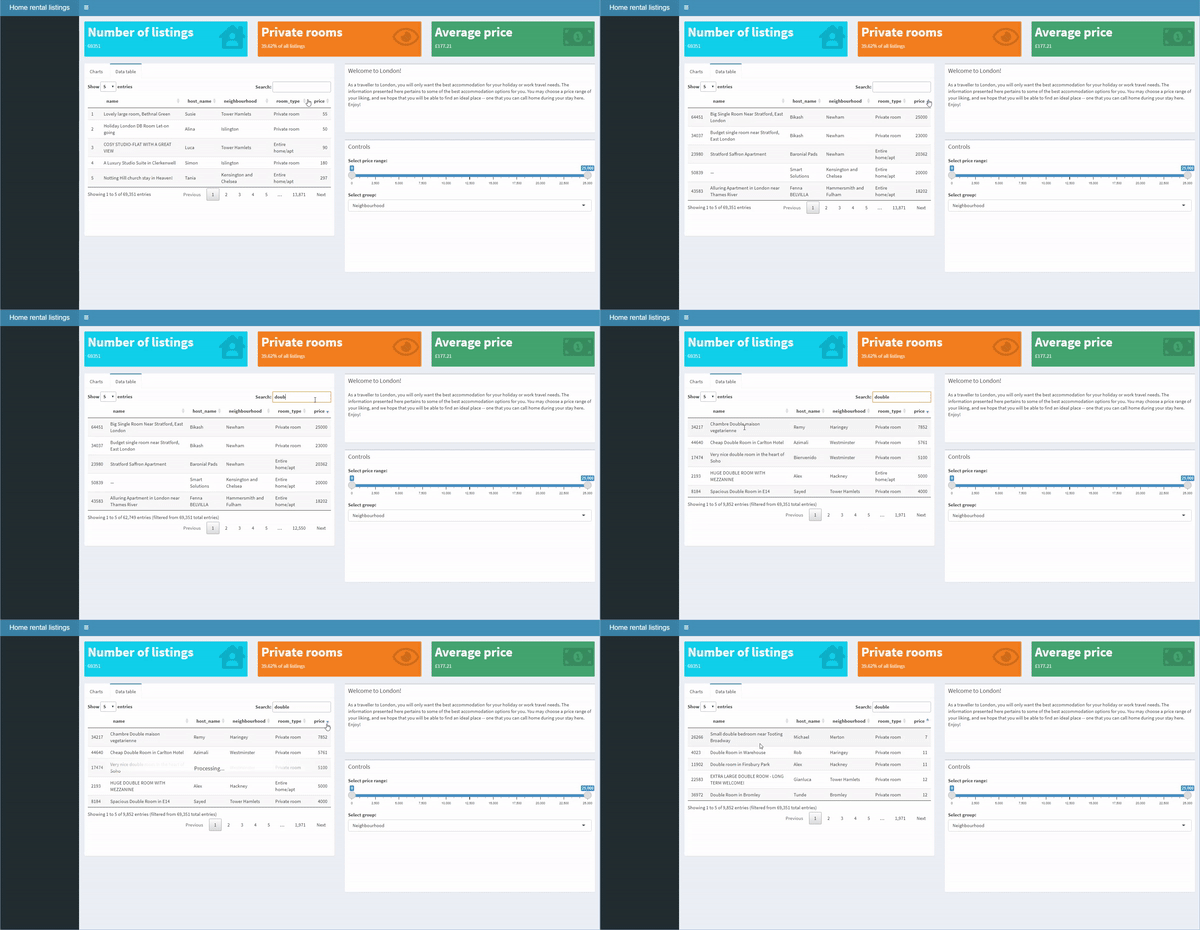
使用 dataTable 函式加入互動式表格。

可以使用 shiny 函式。

body

dataTableOutput("table")

server

output$table <- 
    renderDataTable(listings)
使用 shinydashboard 建立儀表板

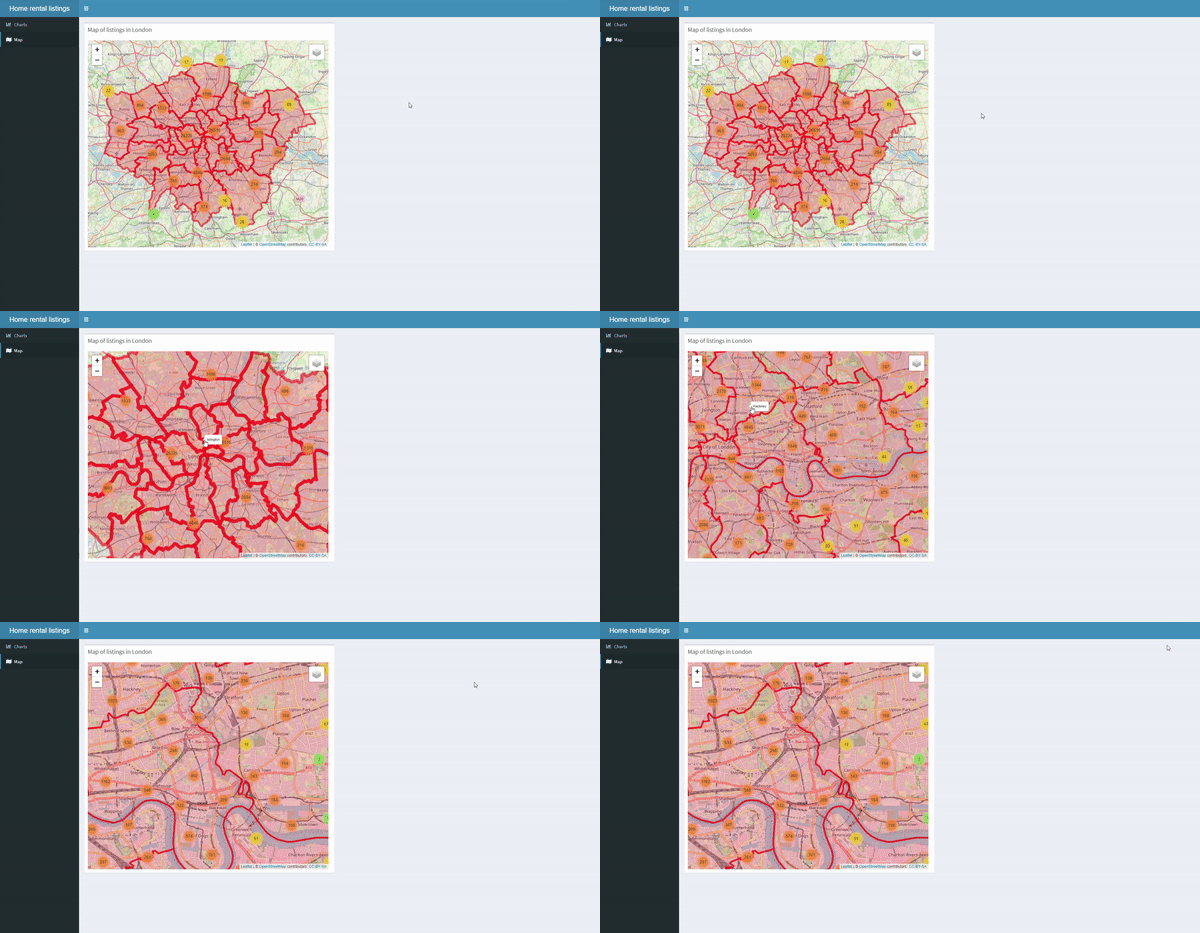
建立儀表板:加入互動式地圖

在儀表板中加入 leaflet 地圖。

sidebar

sidebarMenu(
    menuItem("Charts", ...),
    menuItem("Map", ...))

body

leafletOutput("map",...)

server

output$map <- renderLeaflet(map)
使用 shinydashboard 建立儀表板

一起來練習吧!

使用 shinydashboard 建立儀表板

Preparing Video For Download...