主體

使用 shinydashboard 建立儀表板

Png Kee Seng

Researcher

總覽

  • shinydashboard 的 UI 主體
  • 通常把輸入與輸出放在這裡
    • 好比餐廳的菜餚與點單
    • server 負責溝通
  • 主體由 dashboardBody() 定義,慣例存成 body
body <- dashboardBody(...)
使用 shinydashboard 建立儀表板

線框設計

  • 先做線框規劃
    • 先定結構再放內容
  • 在 shinydashboard 先決定物件位置

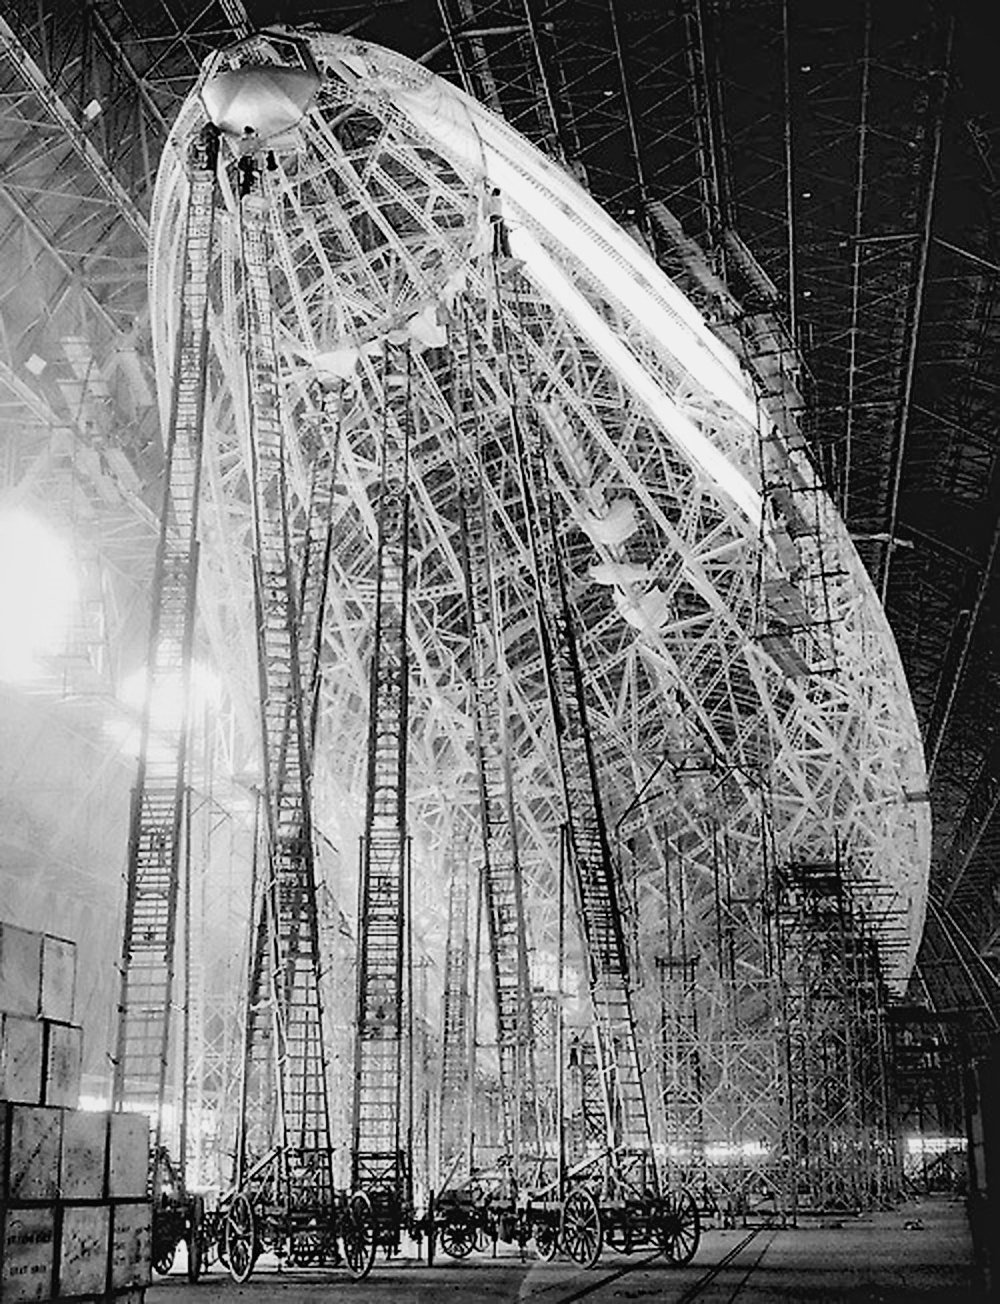
齊柏林飛船的線框圖。

1 Brett Jordan,Flickr
使用 shinydashboard 建立儀表板

加入列與方塊:空方塊

  • fluidRow() 加上列
  • 再用 box() 加上方塊

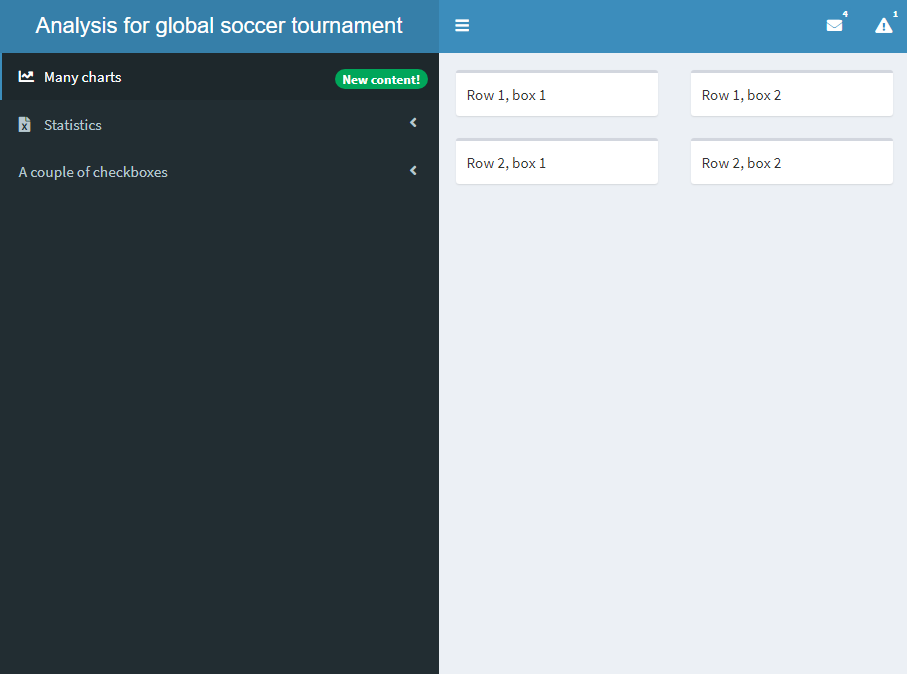
儀表板有兩列,每列各有兩個空方塊。

body <- dashboardBody(

fluidRow(
box("Row 1, box 1"), box("Row 1, box 2")
), fluidRow(
box("Row 2, box 1"), box("Row 2, box 2")
)
)
使用 shinydashboard 建立儀表板

加入列與方塊:方塊內容

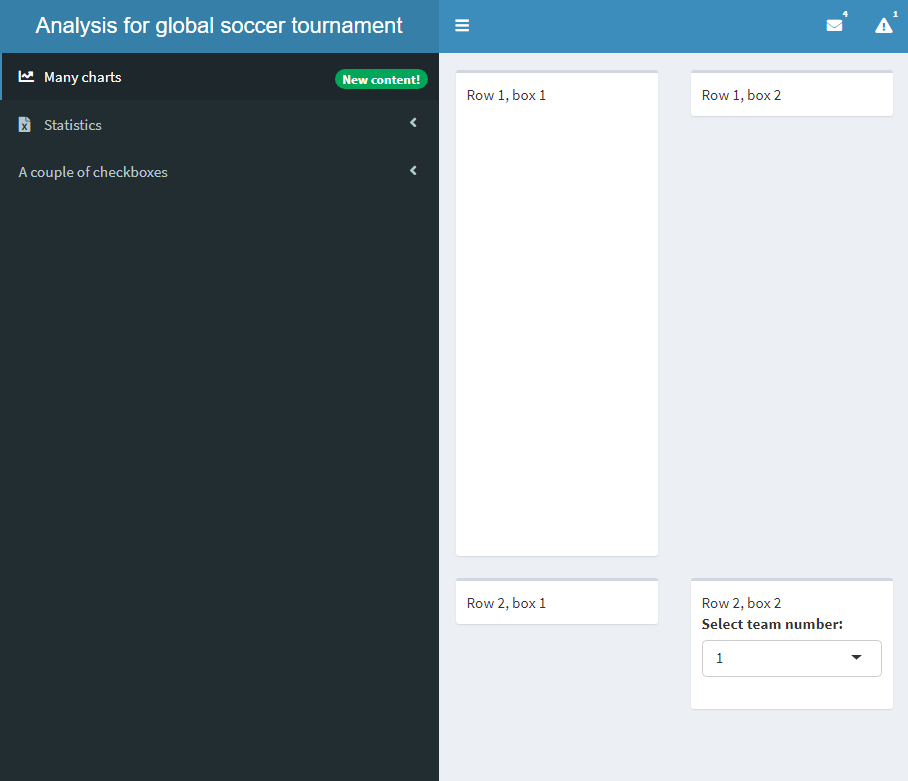
主體有四個方塊,部分方塊已有內容。

body <- dashboardBody(
  fluidRow(box("Row 1, box 1", 

plotOutput('plot')),
box("Row 1, box 2")), fluidRow(box("Row 2, box 1"), box("Row 2, box 2",
selectInput("select", "Select team number:", choices = c(1,2))))
)
使用 shinydashboard 建立儀表板

避免方塊溢出

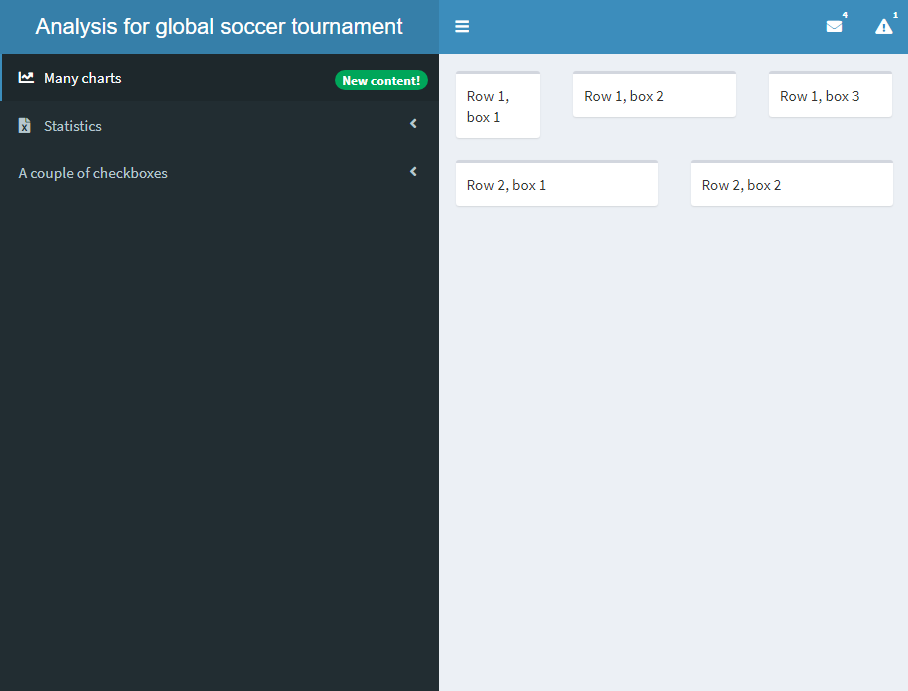
  • 每個方塊預設佔總寬度 12 單位中的 6 單位
  • 為避免溢出,設定 width
    • 本例將寬度設為 3、5、4
  • 建議多用 box()

主體中的更多方塊

body <- dashboardBody(
  fluidRow(box("Row 1, box 1"), 
           box("Row 1, box 2"),
           box("Row 1, box 3")),
  fluidRow(box("Row 2, box 1"), 
           box("Row 2, box 2"))
)
body <- dashboardBody(
  fluidRow(box("Row 1, box 1", width = 3), 
           box("Row 1, box 2", width = 5),
           box("Row 1, box 3", width = 4)),
  fluidRow(box("Row 2, box 1"), 
           box("Row 2, box 2"))
)
使用 shinydashboard 建立儀表板

valueBox 與 infoBox

  • 也有顯示少量資訊的方塊
    • valueBox()
    • infoBox()

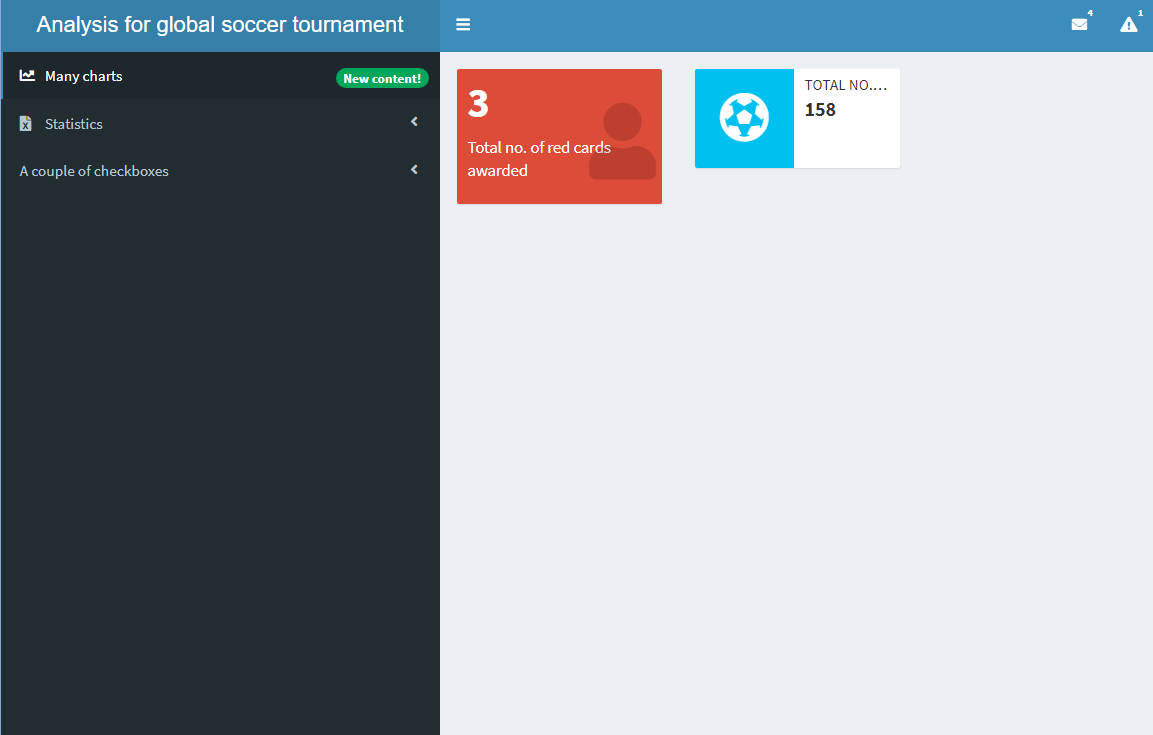
主體中的 valueBox 與 infoBox。

body <- dashboardBody(
  fluidRow(valueBox(value = 3, 
                    subtitle = "Total no. of red cards awarded", 
                    icon = icon("user"),
                    color = "red"),

infoBox(value = 158, title = "Total no. of goals scored", icon = icon("futbol")) ))
使用 shinydashboard 建立儀表板

valueBoxOutput 與 infoBoxOutput

  • valueBox()infoBox() 的變體: valueBoxOutput()infoBoxOutput()
  • 這些是輸出函式
  • 也有 renderValueBox()renderInfoBox()
  • 仍需要 valueBox()infoBox()

主體中的 valueBoxOutput 與 infoBoxOutput。渲染後的儀表板與前一個相同。

body <- dashboardBody(
  fluidRow(valueBoxOutput(outputId = "valuebox1"),
           infoBoxOutput(outputId = "infobox1")
           ))
server <- function(input, output){
  output$valuebox1 <- renderValueBox(
    valueBox(3, "Total no. of red cards awarded",
                icon = icon("user"), color = "red"))
  output$infobox1 <- renderInfoBox(
    infoBox(158, 
                   title = "Total no. of goals scored", 
                   icon = icon("futbol")))
}
使用 shinydashboard 建立儀表板

valueBoxOutput 與 plotOutput 的類比

  • plotOutput()
    • 放在 UI
    • 決定在 shinydashboard 中的「位置」
  • renderPlot()
    • 放在 server()
    • 包含一個 ggplot() 物件
  • valueBoxOutput()
    • 放在 UI
    • 決定在 shinydashboard 中的「位置」
  • renderValueBox()
    • 放在 server()
    • 包含一個 valueBox() 物件
使用 shinydashboard 建立儀表板

連結側邊欄與主體

  • 還記得側邊欄有兩個按鈕「charts」與「statistics」嗎?
  • 要把它們連到主體,需要加入 tabItems()
    • 每一頁由 tabItem() 定義
    • 每個 menuItem()tabItem() 的標籤要相同

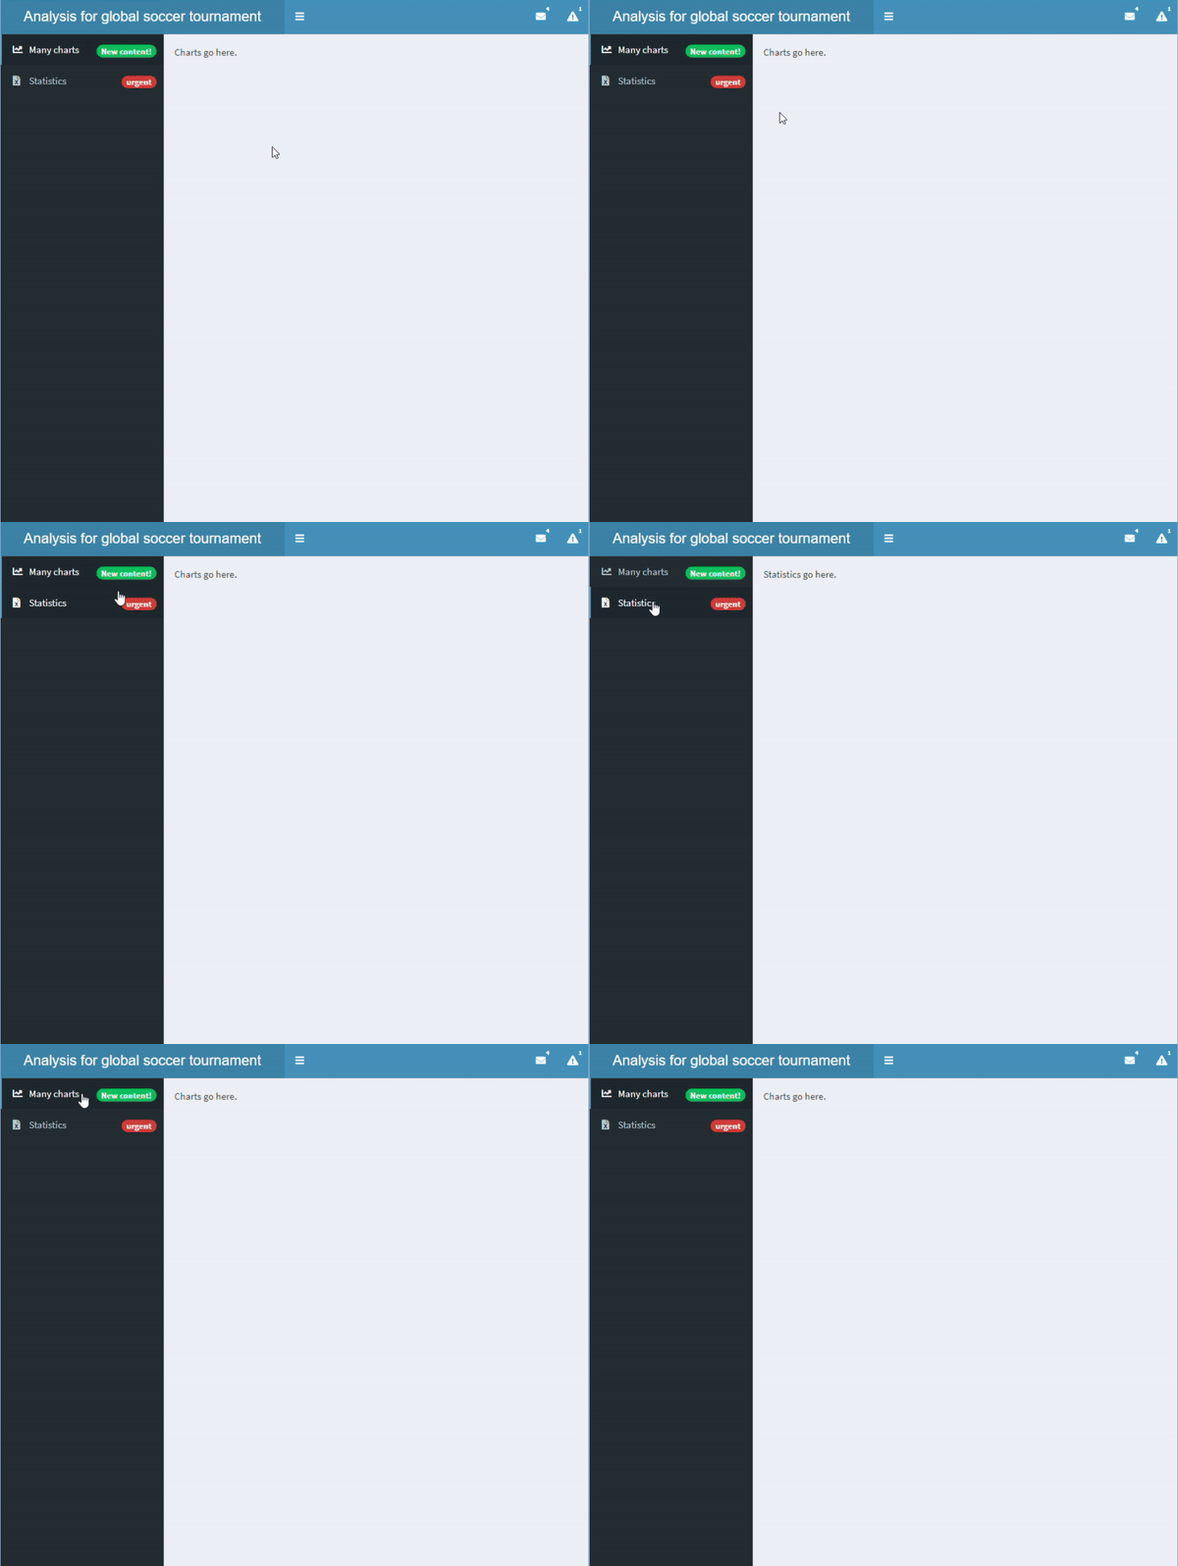
主體與側邊欄已連結

sidebar <- dashboardSidebar(
  sidebarMenu(
    id = "pages",

menuItem("Many charts", tabName = "charts", icon = icon("chart-line"), badgeLabel = "New content!", badgeColor = "green"),
menuItem("Statistics", icon = icon("file-excel"), tabName = "statistics", badgeLabel = "urgent", badgeColor = "red") ))
body <- dashboardBody( tabItems(
tabItem("charts", "Charts go here." ), tabItem("statistics", "Statistics go here." )))
使用 shinydashboard 建立儀表板

主體中的分頁

  • 在 shinyApp 中,也可用 tabsetPanel() 定義一組分頁
    • 每個分頁由 tabPanel() 定義
  • 不要和 tabItems()tabItem() 混淆

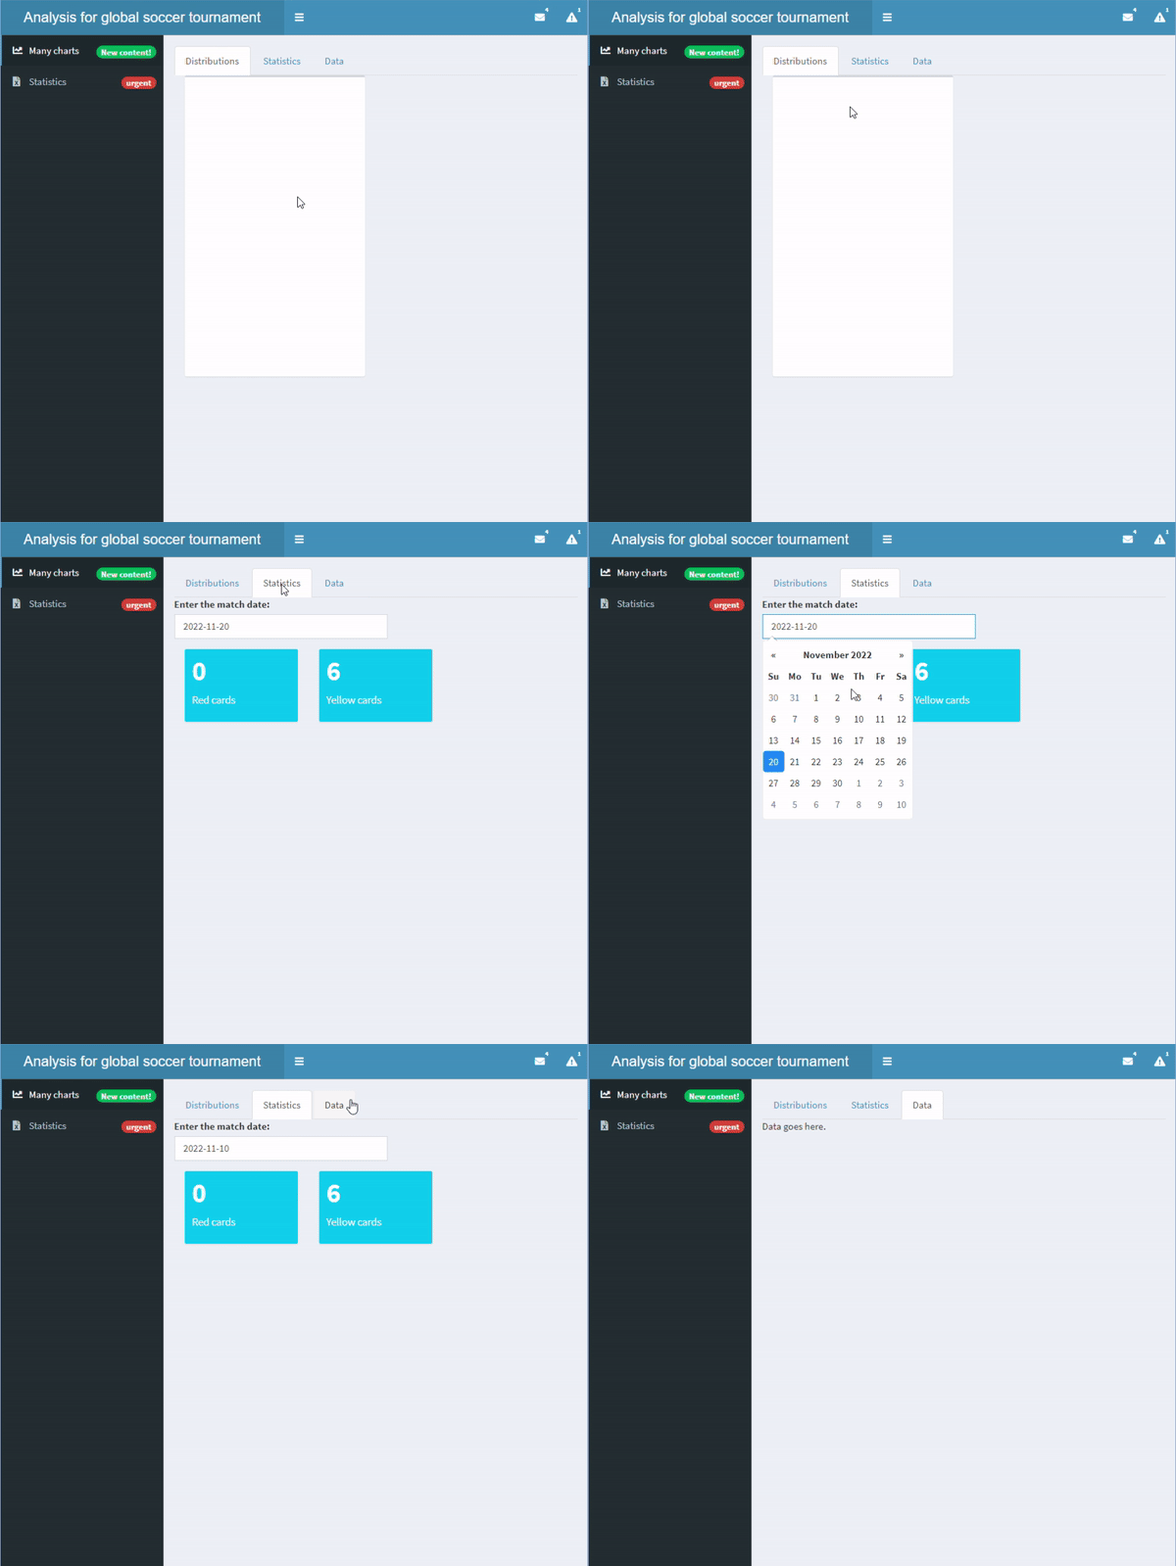
在主體中加入分頁組

body <- dashboardBody(tabsetPanel(

tabPanel("Distributions", box(plotOutput("dist"))), tabPanel("Statistics", dateInput("matchdate", "Enter the match date:", value = "2022-11-20"), valueBoxOutput("red"), valueBoxOutput("yellow")), tabPanel("Data", "Data goes here.", tableOutput("data"))
))
server <- function(input, output){ output$red <- renderValueBox(valueBox(0, "Red cards")) output$yellow <- renderValueBox(valueBox(6, "Yellow cards")) }
使用 shinydashboard 建立儀表板

一起來練習吧!

使用 shinydashboard 建立儀表板

Preparing Video For Download...