輸出類型

使用 shinydashboard 建立儀表板

Png Kee Seng

Researcher

Output 與 render 函式

  • 在 shinyApp 中,會有各種輸出
  • 每個輸出都需要呼叫一對函式

    • 第一個是在 UI 的函式
    • 讓我們決定輸出顯示的位置
    • 此類輸出函式通常是:
      <type>output(<identifying label>, ...)
      
  • 第二段程式碼定義在 server 函式內

    • 形式為:
      output$<identifying label> <- render<type>(...)
      
使用 shinydashboard 建立儀表板

範例:睡眠研究

  • 先匯入資料集
    library(tidyverse)
    sleep <- read_csv("../data/Time Americans Spend Sleeping.csv")  
    
  • 這些是欄位
    $ index                   : num [1:945] 0 1 2 3 4  ...
    $ Year                    : num [1:945] 2003 2004 2005 2006 2007 ...
    $ Period                  : chr [1:945] "Annual" "Annual" "Annual" "Annual" ...
    $ Avg hrs per day sleeping: num [1:945] 8.57 8.55 8.62 8.63  ...
    $ Standard Error          : num [1:945] 0.018 0.026 0.023 0.024  ...
    $ Type of Days            : chr [1:945] "All days" "All days" "All days" ...
    $ Age Group               : chr [1:945] "15 years and over" "15 years and over" ...
    $ Activity                : chr [1:945] "Sleeping" "Sleeping" "Sleeping" ...
    $ Sex                     : chr [1:945] "Both" "Both" "Both" ...
    
使用 shinydashboard 建立儀表板

textOutput

  • 先在 UI 放上 textOutput
ui <- fluidPage(
  titlePanel("Sleeping habits in America"), 
  textOutput("textlabel"))

server <- function(input, output) {
}

shinyApp(ui, server)
使用 shinydashboard 建立儀表板

renderText

  • 要產生文字輸出,在 server 放 renderText
  • 需要使用 output$ 標記法
ui <- fluidPage(
  titlePanel("Sleeping habits in America"), 
  textOutput("textlabel"))

server <- function(input, output) { output$textlabel <- renderText("Sleep deprivation is a serious health issue in many major cities around the world.") }
shinyApp(ui, server)
使用 shinydashboard 建立儀表板

textOutput 成品

無輸入互動的文字輸出示範。

使用 shinydashboard 建立儀表板

含互動的 textOutput

  • 為了讓輸入與輸出互動,需要用 input$ 來讀取輸入
input$<type>
使用 shinydashboard 建立儀表板

含互動的 textOutput

  • 例如,來看一個文字輸入的例子。
ui <- fluidPage(
  titlePanel("Sleeping habits in America"), 

textInput("textlabel", "Tell me your name", value = "", placeholder = "Don"),
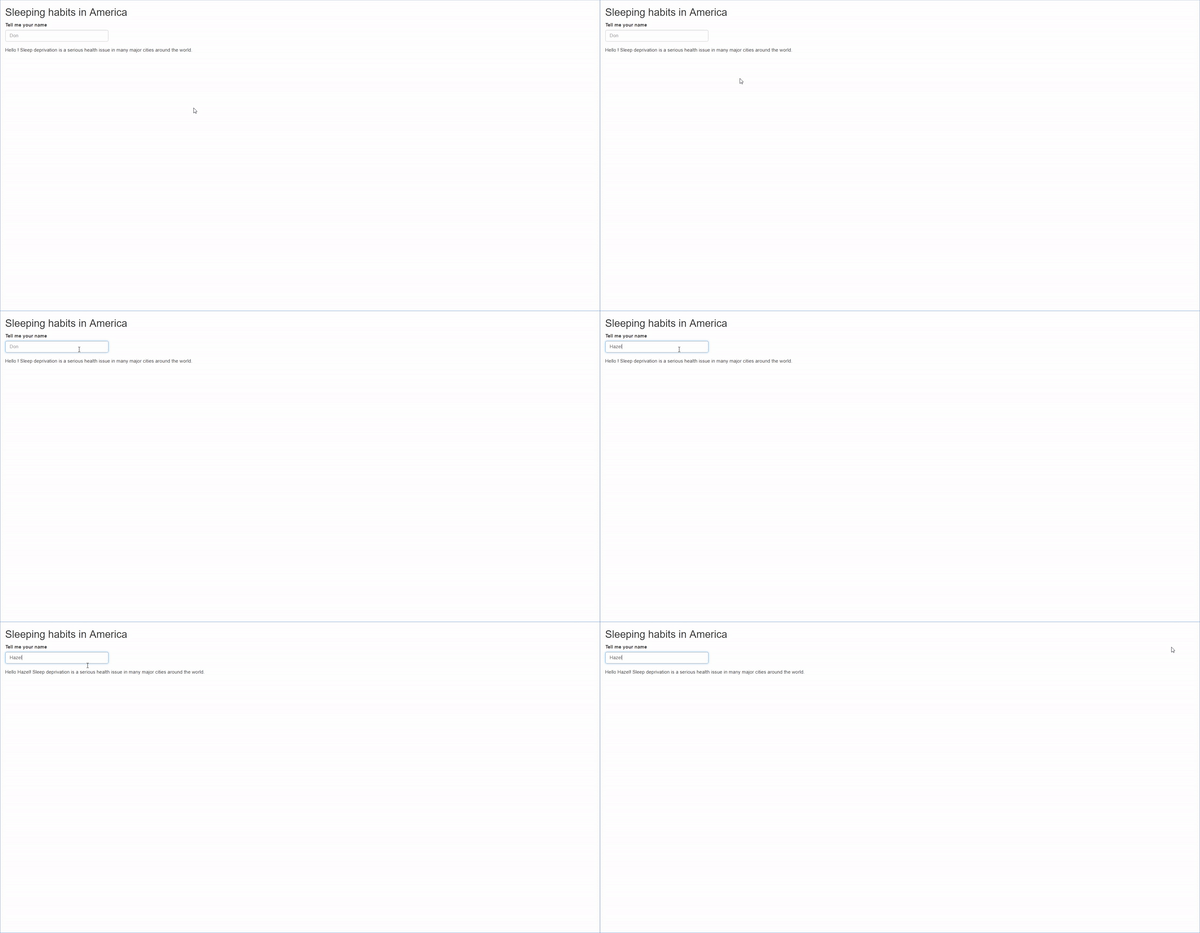
textOutput("textoutlabel")) server <- function(input, output) { output$textoutlabel <- renderText(paste0("Hello ",
input$textlabel,
"Sleep deprivation is a serious health issue in many major cities around the world.")) } shinyApp(ui, server)
使用 shinydashboard 建立儀表板

含互動的 textOutput

含互動的文字輸出。

使用 shinydashboard 建立儀表板

plotOutput

  • 在 UI 放上 plotOutput()
ui <- fluidPage(
  titlePanel("Sleeping habits in America"), 

plotOutput("plotlabel"))
server <- function(input, output) { } shinyApp(ui, server)
使用 shinydashboard 建立儀表板

renderPlot

  • 接著在 server() 放上 renderPlot()
ui <- fluidPage(
  titlePanel("Sleeping habits in America"), 
  plotOutput("plotlabel"))

server <- function(input, output) {

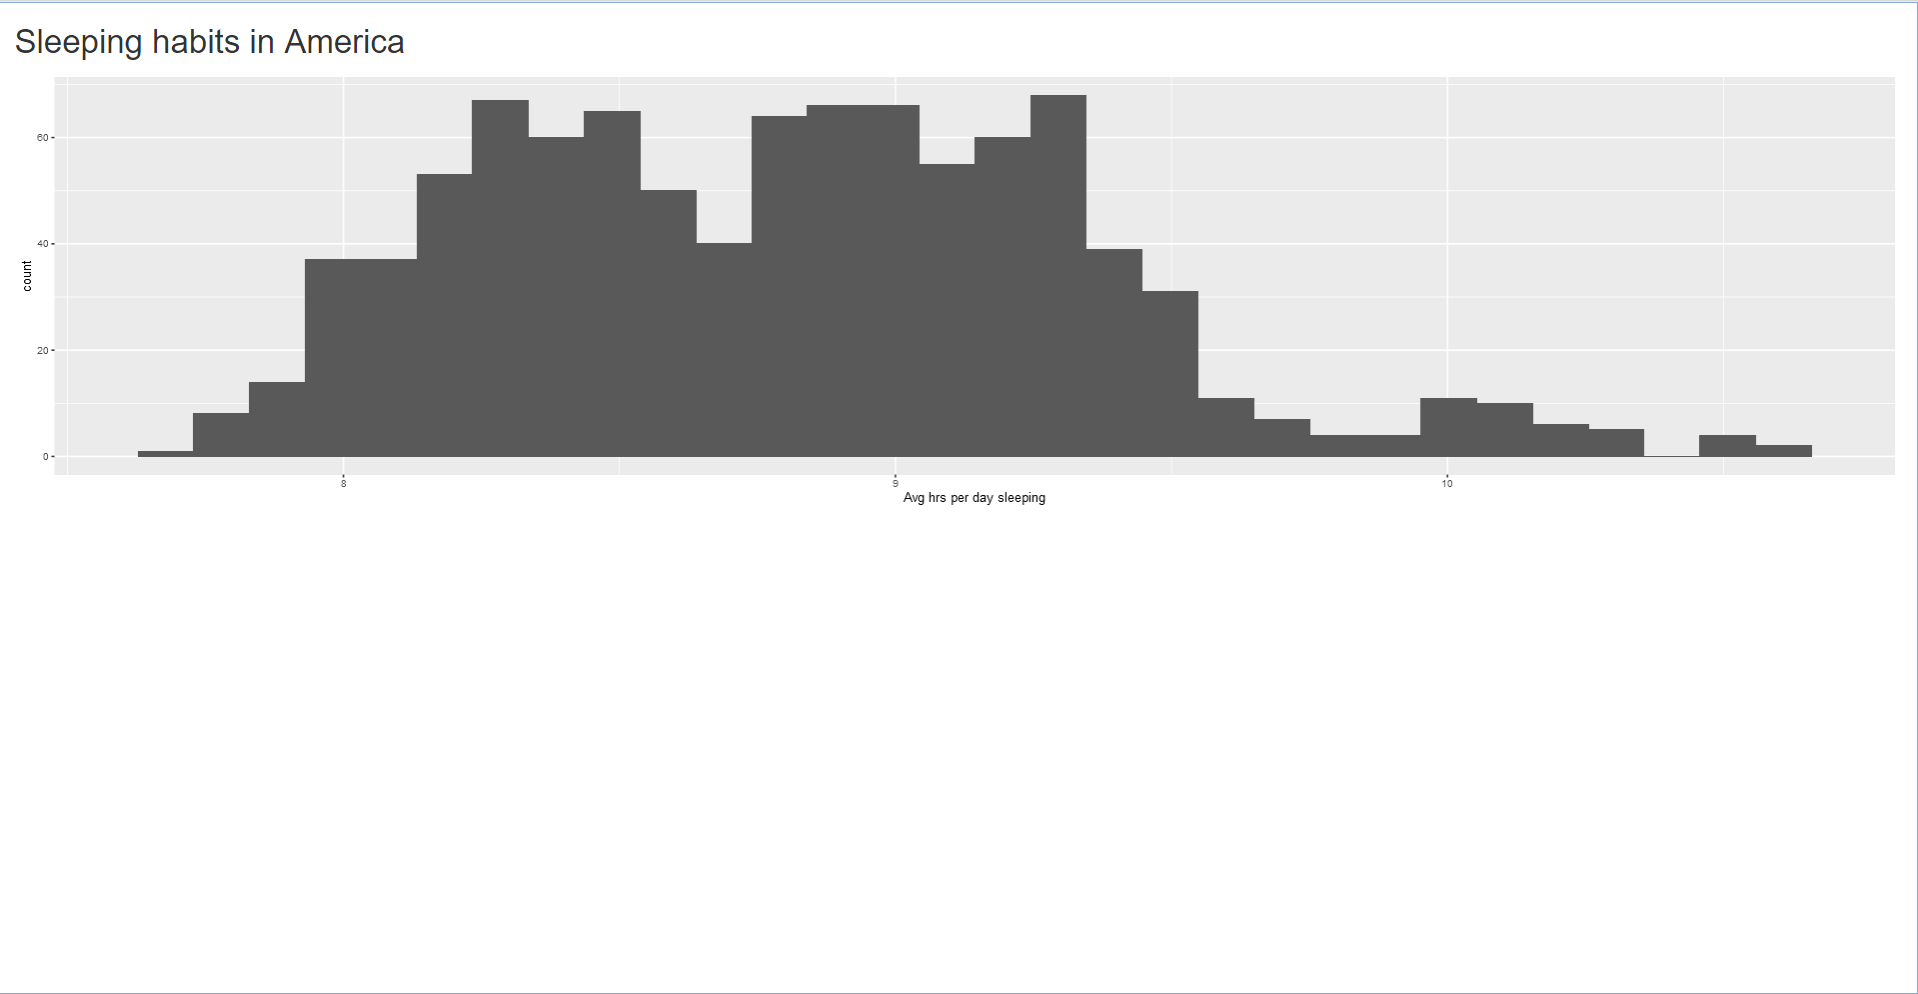
output$plotlabel <- renderPlot({ ggplot(sleep) + geom_histogram(aes(x = `Avg hrs per day sleeping`)) })
} shinyApp(ui, server)
使用 shinydashboard 建立儀表板

plotOutput 成品

plotOutput 示範。

使用 shinydashboard 建立儀表板

plotOutput 搭配 selectInput

  • 使用者輸入可產生不同結果
ui <- fluidPage(
  titlePanel("Sleeping habits in America"), 
  selectInput("selectlabel", 
              "Select an option",
              choices = c("Histogram", "Boxplot")),
  plotOutput("plotlabel"))
使用 shinydashboard 建立儀表板

plotOutput 搭配 selectInput

server <- function(input, output) {
  output$plotlabel <- renderPlot({
    if (input$selectlabel == "Histogram"){

ggplot(sleep) + geom_histogram(aes(x = `Avg hrs per day sleeping`))
} else if (input$selectlabel == "Boxplot"){
ggplot(sleep) + geom_boxplot(aes(x = `Avg hrs per day sleeping`))
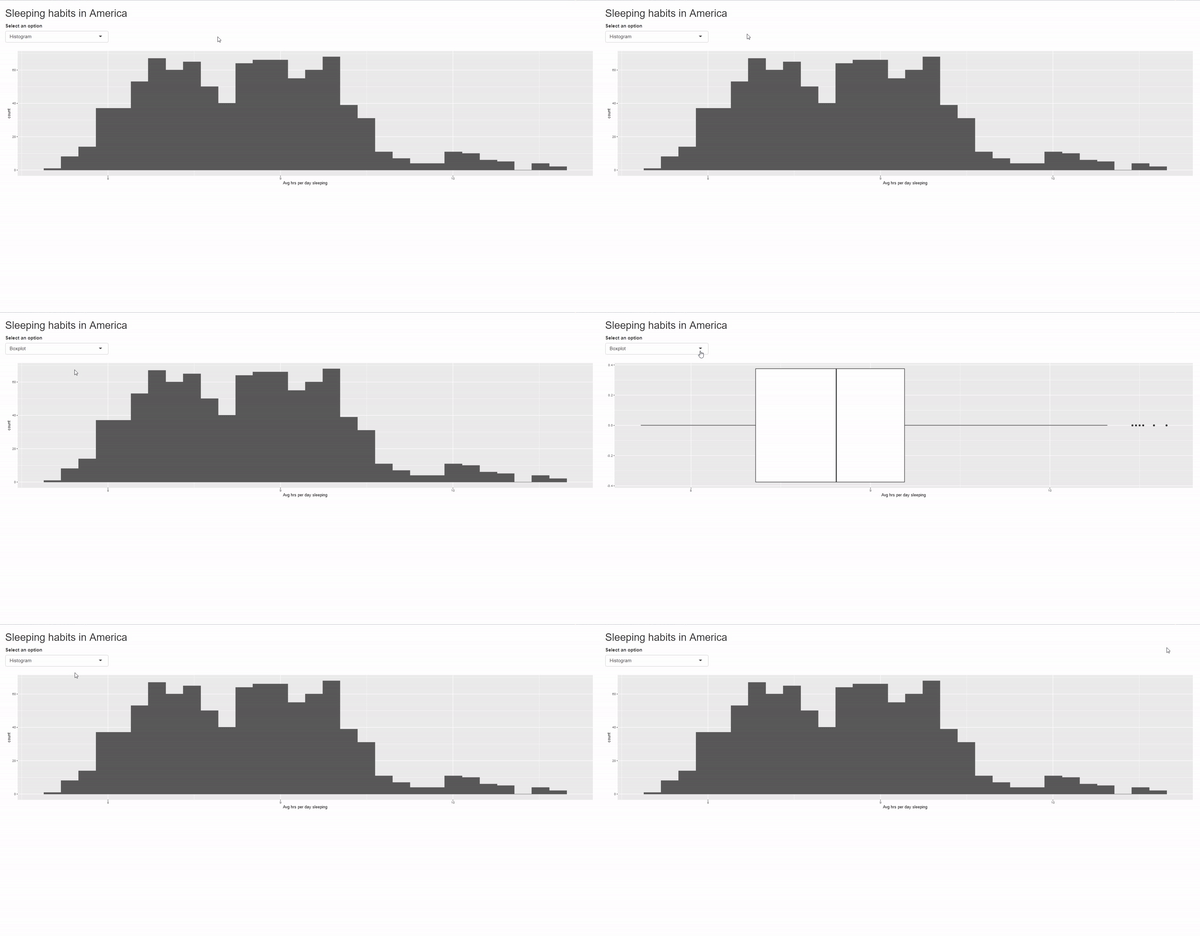
} }) } shinyApp(ui, server)
使用 shinydashboard 建立儀表板

plotOutput 搭配 selectInput

plotOutput 搭配 selectInput 示範

使用 shinydashboard 建立儀表板

plotOutput 搭配 sliderInput

  • 再看一個 sliderInput 的例子
ui <- fluidPage(
  titlePanel("Sleeping habits in America"), 

sliderInput("sliderlabel", "Average hours of sleep", min = 7.5, max = 11, value = c(7.5, 11), step = 0.02),
plotOutput("plotlabel")) server <- function(input, output) {
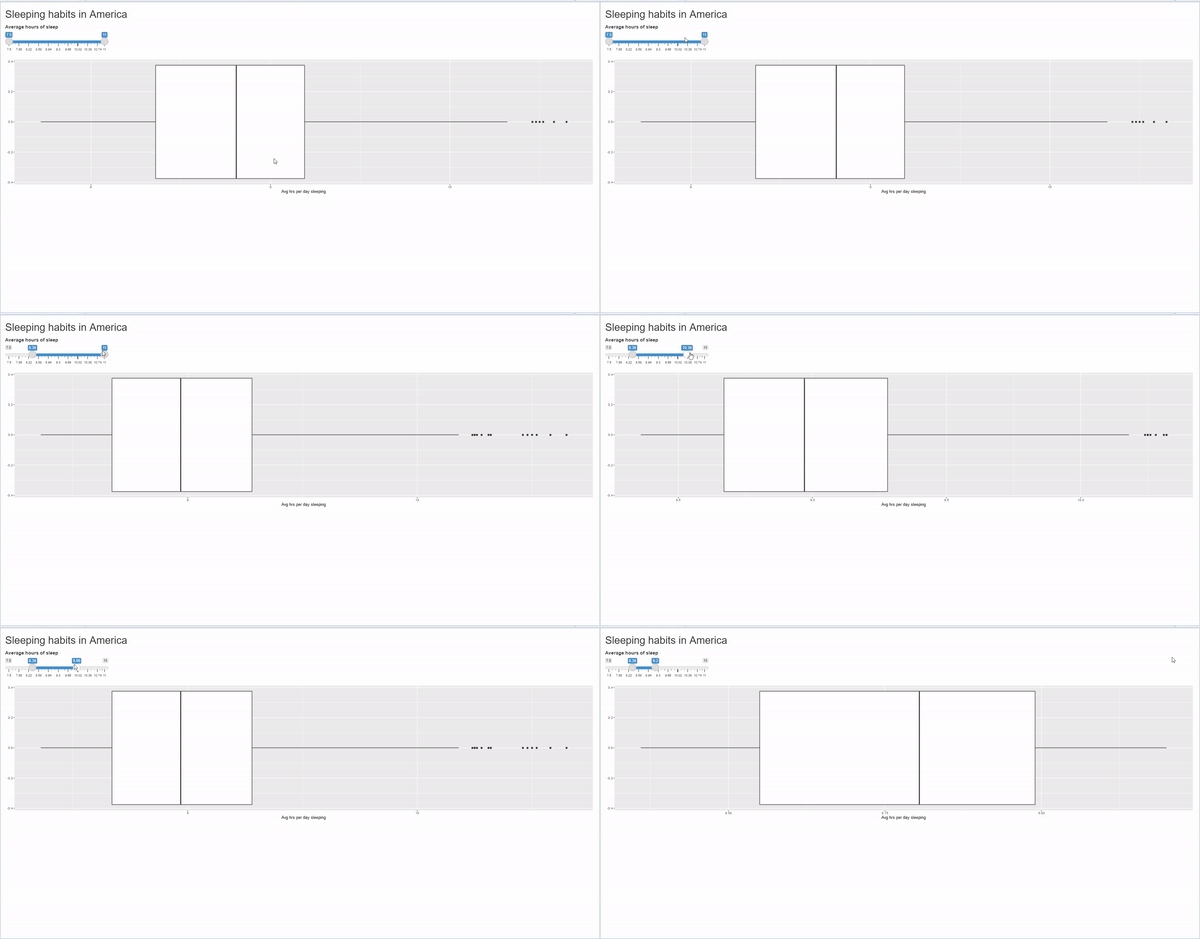
output$plotlabel <- renderPlot({ filter(sleep, `Avg hrs per day sleeping` >= input$sliderlabel[1], `Avg hrs per day sleeping` <= input$sliderlabel[2]) %>% ggplot() + geom_boxplot(aes(x=`Avg hrs per day sleeping`)) })
} shinyApp(ui, server)
使用 shinydashboard 建立儀表板

plotOutput 搭配 sliderInput

plotOutput 搭配 sliderInput 示範

使用 shinydashboard 建立儀表板

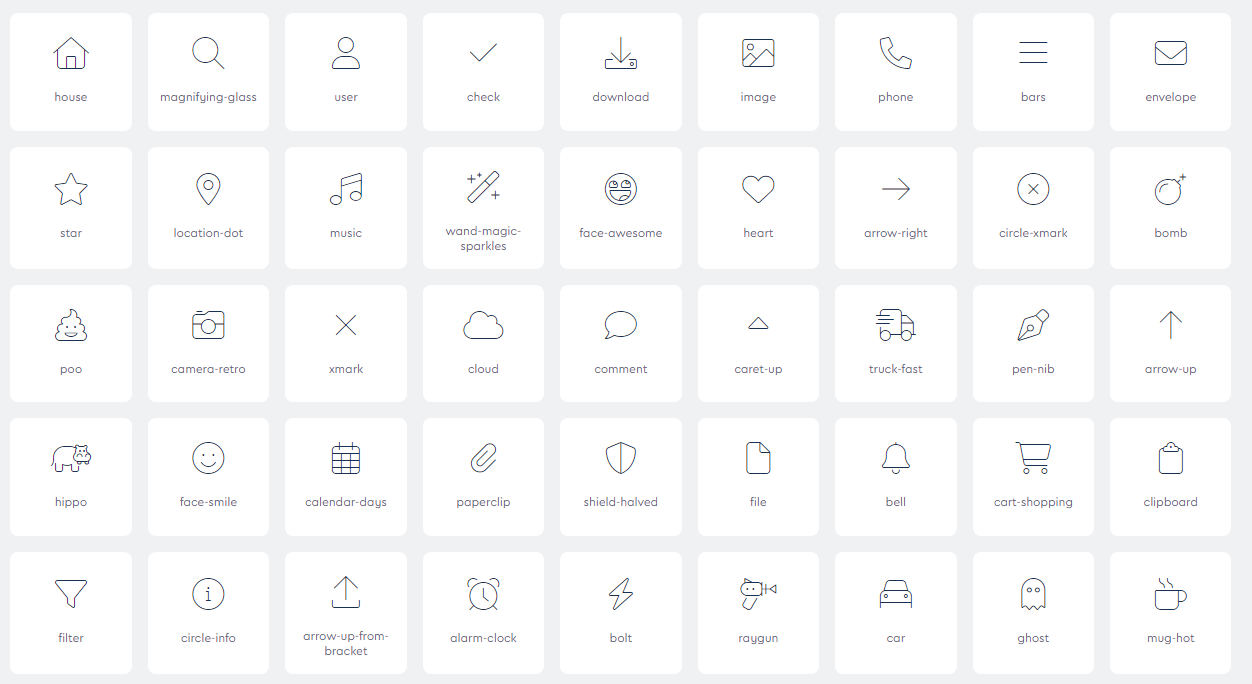
shiny 的圖示

  • shiny 也提供可在 shinyApp 使用的圖示

shiny 中的一些圖示

1 https://fontawesome.com/icons
使用 shinydashboard 建立儀表板

shiny 圖示:範例

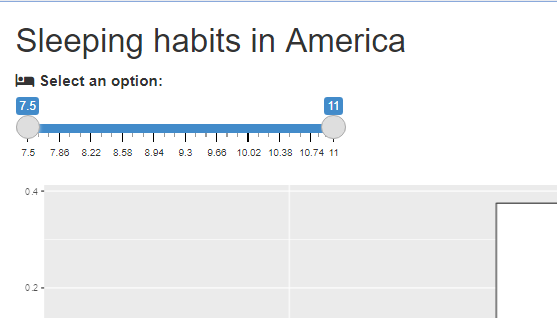
  • 使用 icon("...")
  • 回想前面的例子
  • 例如:icon("bed")
ui <- fluidPage(
  titlePanel("Sleeping habits in America"), 
  sliderInput("sliderlabel",

list(icon("bed"),
"Select an option:"), min = 7.5, max = 11, value = c(7.5, 11), step = 0.02), plotOutput("plotlabel")) server <- function(input, output) { output$plotlabel <- renderPlot({ filter(sleep, `Avg hrs per day sleeping` >= input$sliderlabel[1], `Avg hrs per day sleeping` <= input$sliderlabel[2]) %>% ggplot() + geom_boxplot(aes(x=`Avg hrs per day sleeping`)) }) } shinyApp(ui, server)
使用 shinydashboard 建立儀表板

含圖示的成品應用程式

圖示示範

使用 shinydashboard 建立儀表板

一起來練習吧!

使用 shinydashboard 建立儀表板

Preparing Video For Download...