使用 sf 製作空間地圖

使用 shinydashboard 建立儀表板

Png Kee Seng

Researcher

sf 入門

  • 使用 sf 製作空間地圖
    • 「simple features」的縮寫
  • sf 的空間視覺化一律以圖層堆疊建立
    • 就像在白色畫布上一筆一畫疊出層次
    • 本章不深入探討空間視覺化細節

白色畫布上的筆觸。

1 Image by rawpixel.com on Freepik
使用 shinydashboard 建立儀表板

載入函式庫與空間資料

  • 載入 sftidyverse
  • st_read()st_as_sf() 讀取 KML(Keyhole Markup Language)檔
    • london_poly:倫敦的空間「邊界」
    • london_loop:環繞倫敦的(近乎)圓形「路徑」
    • london_capital:連結倫敦內側各區的圓形「路徑」
    • listings_geo:Airbnb 列表的「座標」
library(sf)
library(tidyverse)
london_poly <- st_read("../data/london_boroughs_boroughs_kml.kml",
                            drivers = "KML", quiet=TRUE)
london_loop <- st_read("../data/London-Loop-SWC-Walk-L24.kml",
                       drivers = "KML", quiet=TRUE)
london_capital <- st_read("../data/Capital-Ring-SWC-Walk-L23.kml",
                          drivers="KML", quiet=TRUE)
listings_geo <- st_as_sf(listings,
                         coords = c("longitude", "latitude"))
使用 shinydashboard 建立儀表板

sf 物件類型:MULTIPOLYGON

london_poly$geometry
Geometry set for 33 features 
Geometry type: MULTIPOLYGON

Dimension: XY Bounding box: xmin: -0.508813 ymin: 51.28691 ... Geodetic CRS: WGS 84 First 5 geometries: MULTIPOLYGON (((-0.183361 51.66868, -0.183383 5... MULTIPOLYGON (((0.158044 51.50904, 0.156309 51.... MULTIPOLYGON (((-0.212138 51.55558, -0.212689 5... MULTIPOLYGON (((0.076463 51.431, 0.075932 51.43... MULTIPOLYGON (((-0.140804 51.56946, -0.14081 51...

10 邊的隨機多邊形。

15 邊的隨機多邊形。

使用 shinydashboard 建立儀表板

sf 物件類型:LINESTRING

london_loop$geometry
Geometry set for 1 feature 
Geometry type: LINESTRING
Dimension:     XYZ
Bounding box:  xmin: -0.499406 ymin: 51.29375 xmax: 0.257656 ymax: 51.67563
z_range:       zmin: 0 zmax: 174
Geodetic CRS:  WGS 84
LINESTRING Z (0.236477 51.48095 1, 0.235149 51....

london_capital 也相同

使用 shinydashboard 建立儀表板

sf 物件類型:POINT

listings_geo$geometry
Geometry set for 69351 features 
Geometry type: POINT
Dimension:     XY
Bounding box:  xmin: -0.5236 ymin: 51.27248 xmax: 0.30515 ymax: 51.70893
CRS:           NA
First 5 geometries:
POINT (-0.05396 51.52874)
POINT (-0.1127 51.56861)
POINT (-0.07426 51.52851)
POINT (-0.10484 51.52478)
POINT (-0.20004 51.51464)
使用 shinydashboard 建立儀表板

用 plot() 繪製多邊形

  • st_geometry() 建立多邊形
  • 使用 plot()
  • 透過設定 col 以不同顏色填滿每個多邊形
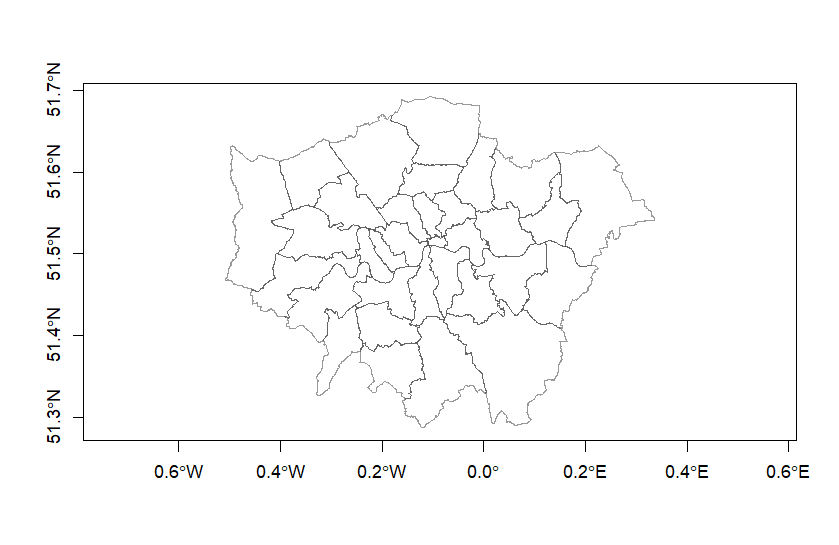
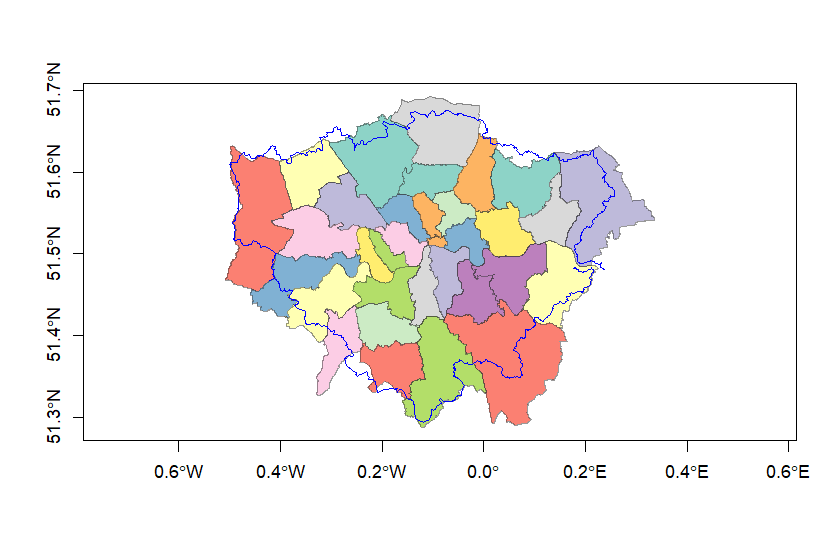
plot(st_geometry(london_poly), axes=TRUE, 
                border=grey(0.2, 0.5))
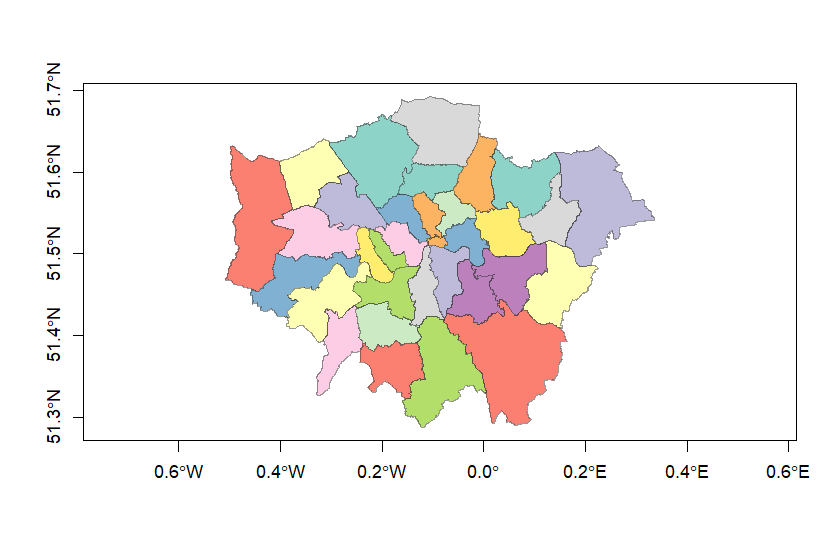
plot(st_geometry(london_poly), 
        col = sf.colors(length(london_poly$Name), 
                        categorical = TRUE), 
        axes=TRUE, border=grey(0.2, 0.5))

未填色的多重多邊形圖。

已填色的多重多邊形圖。

使用 shinydashboard 建立儀表板

用 plot() 繪製折線

  • st_geometry()london_loop 建立折線
    • add 設為 TRUE
    • col 設為藍色
  • london_capital 也同樣處理
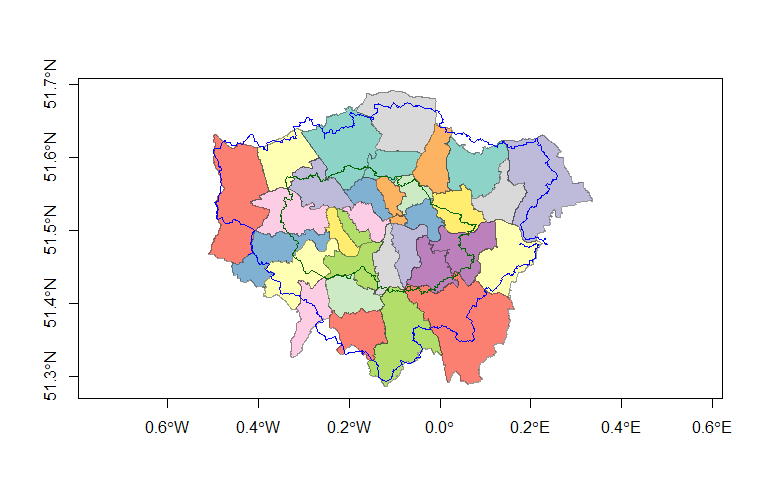
plot(st_geometry(london_loop),

add=TRUE,
col="blue")
plot(st_geometry(london_capital), add=TRUE, col="darkgreen")

含一條環狀路徑的地圖。

含兩條環狀路徑的地圖。

使用 shinydashboard 建立儀表板

用 plot() 繪製點

  • 使用 st_geometry() 加上點
    plot(st_geometry(listings_geo), add=TRUE, col='red')
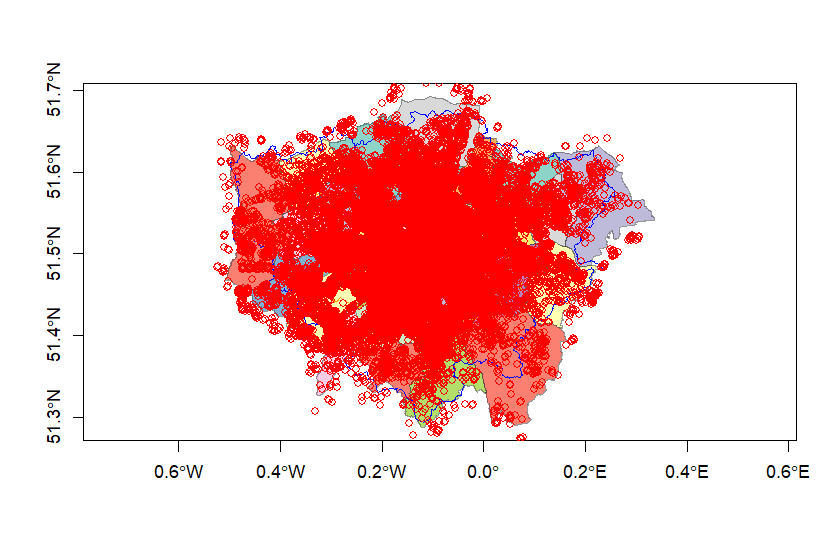
    

繪製 sf 點。

使用 shinydashboard 建立儀表板

用 ggplot() 繪製多邊形

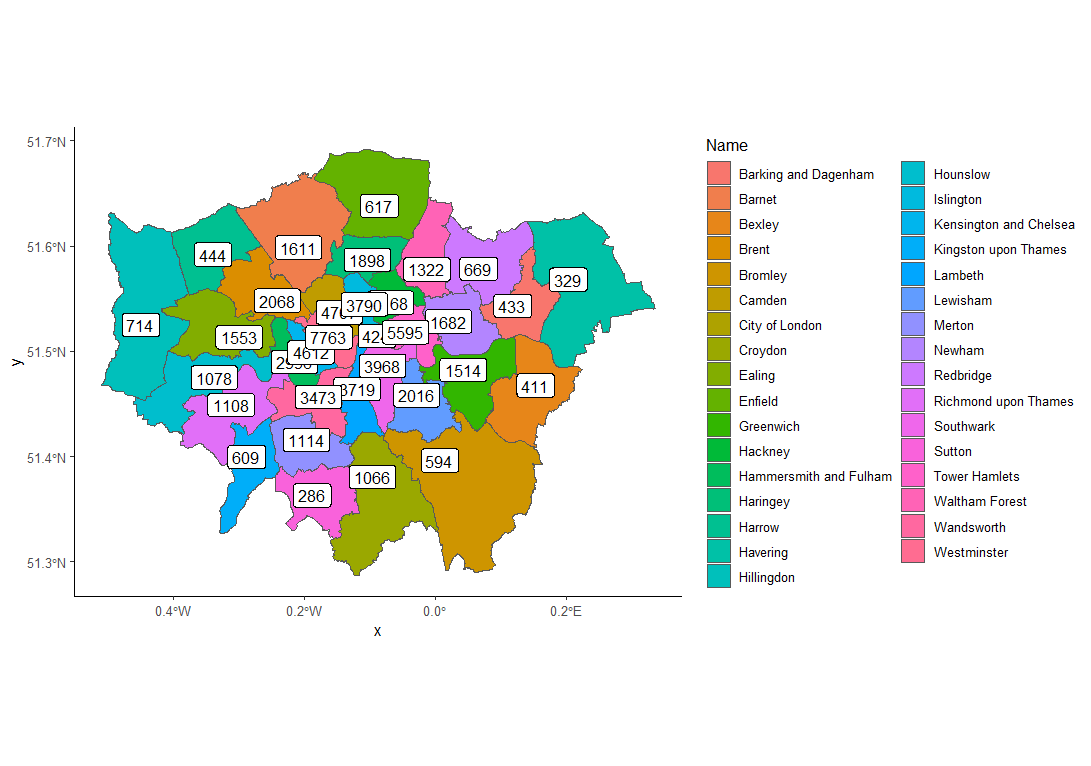
  • 可用 ggplot() 繪製 sf 的圖層
  • 需要讓兩個圖層的座標參考系(CRS)一致

以 ggplot 建立的空間地圖。

num_listings <- listings %>% 
  group_by(neighbourhood) %>%
  summarize(`Number of listings` = n(),
            longitude = mean(longitude),
            latitude = mean(latitude),
            .groups = "drop") %>%

st_as_sf(coords = c("longitude", "latitude"))
st_crs(num_listings) <- st_crs(london_poly)
ggplot_map <- ggplot(london_poly) + geom_sf(aes(fill = Name)) +
geom_sf_label(data=num_listings, aes(label=`Number of listings`)) + theme_classic()
使用 shinydashboard 建立儀表板

一起來練習吧!

使用 shinydashboard 建立儀表板

Preparing Video For Download...