平行斜率線性迴歸

使用 Python 的 statsmodels 進行迴歸分析:中級

Maarten Van den Broeck

Content Developer at DataCamp

前一門課

本課程預設你已修過《Introduction to Regression with statsmodels in Python》。

使用 Python 的 statsmodels 進行迴歸分析:中級

從單一到多元迴歸

「多元迴歸」是含有多個解釋變數的迴歸模型。

更多解釋變數可帶來「更多洞見」與「更佳預測」。

使用 Python 的 statsmodels 進行迴歸分析:中級

課程內容

第 1 章

  • 「平行斜率」迴歸

第 2 章

  • 交互作用
  • 辛普森悖論

第 3 章

  • 更多解釋變數
  • 線性迴歸如何運作

第 4 章

  • 多元羅吉斯迴歸
  • 羅吉斯分配
  • 羅吉斯迴歸如何運作
使用 Python 的 statsmodels 進行迴歸分析:中級

魚類資料集

mass_g length_cm species
242.0 23.2 Bream
5.9 7.5 Perch
200.0 30.0 Pike
40.0 12.9 Roach
  • 每列代表一條魚
  • mass_g 是應變數
  • 1 個數值、1 個類別解釋變數
使用 Python 的 statsmodels 進行迴歸分析:中級

一次放入一個解釋變數

from statsmodels.formula.api import ols

mdl_mass_vs_length = ols("mass_g ~ length_cm",
                         data=fish).fit()
print(mdl_mass_vs_length.params)
Intercept   -536.223947
length_cm     34.899245
dtype: float64
  • 1 個截距係數
  • 1 個斜率係數
mdl_mass_vs_species = ols("mass_g ~ species + 0",
                          data=fish).fit()

print(mdl_mass_vs_species.params)
species[Bream]    617.828571
species[Perch]    382.239286
species[Pike]     718.705882
species[Roach]    152.050000
dtype: float64
  • 每個類別各有 1 個截距係數
使用 Python 的 statsmodels 進行迴歸分析:中級

同時放入兩個變數

mdl_mass_vs_both = ols("mass_g ~ length_cm + species + 0",
                       data=fish).fit()
print(mdl_mass_vs_both.params)
species[Bream]    -672.241866
species[Perch]    -713.292859
species[Pike]    -1089.456053
species[Roach]    -726.777799
length_cm           42.568554
dtype: float64
  • 1 個斜率係數
  • 每個類別各有 1 個截距係數
使用 Python 的 statsmodels 進行迴歸分析:中級

比較各係數

print(mdl_mass_vs_length.params)
Intercept   -536.223947
length_cm     34.899245
print(mdl_mass_vs_both.params)
species[Bream]    -672.241866
species[Perch]    -713.292859
species[Pike]    -1089.456053
species[Roach]    -726.777799
length_cm           42.568554
print(mdl_mass_vs_species.params)
species[Bream]    617.828571
species[Perch]    382.239286
species[Pike]     718.705882
species[Roach]    152.050000
使用 Python 的 statsmodels 進行迴歸分析:中級

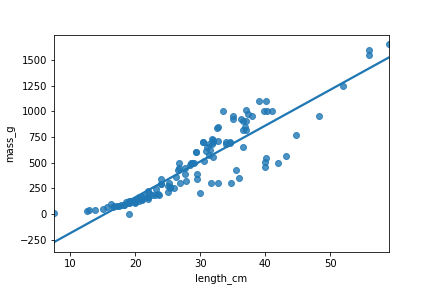
視覺化:1 個數值解釋變數

import matplotlib.pyplot as plt
import seaborn as sns

sns.regplot(x="length_cm",
            y="mass_g",
            data=fish,
            ci=None)

plt.show()

魚的質量對長度的散佈圖,含線性趨勢線

使用 Python 的 statsmodels 進行迴歸分析:中級

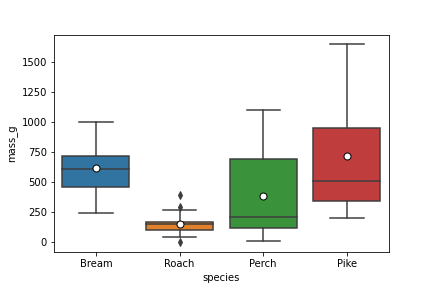
視覺化:1 個類別解釋變數

sns.boxplot(x="species",
            y="mass_g",
            data=fish,
            showmeans=True)

各魚種的質量盒鬚圖

使用 Python 的 statsmodels 進行迴歸分析:中級

視覺化:同時觀察兩個解釋變數

coeffs = mdl_mass_vs_both.params
print(coeffs)
species[Bream]    -672.241866
species[Perch]    -713.292859
species[Pike]    -1089.456053
species[Roach]    -726.777799
length_cm           42.568554
ic_bream, ic_perch, ic_pike, ic_roach, sl = coeffs
sns.scatterplot(x="length_cm",
                y="mass_g",
                hue="species",
                data=fish)
plt.axline(xy1=(0, ic_bream), slope=sl, color="blue")
plt.axline(xy1=(0, ic_perch), slope=sl, color="green")
plt.axline(xy1=(0, ic_pike), slope=sl, color="red")
plt.axline(xy1=(0, ic_roach), slope=sl, color="orange")
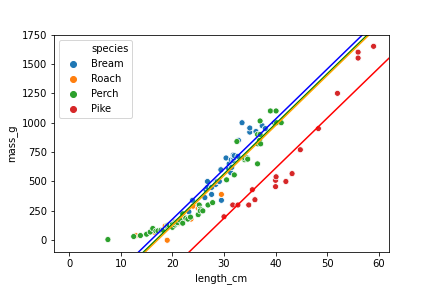
依魚種分類的魚質量對長度平行斜率模型

使用 Python 的 statsmodels 進行迴歸分析:中級

一起來練習吧!

使用 Python 的 statsmodels 進行迴歸分析:中級

Preparing Video For Download...