辛普森悖論

使用 Python 的 statsmodels 進行迴歸分析:中級

Maarten Van den Broeck

Content Developer at DataCamp

巧妙的悖論!

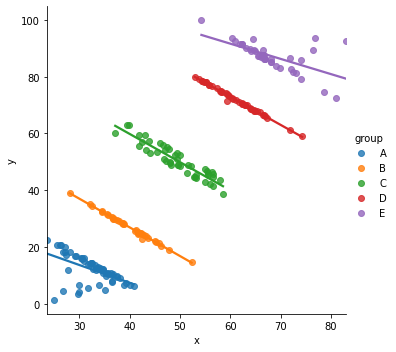
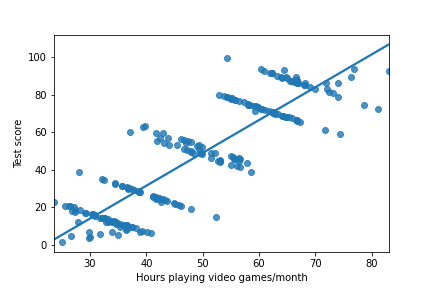
當整體資料集上的模型趨勢,與在資料子集上的模型所呈現的趨勢大不相同時,就會出現辛普森悖論。

trend = 斜率係數

使用 Python 的 statsmodels 進行迴歸分析:中級

合成的辛普森資料

x y group
62.24344 70.60840 D
52.33499 14.70577 B
56.36795 46.39554 C
66.80395 66.17487 D
66.53605 89.24658 E
62.38129 91.45260 E
  • 共有 5 組資料,標記為「A」到「E」
1 https://www.rdocumentation.org/packages/datasauRus/topics/simpsons_paradox
使用 Python 的 statsmodels 進行迴歸分析:中級

線性迴歸

整體資料集

mdl_whole = ols("y ~ x", 
                 data=simpsons_paradox).fit()

print(mdl_whole.params)
Intercept           -38.554  
x                     1.751  

依群組

mdl_by_group = ols("y ~ group + group:x + 0",
                   data = simpsons_paradox).fit()

print(mdl_by_group.params)
  groupA    groupB    groupC    groupD    groupE  
 32.5051   67.3886   99.6333  132.3932  123.8242  
groupA:x  groupB:x  groupC:x  groupD:x  groupE:x  
 -0.6266   -1.0105   -0.9940   -0.9908   -0.5364
使用 Python 的 statsmodels 進行迴歸分析:中級

繪製整體資料集

sns.regplot(x="x",
            y="y",
            data=simpsons_paradox,
            ci=None)

辛普森悖論資料集的散佈圖,合併所有群組。整體趨勢為正向.png

使用 Python 的 statsmodels 進行迴歸分析:中級

依群組繪圖

sns.lmplot(x="x",
           y="y",
           data=simpsons_paradox,
           hue="group",
           ci=None)

辛普森悖論資料集的散佈圖,依群組著色。每個群組的趨勢皆為負向.png

使用 Python 的 statsmodels 進行迴歸分析:中級

化解差異

好建議

若可行,就把資料集畫出來。

常見提醒

無法用通則選出最佳模型——要看資料集與你要回答的問題。

更多好建議

建模前先清楚定義問題。

使用 Python 的 statsmodels 進行迴歸分析:中級

測驗分數範例

scatter-video-games-whole.png

scatter-video-games-by-group.png

使用 Python 的 statsmodels 進行迴歸分析:中級

傳染病範例

scatter-cities-whole.png

scatter-cities-by-group.png

使用 Python 的 statsmodels 進行迴歸分析:中級

化解差異

  • 通常(但不一定)分組模型更有洞見。
  • 你是否少了解釋變數?
  • 脈絡很重要。
使用 Python 的 statsmodels 進行迴歸分析:中級

真實資料中的辛普森悖論

  • 在真實資料中,悖論通常不明顯。
  • 你可能看到斜率接近 0,而非完全反向。
  • 不一定在每個群組都出現。
使用 Python 的 statsmodels 進行迴歸分析:中級

一起來練習吧!

使用 Python 的 statsmodels 進行迴歸分析:中級

Preparing Video For Download...