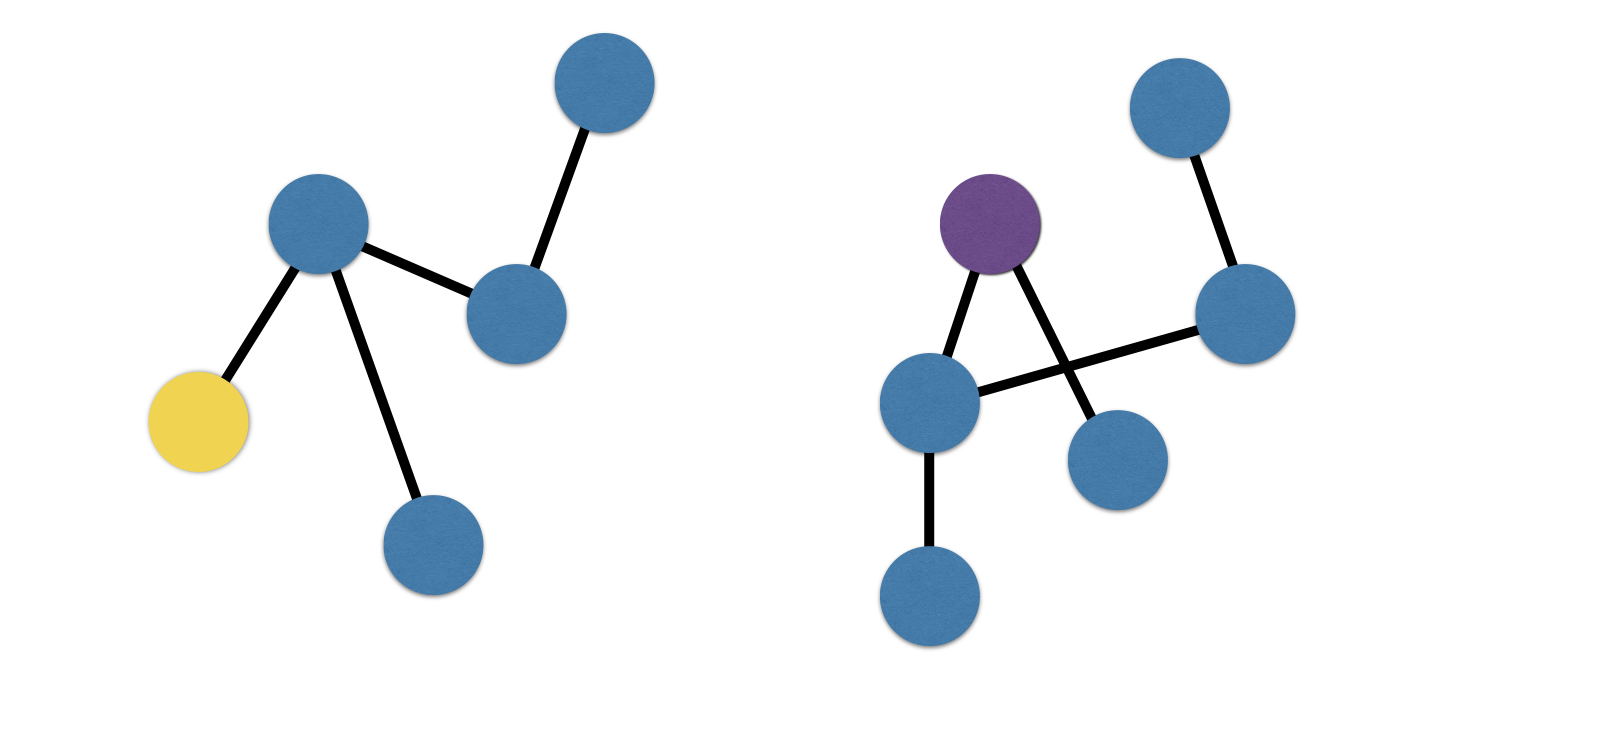
Python 網路分析入門
Eric Ma
Data Carpentry instructor and author of nxviz package
import networkx as nx
import nxviz as nv
G = nx.erdos_renyi_graph(n=20, p=0.3)

circ = nv.circos(G, node_color_by='key', sort_by='key')
import networkx as nx import nxviz as nv G = nx.erdos_renyi_graph(n=20, p=0.3)
circ = nv.circos(G, node_color_by='key', sort_by='key')
import networkx as nx
G = nx.erdos_renyi_graph(n=100, p=0.03)

nx.connected_components(G)
import networkx as nx G = nx.erdos_renyi_graph(n=100, p=0.03)
nx.connected_components(G)
<generator object connected_component_subgraphs at 0x10cb2c990>
list(nx.connected_components(G))
[<networkx.classes.graph.Graph at 0x10ca24588>,
 <networkx.classes.graph.Graph at 0x10ca244e0>]
for g in list(nx.connected_components(G)):
    print(len(g.nodes()))
99
1