依國家分面
案例研究:R 中的探索性資料分析

Dave Robinson
Chief Data Scientist, DataCamp
繪製多個國家
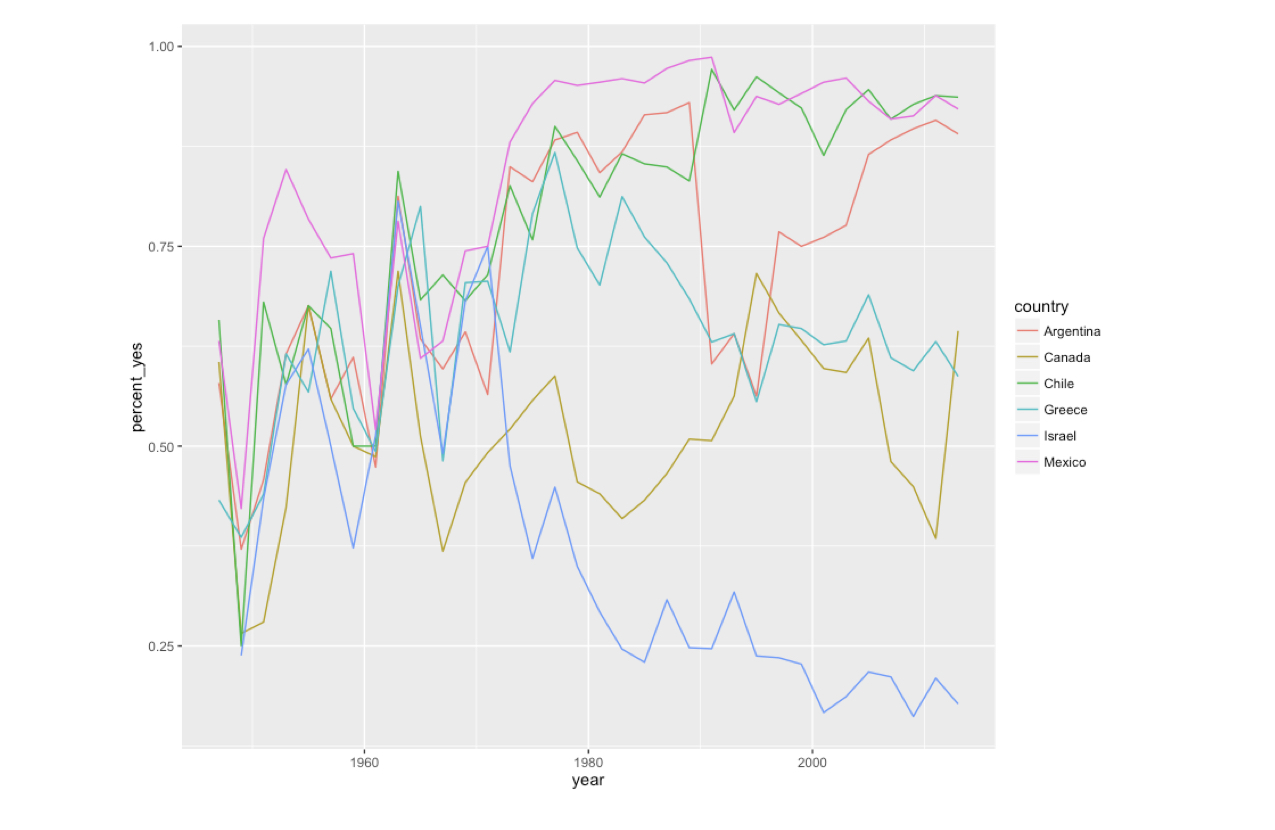
繪製多個國家
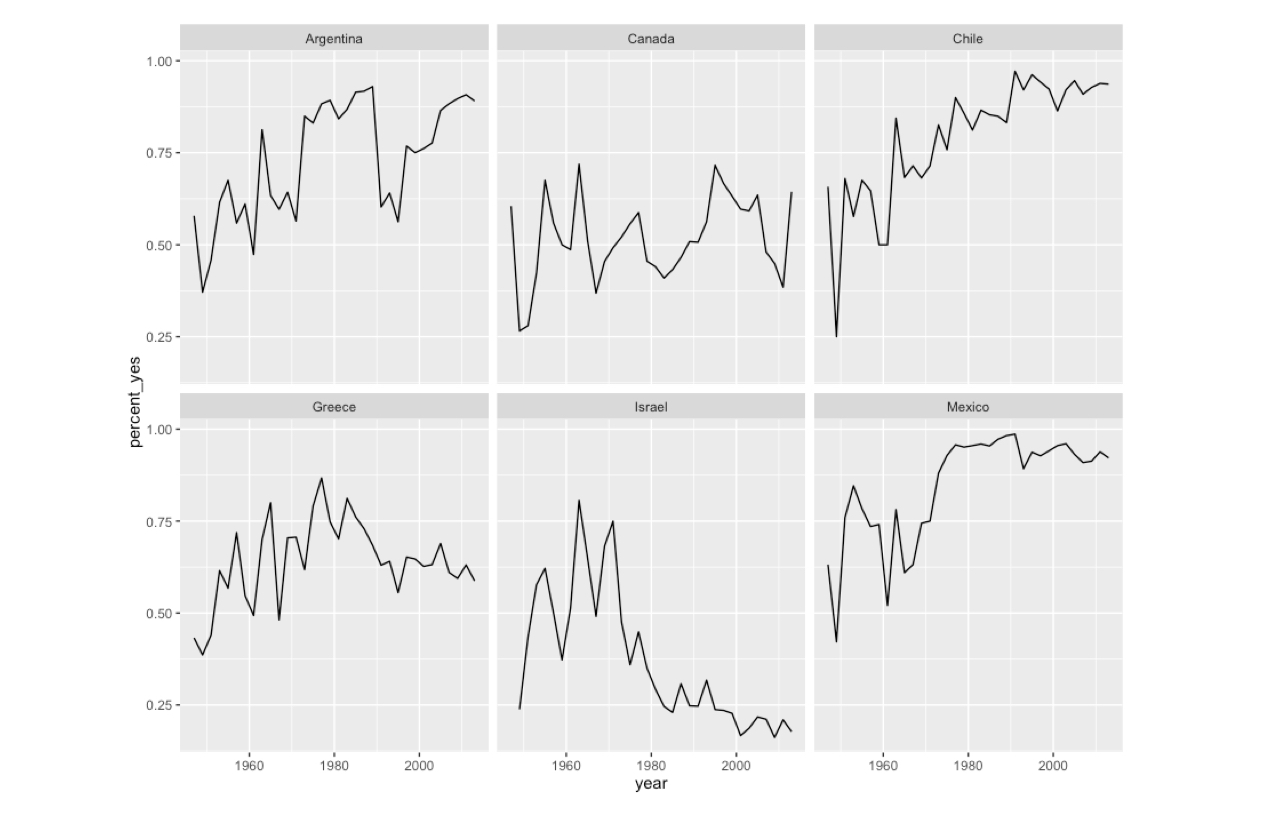
ggplot(many_countries, aes(year, percent_yes)) +
  geom_line() +
  facet_wrap(~ country)
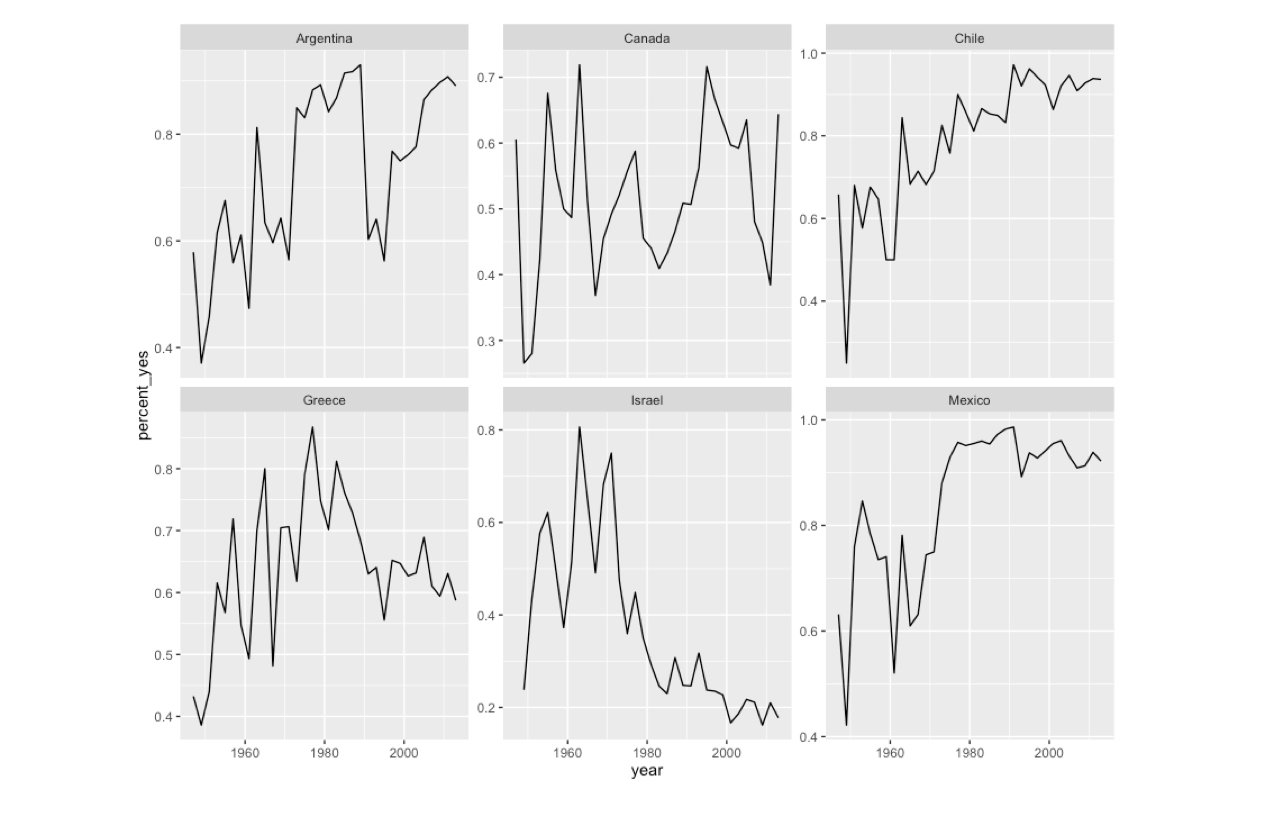
使用不同座標尺度繪圖
ggplot(many_countries, aes(year, percent_yes)) +
  geom_line() +
  facet_wrap(~ country, scales = "free_y")
使用不同座標尺度繪圖
ggplot(many_countries, aes(year, percent_yes)) +
  geom_line() +
  facet_wrap(~ country, scales = "free_y")
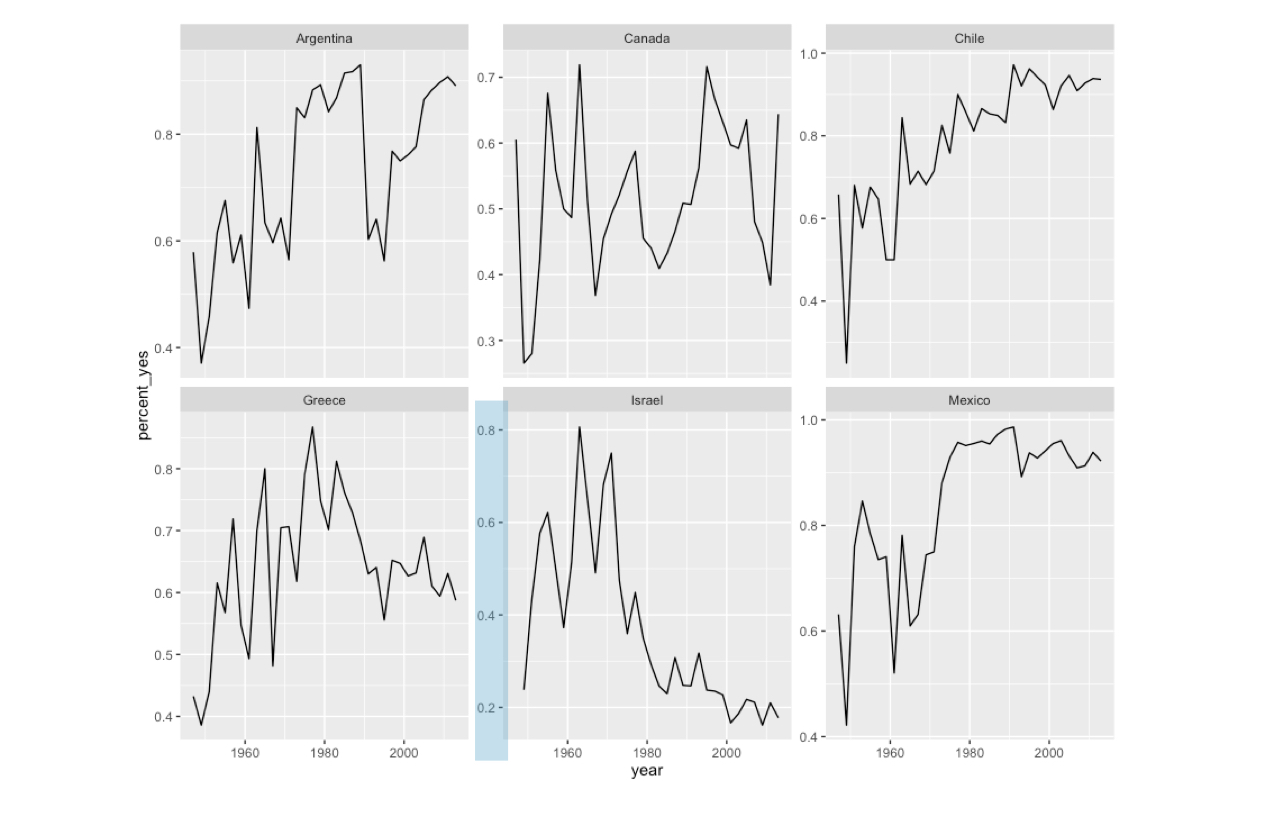
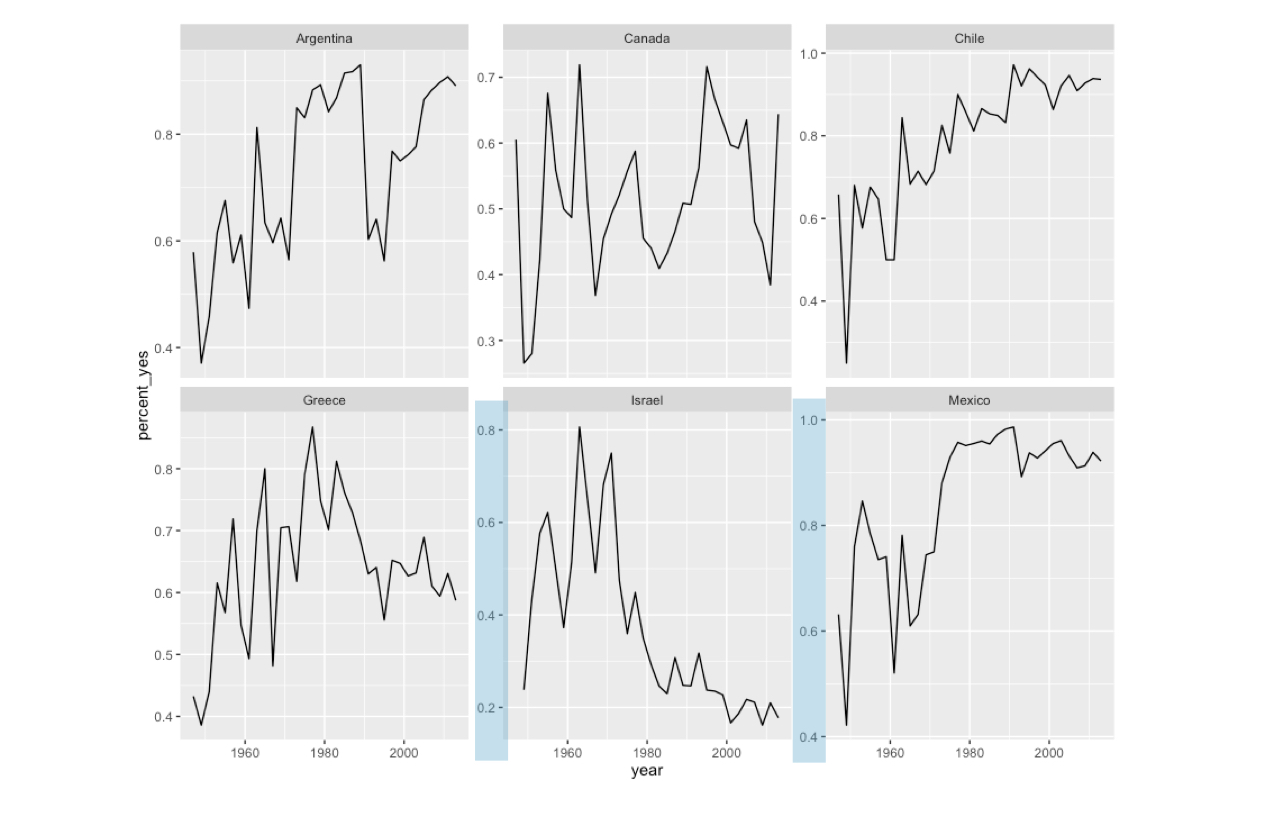
使用不同座標尺度繪圖
ggplot(many_countries, aes(year, percent_yes)) +
  geom_line() +
  facet_wrap(~ country, scales = "free_y")