記錄洞察與分析
AWS 監控與疑難排解

John Q. Martin
Principal Consultant
Logs Insights 查詢結構
查詢語言:同一個查詢,三種寫法
CloudWatch Logs Insights QL
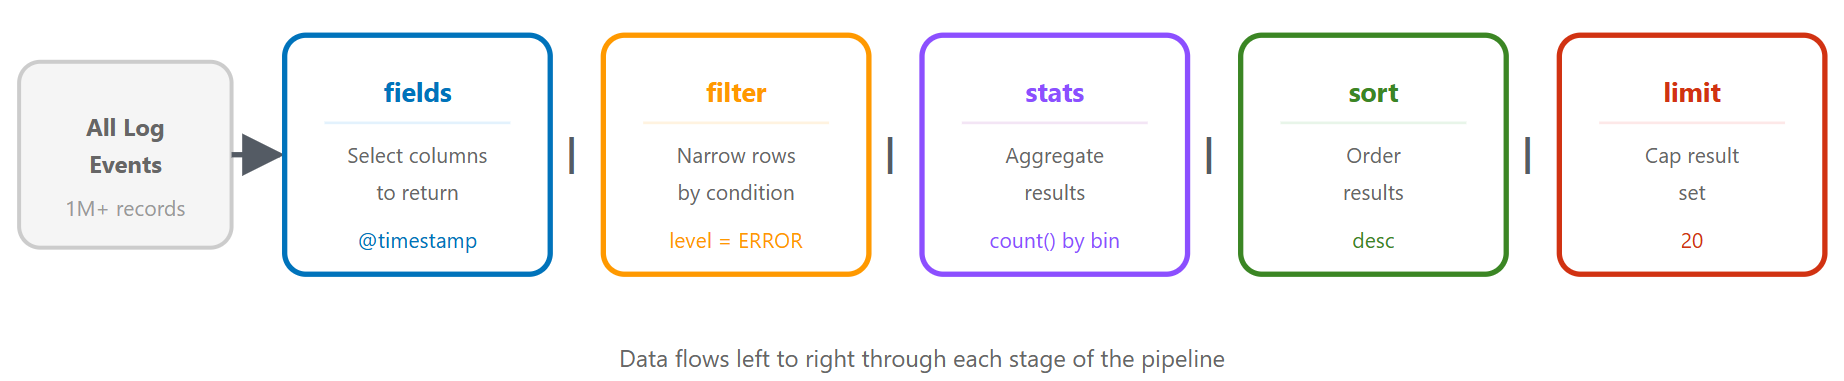
fields @timestamp, @message, level
| filter level = "ERROR"
| filter @timestamp > ago(1h)
| sort @timestamp desc
| limit 20
OpenSearch PPL
source = `/aws/lambda/my-function`
| where level = 'ERROR' and @timestamp > ago(1h)
| fields @timestamp, @message, level
| sort - @timestamp
| head 20
查詢語言:OpenSearch SQL
OpenSearch SQL
SELECT `@timestamp`, `@message`, level
FROM `/aws/lambda/my-function`
WHERE level = 'ERROR'
  AND `@timestamp` > ago(1h)
ORDER BY `@timestamp` DESC
LIMIT 20
- 標準 SELECT / FROM / WHERE 語法
- 可跨記錄群組做 JOIN
- 選擇最符合你團隊的方式
情境 1:找出錯誤高峰
fields @timestamp, @message, level
| filter level = "ERROR"
| stats count() as error_count by bin(5m)
| sort @timestamp desc
強化版:依錯誤類型分組
fields @timestamp, error_type, error_message
| filter level = "ERROR"
| stats count() as count by error_type, bin(5m)
| sort count desc
情境 2:API 端點變慢
fields @timestamp, endpoint, response_time, status_code
| filter response_time > 1000
| stats avg(response_time) as avg_time,
        max(response_time) as max_time,
        count() as slow_requests
        by endpoint
| sort avg_time desc
向下鑽研
fields @timestamp, endpoint, response_time, user_id, request_id
| filter endpoint = "/api/users" and response_time > 1000
| sort response_time desc
| limit 20
情境 3:驗證失敗
fields @timestamp, user_id, ip_address, action
| filter action = "login_failed"
| stats count() as failed_attempts by user_id, ip_address
| sort failed_attempts desc
| limit 50
依時間分析
fields @timestamp, user_id, ip_address
| filter action = "login_failed"
| stats count() as attempts by ip_address, bin(1h)
| filter attempts > 10
| sort attempts desc
情境 4 與 5:資料庫逾時與記憶體洩漏
資料庫逾時
fields @timestamp, @message
| filter @message like /database/ and @message like /timeout|error|failed/
| parse @message "timeout after * seconds" as timeout_duration
| stats count() as timeout_count,
        avg(timeout_duration) as avg_timeout
        by bin(5m)
記憶體洩漏偵測
fields @timestamp, memory_used_mb, heap_size_mb
| stats avg(memory_used_mb) as avg_memory,
        max(memory_used_mb) as max_memory
        by bin(1h)
| sort @timestamp asc
情境 6:請求追蹤
fields @timestamp, @message, request_id, service, action
| filter request_id = "abc123def456"
| sort @timestamp asc
多服務追蹤
fields @timestamp, service, action, duration_ms, status
| filter request_id = "abc123def456"
| sort @timestamp asc
| display @timestamp, service, action, duration_ms, status
進階技巧:parse、Regex
解析非結構化記錄
fields @timestamp, @message
| parse @message "[*] User * failed to access resource * from IP *"
    as level, user, resource, ip
正則表示式解析
| parse @message /Request completed in (?<duration>\d+)ms with status (?<status>\d+)/
進階技巧:計算欄位
fields @timestamp, requests, errors
| fields error_rate = (errors / requests) * 100

fields @timestamp, status_code
| fields status_category =
    case(status_code < 300, "success",
         status_code < 500, "client_error",
         status_code >= 500, "server_error")
| stats count() as request_count by status_category
查詢最佳化
異常偵測與關聯分析
統計式異常偵測
- 建立基準:7 天的平均與標準差
- 將目前區間與基準比較
- 標示超過 2 個標準差的異常值
錯誤率關聯
fields @timestamp, level
| stats count() as total_requests,
        sum(case(level = "ERROR", 1, 0)) as errors
        by bin(5m)
| fields error_rate = (errors / total_requests) * 100
重點整理
- CloudWatch Logs Insights:互動式查詢服務,無需基礎設施
- 三種查詢語言:Logs Insights QL、OpenSearch PPL、OpenSearch SQL
- 六種疑難排解情境:錯誤高峰、端點變慢、驗證失敗、DB 逾時、記憶體洩漏、請求追蹤
- 進階技巧:非結構化文字用
parse,時間序列用bin(),百分位用pct() - 關聯與異常偵測:錯誤率分析、統計基準比較
- 從調查到自動化:度量篩選與警示形成閉環
一起來練習吧!
AWS 監控與疑難排解

