CloudWatch 警示與通知

AWS 監控與疑難排解

John Q. Martin

Principal Consultant

什麼是 CloudWatch 警示
 

關鍵概念

  • 在一段時間內監看單一指標
  • 指標越過臨界值時執行動作


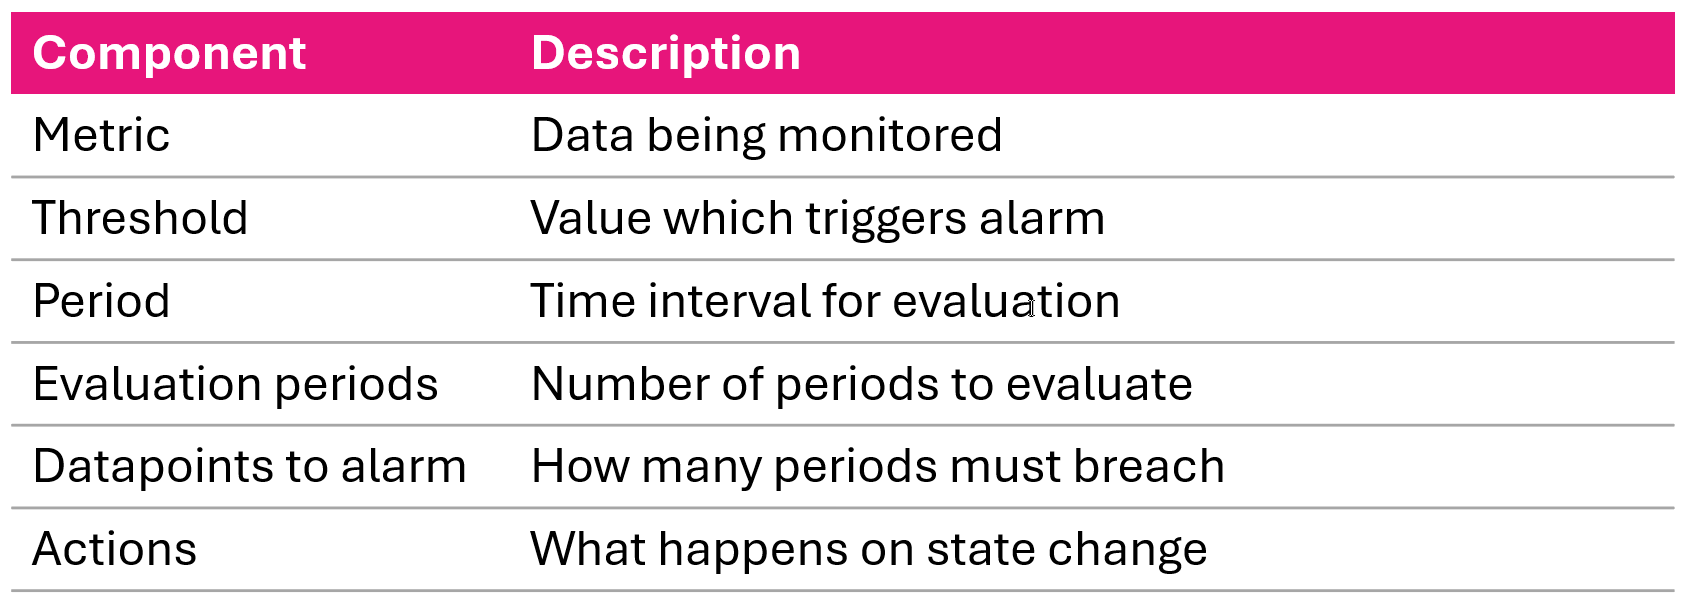
CloudWatch 警示的六大元件:metric、threshold、period、evaluation periods、datapoints to alarm、actions

AWS 監控與疑難排解

警示狀態

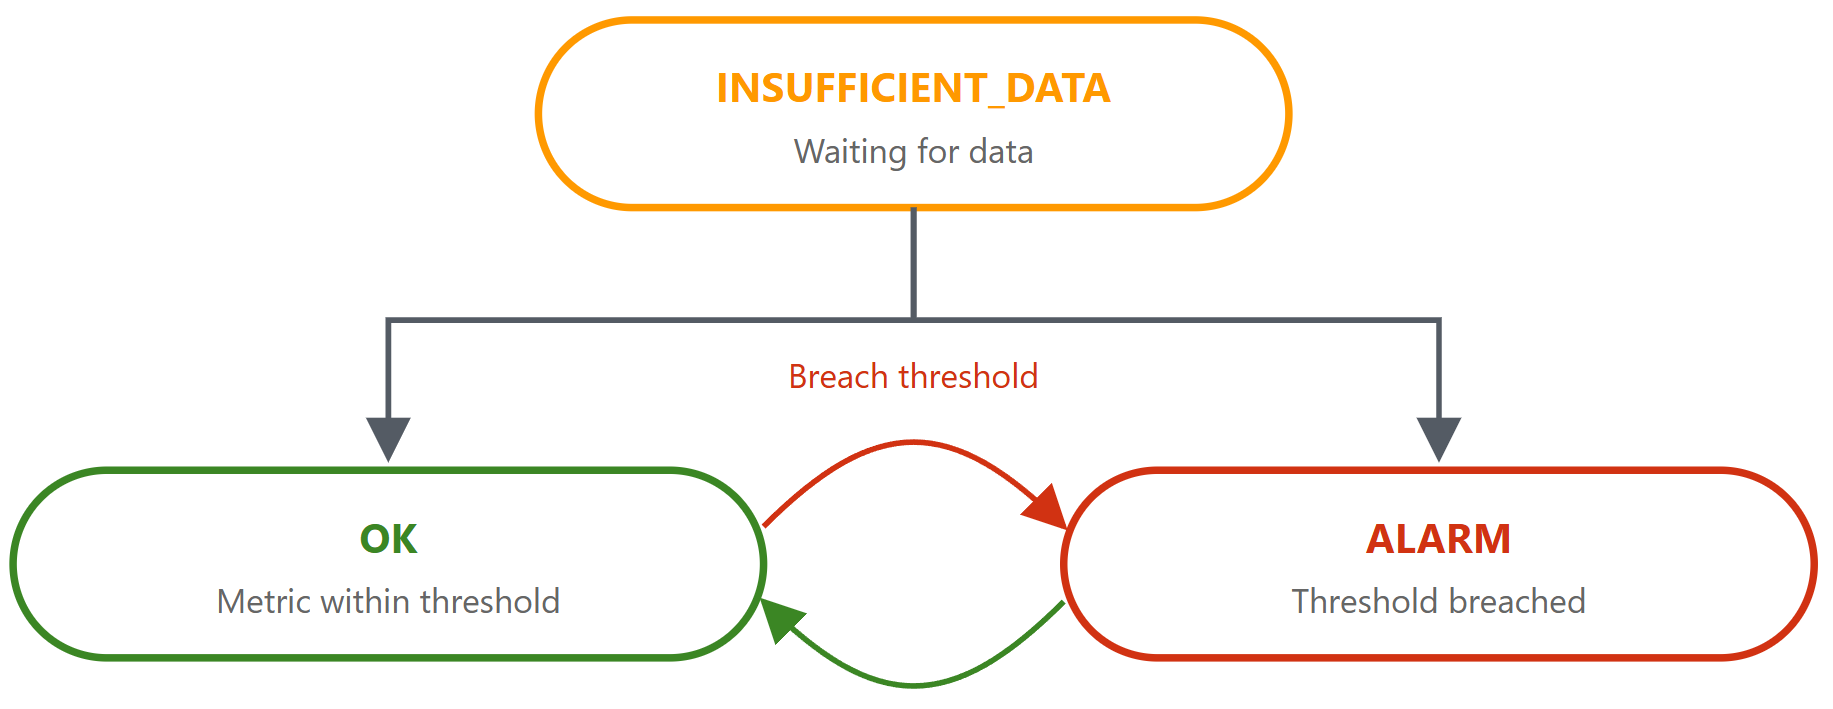
CloudWatch 警示的三種狀態:OK、ALARM、INSSUFFICIENT_DATA

隨著指標資料到達時,CloudWatch 警示如何在各狀態間轉換的示意圖

AWS 監控與疑難排解

警示評估流程


  1. 依間隔收集資料點
  2. 對期間套用統計(Average、Sum、Max、Min)
  3. 將結果與臨界值比較
  4. 計數超標的評估期數
  5. 達到 datapoints-to-alarm 閾值則變更狀態


Metric: CPUUtilization > 80%
Period: 5 min | 
Eval Periods: 3 | 
Datapoints to Alarm: 2 of 3

Period 1: 85% (breach) | 
Period 2: 75% (ok) | 
Period 3: 90% (breach)
Result: ALARM — 2 of 3 breached
AWS 監控與疑難排解

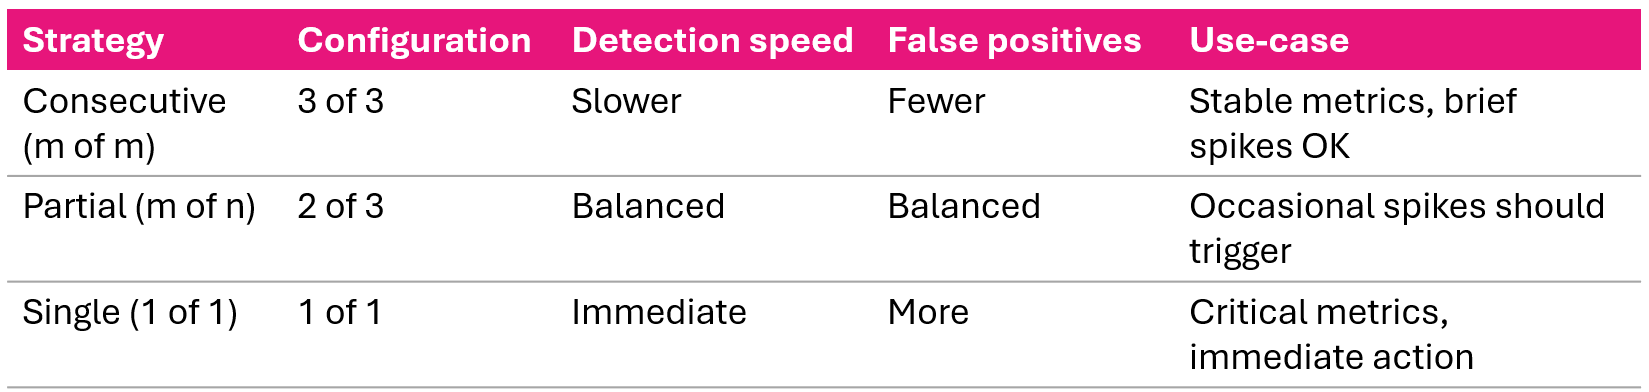
評估策略


三種警示評估策略:連續、部分、單次越界,以及靈敏度取捨

AWS 監控與疑難排解

警示動作與觸發條件


觸發時機

  • OK
  • ALARM
  • INSUFFICIENT_DATA


動作類型

  • SNS 通知
  • Auto Scaling
  • EC2 動作(stop/terminate/reboot/recover)
  • Systems Manager
AWS 監控與疑難排解

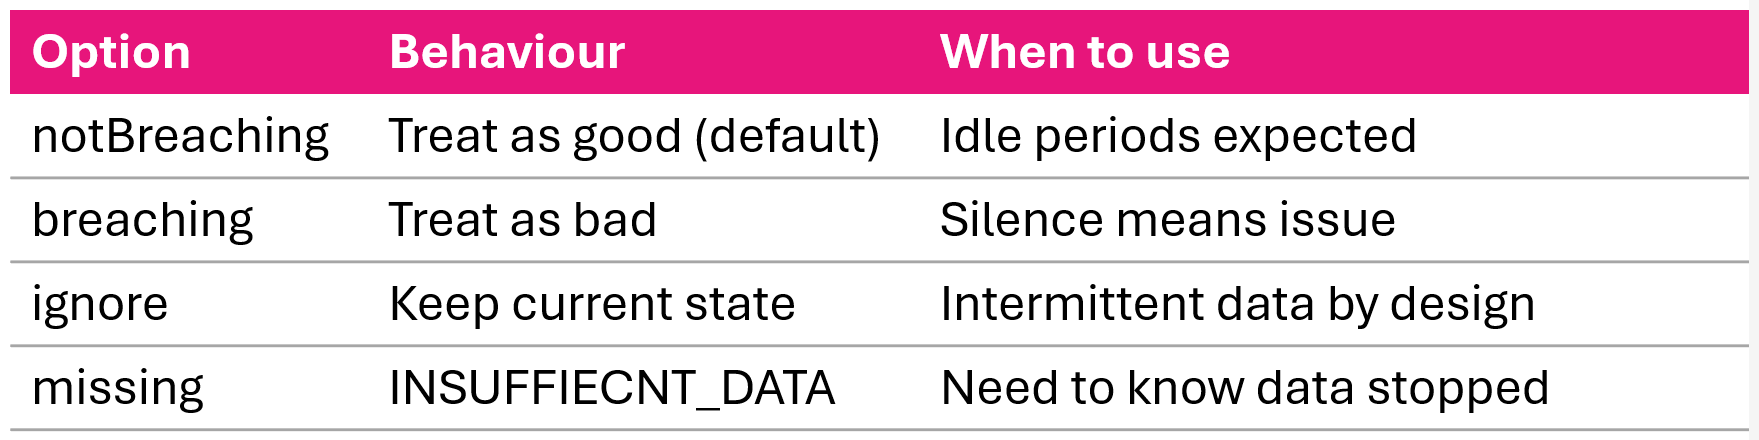
遺漏資料的處理行為


遺漏資料行為選項:notBreaching、breaching、ignore 與 missing

AWS 監控與疑難排解

建立標準警示:AWS CLI

aws cloudwatch put-metric-alarm \
  --alarm-name HighCPUUtilization \
  --alarm-description "Alert when CPU exceeds 80%" \
  --metric-name CPUUtilization \
  --namespace AWS/EC2 \
  --statistic Average \
  --period 300 \
  --evaluation-periods 2 \
  --threshold 80 \
  --comparison-operator GreaterThanThreshold \
  --dimensions Name=InstanceId,Value=i-1234567890abcdef0 \
  --alarm-actions arn:aws:sns:us-east-1:123456789012:my-topic
AWS 監控與疑難排解

複合警示:概念與用途

問題

  • 多個相關警示各自觸發=疲勞通知

解法

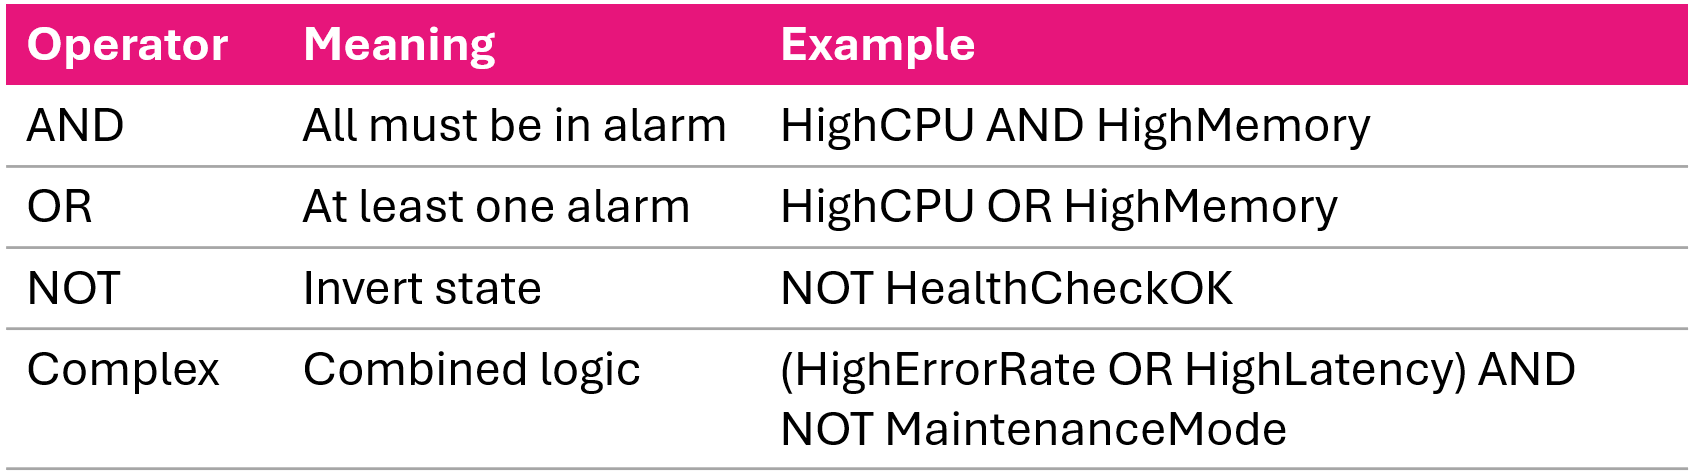
  • 用邏輯運算子組合警示

複合警示邏輯:以 AND、OR、NOT 組合子警示

AWS 監控與疑難排解

建立複合警示:AWS CLI

aws cloudwatch put-composite-alarm \
  --alarm-name CriticalSystemHealth \
  --alarm-description "Critical when CPU and Memory both high" \
  --actions-enabled \
  --alarm-actions arn:aws:sns:us-east-1:123456789012:critical-alerts \
  --alarm-rule "ALARM(HighCPUAlarm) AND ALARM(HighMemoryAlarm)"
複雜規則範例
--alarm-rule "(ALARM(HighErrorRate) OR ALARM(HighLatency)) \
  AND NOT ALARM(MaintenanceMode)"
AWS 監控與疑難排解

臨界值選擇策略

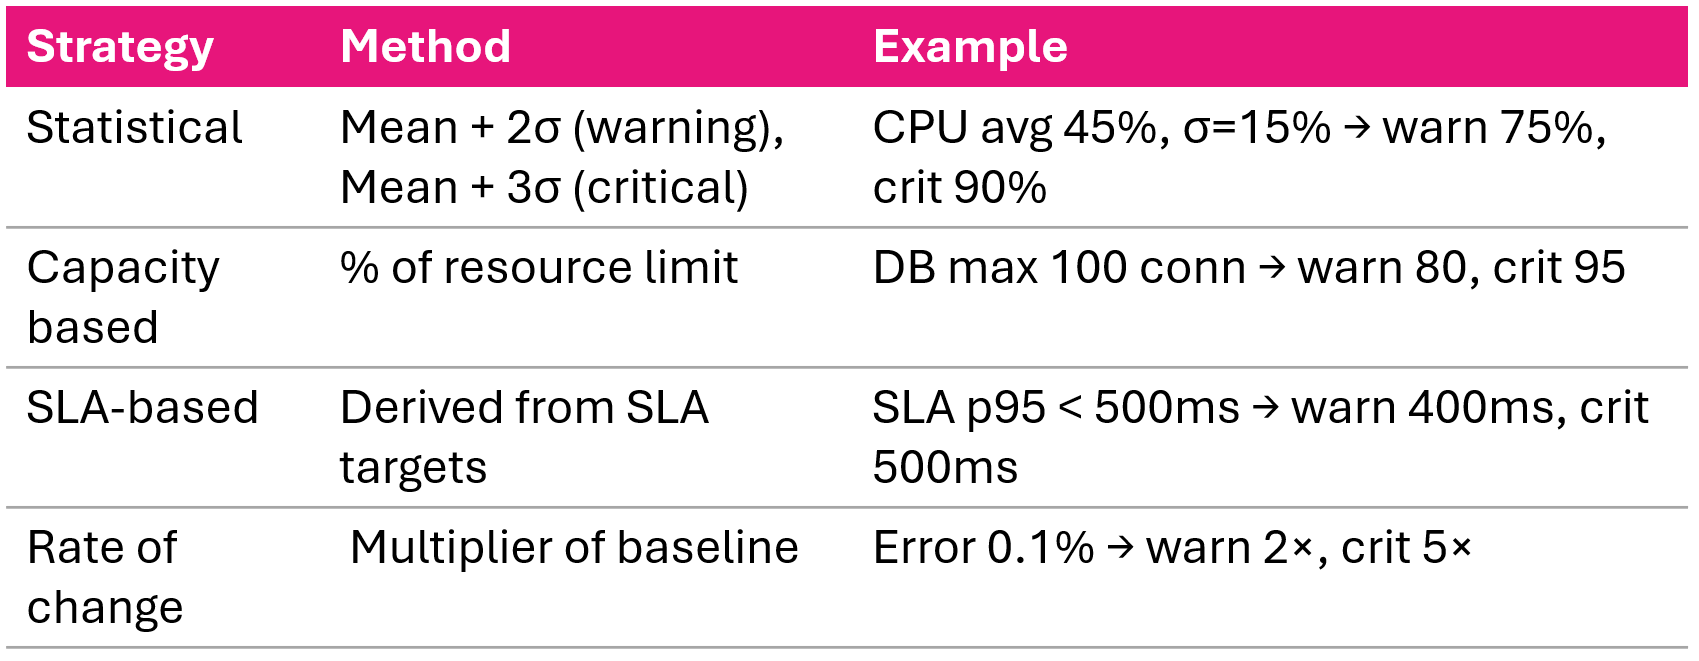
臨界值選擇策略:統計基準、容量上限、SLA 目標、變化率

AWS 監控與疑難排解

多層級警示策略


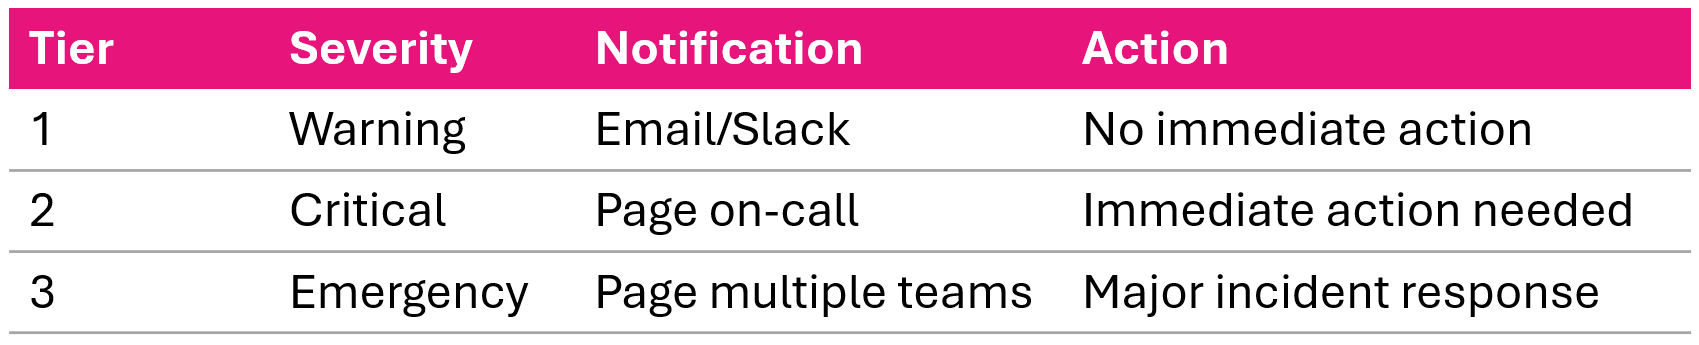
多層級警示回應:warning、critical、emergency 分流至不同 SNS 主題

範例: CPU Warning 設 75%,Critical 設 90%,各連到不同 SNS 主題

AWS 監控與疑難排解

異常偵測警示

aws cloudwatch put-metric-alarm \
  --alarm-name AnomalousTraffic \
  --comparison-operator LessThanLowerOrGreaterThanUpperThreshold \
  --metrics '[
    {"Id":"m1","MetricStat":{"Metric":{"Namespace":"AWS/ApplicationELB",
      "MetricName":"RequestCount"},"Period":300,"Stat":"Average"}},
    {"Id":"e1","Expression":"ANOMALY_DETECTION_BAND(m1, 2)"}
  ]'
  • ML 模型學習指標的正常行為
  • 建立可調的動態臨界帶
  • 會適應每日/每週模式
  • 減少手動調整臨界值
AWS 監控與疑難排解

Resource alarms: Lambda and ALB

Lambda 警示

建議的 Lambda 警示:監看錯誤數、節流、執行時間接近逾時

ALB 警示

建議的 ALB 警示:監看目標回應時間、不健康主機與 5xx 錯誤數

AWS 監控與疑難排解

Alarm management recommended practices

  • Naming: <Service>-<Metric>-<Resource>-<Severity>
  • Descriptions: what's monitored, threshold, troubleshooting hints, runbook links
  • Tags: Environment, Team, Severity
  • Review monthly: adjust thresholds, remove obsolete, update actions
aws cloudwatch set-alarm-state \
  --alarm-name MyAlarm \
  --state-value ALARM \
  --state-reason "Testing alarm notification"
AWS 監控與疑難排解

Video summary

  • Three alarm states: OK, ALARM, INSUFFICIENT_DATA
  • Evaluation strategies: consecutive, partial, single breach
  • Composite alarms combine multiple alarms with AND, OR, NOT
  • Four threshold strategies: statistical, capacity, SLA, rate of change
  • Multi-tier alerting: warning → critical → emergency
  • Resource alarms for Lambda (errors, throttles, duration) and ALB (5xx, latency)
AWS 監控與疑難排解

Let's practice!

AWS 監控與疑難排解

Preparing Video For Download...