將重抽樣視為一種特殊的 Monte Carlo 模擬

Python 的 Monte Carlo 模擬

Izzy Weber

Curriculum Manager, DataCamp

將重抽樣視為一種特殊的 Monte Carlo 模擬


Monte Carlo 模擬

  • 從機率分配取樣
  • 分配可已知或假設
  • 依據歷史資料或專家經驗選擇合適分配


重抽樣(Resampling)

  • 從既有資料隨機取樣
  • 既有資料代表隱含的機率分配
  • 假設資料具代表性
Python 的 Monte Carlo 模擬

重抽樣方法

  1. 不放回抽樣
    • 用於抽取隨機樣本
  2. 放回抽樣(或 bootstrapping)
    • 用於估計幾乎任何統計量的抽樣分配
  3. 置換(Permutation)
    • 常用於比較兩組
Python 的 Monte Carlo 模擬

不放回抽樣

在新英格蘭 6 州中隨機抽取兩個不同的州

import random
def two_random_ne_states():

ne_states=["Maine", "Vermont", "New Hampshire", "Massachusetts", "Connecticut", "Rhode Island"]
return(random.sample(ne_states, 2))


two_random_ne_states()
['Massachusetts', 'Connecticut']
['New Hampshire', 'Maine']
Python 的 Monte Carlo 模擬

Bootstrapping(自助法)

估計 NBA 球員身高平均值的 95% 信賴區間

import random
import numpy as np

nba_heights = [196, 191, 198, 216, 188, 185, 211, 201,
               188, 191, 201, 208, 191, 183, 196]
simu_heights = []

for i in range(1000): bootstrap_sample = random.choices(nba_heights, k=15) simu_heights.append(np.mean(bootstrap_sample))
upper = np.quantile(simu_heights, 0.975) lower = np.quantile(simu_heights, 0.025) print([np.mean(simu_heights), lower, upper])
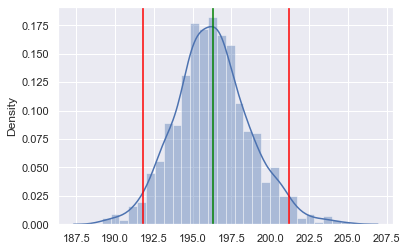
[196.26666666666668, 191.8, 201.2]
Python 的 Monte Carlo 模擬

Bootstrap 結果視覺化

繪圖函式庫:

  • seaborn
  • matplotlib
import seaborn as sns
import matplotlib.pyplot as plt

sns.displot(simu_heights)
plt.axvline(191.8, color="red")
plt.axvline(201.2, color="red")
plt.axvline(196.3, color="green")


模擬身高的分配圖

Python 的 Monte Carlo 模擬

置換(Permutation)

估計 NBA 球員與美國成年男性身高平均差的 95% 信賴區間

us_heights = [165, 185, 179, 187, 193, 180, 178, 179, 171, 176, 
              169, 160, 140, 199, 176, 185, 175, 196, 190, 176]
nba_heights = [196, 191, 198, 216, 188, 185, 211, 201, 188, 191, 201, 208, 191, 183, 196]

all_heights = us_heights + nba_heights
simu_diff = [] for i in range(1000): perm_sample = np.random.permutation(all_heights) perm_nba, perm_adult = perm_sample[0:15], perm_sample[15:35]
perm_diff = np.mean(perm_nba) - np.mean(perm_adult) simu_diff.append(perm_diff)
Python 的 Monte Carlo 模擬

置換結果

NBA 與美國成年男性身高的平均差:

np.mean(nba_heights) - np.mean(us_adult_height)
18.31666666666669

兩個隨機清單置換的 95% 信賴區間:

upper = np.quantile(simu_diff, 0.975)
lower = np.quantile(simu_diff, 0.025)
print([lower, upper])
[-10.033333333333331, 10.033333333333331]
Python 的 Monte Carlo 模擬

置換結果視覺化

sns.distplot(simu_diff)
plt.axvline(-10.03, color="red")
plt.axvline(10.03, color="red")
plt.axvline(18.32, color="green")
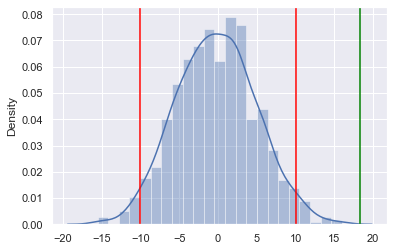
模擬身高差異的分配圖

Python 的 Monte Carlo 模擬

一起來練習吧!

Python 的 Monte Carlo 模擬

Preparing Video For Download...