選擇機率分佈

Python 的 Monte Carlo 模擬

Izzy Weber

Curriculum Manager, DataCamp

最大概似估計(MLE)

  • 透過衡量擬合度來選擇機率分佈
    • 在給定資料下,機率最大者視為最佳
  • 使用 SciPy 的 .nnlf() 計算「負」對數概似函式
  • .nnlf() 算得的 MLE 值越低,擬合越好
Python 的 Monte Carlo 模擬

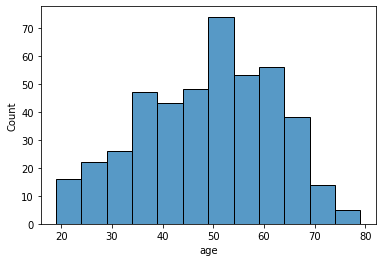
為年齡變數選分佈

sns.histplot(dia["age"])

糖尿病資料集中年齡變數的直方圖

Python 的 Monte Carlo 模擬

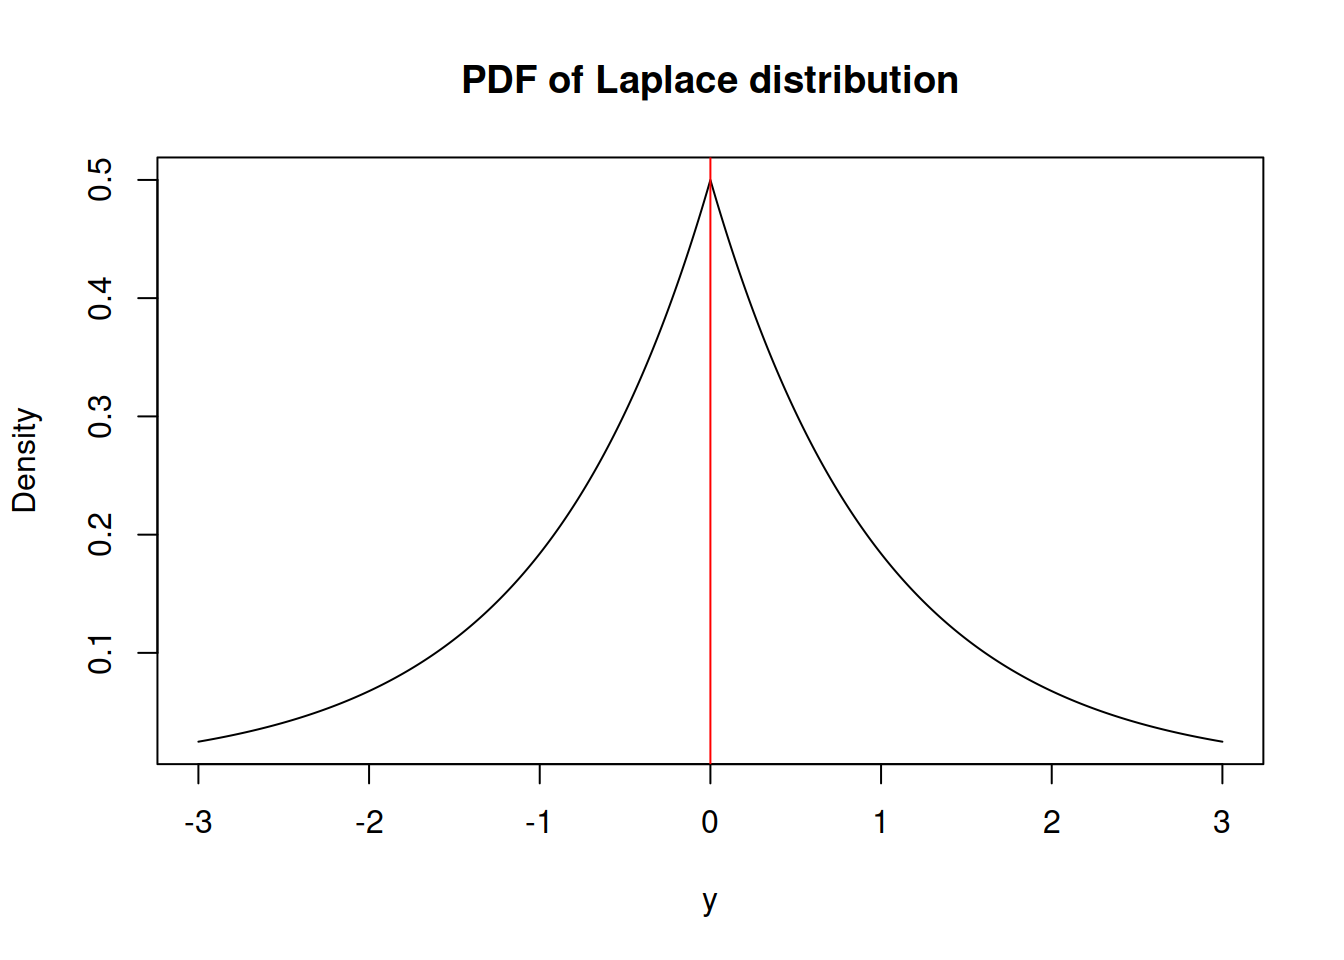
候選分佈

distributions = [st.laplace, st.norm, st.expon]

Laplace 分佈的 PDF

Python 的 Monte Carlo 模擬

在候選分佈間做選擇

mles = []


for distribution in distributions: pars = distribution.fit(dia["age"])
mle = distribution.nnlf(pars, dia["age"])
mles.append(mle)
print(mles)
[1797.8467779878652, 1764.0693689033028, 1938.171599681118]
Python 的 Monte Carlo 模擬

在候選分佈間做選擇

for var in ["age", "bmi", "bp", "tc", "ldl", "hdl", "tch", "ltg", "glu"]:

distributions = [st.laplace, st.norm, st.expon] mles = []
for distribution in distributions: pars = distribution.fit(dia[var]) mle = distribution.nnlf(pars, dia[var]) mles.append(mle)
best_fit = sorted(zip(distributions, mles), key=lambda d: d[1])[0] print(f"Best fit reached using {best_fit[0].name}, \ MLE value: {best_fit[1]}, for variable {var}")
Python 的 Monte Carlo 模擬

評估結果

Best fit reached using norm, MLE value: 1764.0693689033028, for variable age
Best fit reached using norm, MLE value: 1283.356127017369, for variable bmi
Best fit reached using norm, MLE value: 1787.7746251622739, for variable bp
Best fit reached using norm, MLE value: 2193.1564373753627, for variable to
Best fit reached using norm, MLE value: 2136.0440476305284, for variable ldl
Best fit reached using norm, MLE value: 1758.1350738323013, for variable hdl
Best fit reached using norm, MLE value: 739.3762494786798, for variable tch
Best fit reached using norm, MLE value: 339.6620870566908, for variable ltg
Best fit reached using norm, MLE value: 1706.0467588930867, for variable glu
Python 的 Monte Carlo 模擬

一起來練習吧!

Python 的 Monte Carlo 模擬

Preparing Video For Download...