模型估計與概似

Python 線性建模入門

Jason Vestuto

Data Scientist

估計

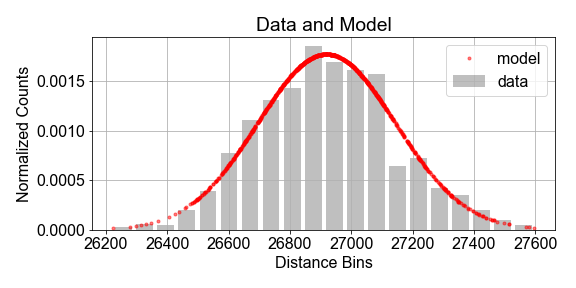
資料的直方圖:以距離分箱的正規化計數為灰色長條,模型為紅色高斯鐘形曲線,貼合灰條頂部

Python 線性建模入門

估計

# Define gaussian model function
def gaussian_model(x, mu, sigma):
    coeff_part = 1/(np.sqrt(2 * np.pi * sigma**2))
    exp_part = np.exp( - (x - mu)**2 / (2 * sigma**2) )
    return coeff_part*exp_part
# Compute sample statistics
mean = np.mean(sample)
stdev = np.std(sample)
# Model the population using sample statistics
population_model = gaussian(sample, mu=mean, sigma=stdev)
Python 線性建模入門

概似 vs 機率

  • 條件機率:$P( \text{outcome A} | \text{given B})$
  • 機率:$P( \text{data} | \text{model} )$
  • 概似:$L( \text{model} | \text{data} )$
Python 線性建模入門

計算概似

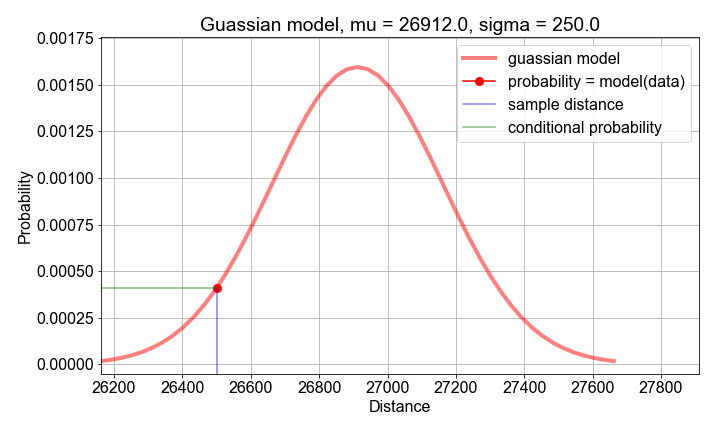
機率對距離的曲線圖:紅色高斯鐘形曲線,左側邊緣附近有一點,並以水平與垂直線段連到兩軸

Python 線性建模入門

計算概似

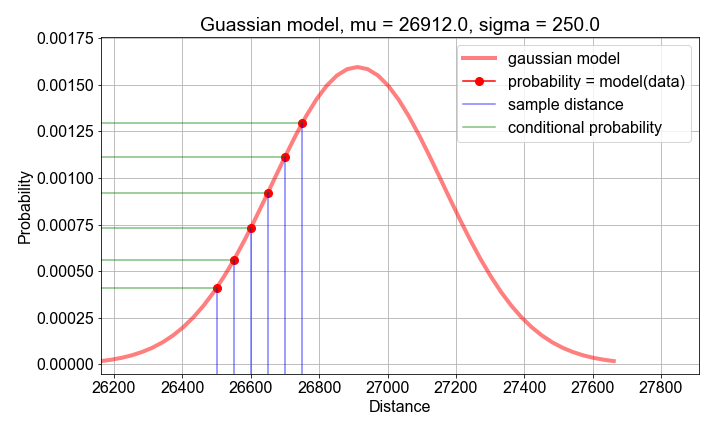
機率對距離的曲線圖:紅色高斯鐘形曲線,從左側到中心有 6 個點,並以水平與垂直線段連到兩軸

Python 線性建模入門

由機率得概似

# Guess parameters
mu_guess = np.mean(sample_distances)
sigma_guess = np.std(sample_distances)
# For each sample point, compute a probability
probabilities = np.zeros(len(sample_distances))
for n, distance in enumerate(sample_distances):
    probabilities[n] = gaussian_model(distance, mu=mu_guess, sigma=sigma_guess)
likelihood = np.product(probs)
loglikelihood = np.sum(np.log(probs))
Python 線性建模入門

最大概似估計

# Create an array of mu guesses
low_guess = sample_mean - 2*sample_stdev
high_guess = sample_mean + 2*sample_stdev
mu_guesses = np.linspace(low_guess, high_guess, 101)
# Compute the loglikelihood for each guess
loglikelihoods = np.zeros(len(mu_guesses))
for n, mu_guess in enumerate(mu_guesses):
    loglikelihoods[n] = compute_loglikelihood(sample_distances, mu=mu_guess, sigma=sample_stdev)
# Find the best guess
max_loglikelihood = np.max(loglikelihoods)
best_mu = mu_guesses[loglikelihoods == max_loglikelihood]
Python 線性建模入門

最大概似估計

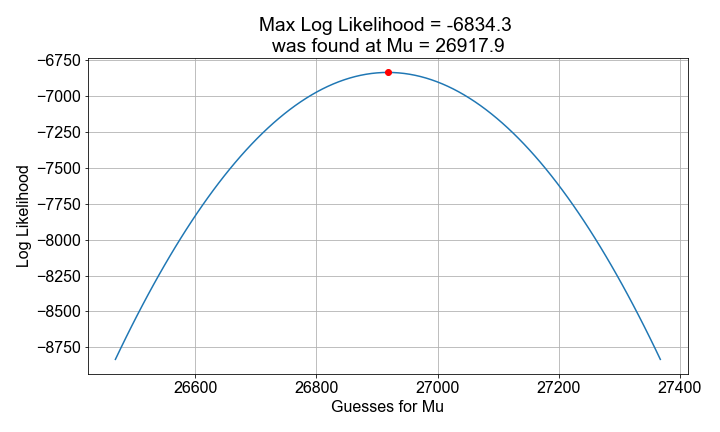
向下開口的拋物線,最大值處有紅點,座標軸為 loglikelihood 與 mu 值

Python 線性建模入門

一起來練習吧!

Python 線性建模入門

Preparing Video For Download...