Python 線性建模入門
Jason Vestuto
Data Scientist
# Mean
mean = sum(x)/len(x)
# Deviation, sometimes called "centering"
dx = x - np.mean(x)
# Variance
variance = np.mean(dx*dx)
# Standard Deviation
stdev = np.sqrt(variance)
# Deviations of two variables
dx = x - np.mean(x)
dy = y - np.mean(y)
# Co-vary means to vary together
deviation_products = dx*dy
# Covariance as the mean
covariance = np.mean(dx*dy)
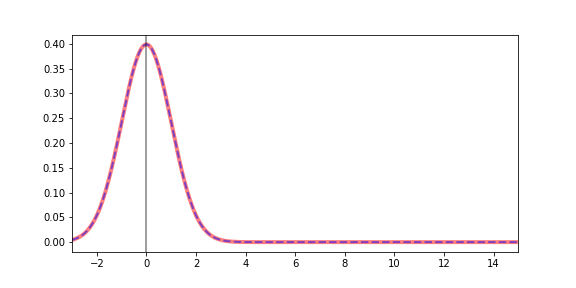
# Divide deviations by standard deviation
zx = dx/np.std(x)
zy = dy/np.std(y)
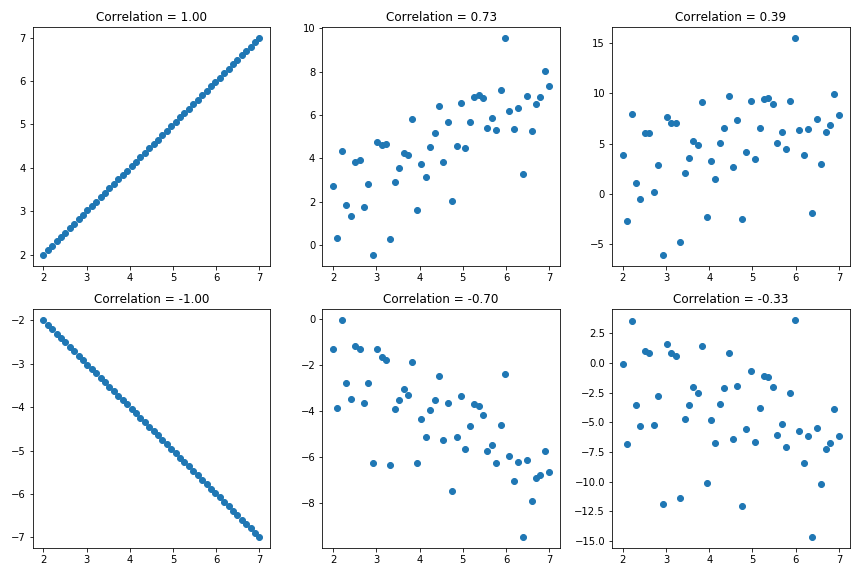
# Mean of the normalize deviations
correlation = np.mean(zx*zy)