模型錯誤與隨機性

Python 線性建模入門

Jason Vestuto

Data Scientist

錯誤類型

  1. 測量誤差
    • 例如:感測器故障、紀錄錯誤
  2. 抽樣偏誤
    • 例如:只取 8 月的溫度(最熱的時期)
  3. 隨機機率
Python 線性建模入門

虛無假設

問題:我們觀察到的效果是關係造成,還是只是隨機機率?

回答:檢查虛無假設。

Python 線性建模入門

排序資料

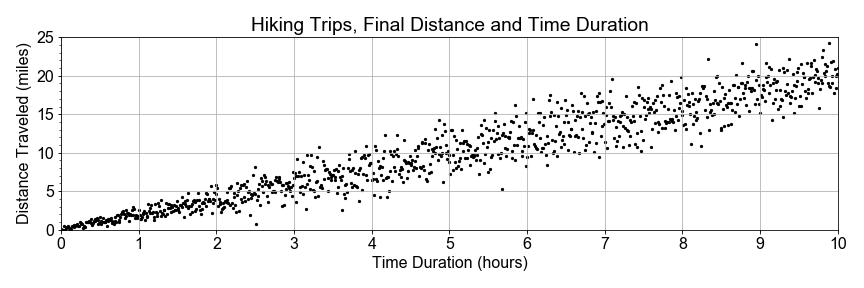
健行旅程資料的散佈圖,座標軸為英里距離與小時時間

Python 線性建模入門

分組資料

健行旅程資料的散佈圖,時間少於 5 小時者以紅色顯示,較長時間者以藍色顯示,座標軸同上

Python 線性建模入門

分組資料

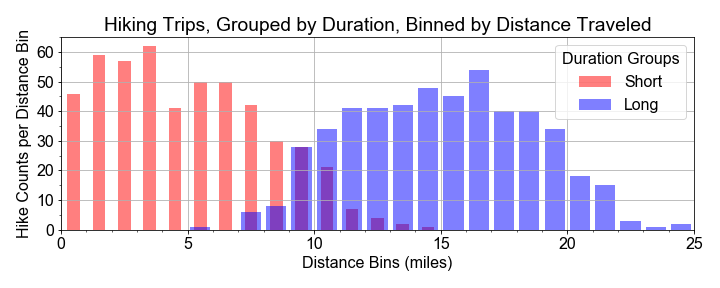
兩個大致鐘形的長條圖,紅色為短時程旅程,中心約 5 英里;藍色為長時程旅程,中心約 15 英里

  • 短時程組,平均 = 5
  • 長時程組,平均 = 15
Python 線性建模入門

檢定統計量

# Group into early and late times
group_short = sample_distances[times < 5]
group_long = sample_distances[times > 5]
# Resample distributions
resample_short = np.random.choice(group_short, size=500, replace=True)
resample_long = np.random.choice(group_long, size=500, replace=True)
# Test Statistic
test_statistic = resample_long - resample_short
# Effect size as mean of test statistic distribution
effect_size = np.mean(test_statistic)
Python 線性建模入門

洗牌並重新分組

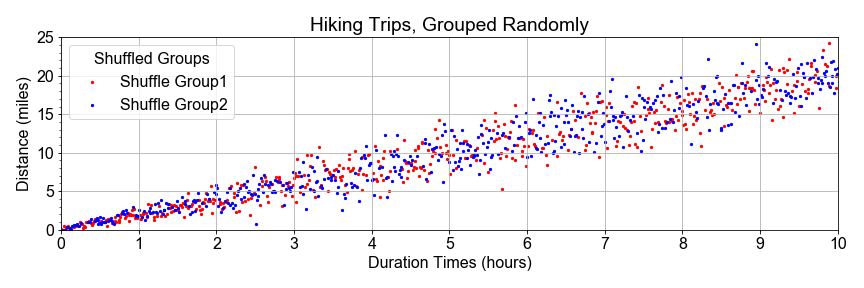
健行旅程資料的散佈圖,紅色與藍色在所有時間範圍內交錯分佈

Python 線性建模入門

洗牌與重分組

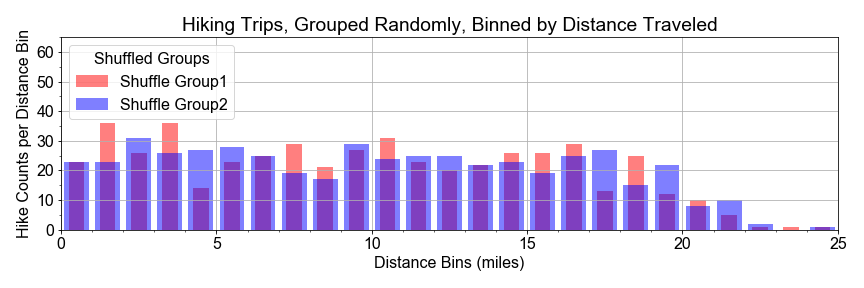
兩個幾乎完全重疊的長條圖,範圍 0 到 25 英里,形狀相近

Python 線性建模入門

洗牌與切分

# Concatenate and Shuffle
shuffle_bucket = np.concatenate((group_short, group_long))
np.random.shuffle(shuffle_bucket)
# Split in the middle
slice_index = len(shuffle_bucket)//2
shuffled_half1 = shuffle_bucket[0:slice_index]
shuffled_half2 = shuffle_bucket[slice_index+1:]
Python 線性建模入門

重抽樣並再次檢定

# Resample shuffled populations
shuffled_sample1 = np.random.choice(shuffled_half1, size=500, replace=True)
shuffled_sample2 = np.random.choice(shuffled_half2, size=500, replace=True)
# Recompute effect size
shuffled_test_statistic = shuffled_sample2 - shuffled_sample1
effect_size = np.mean(shuffled_test_statistic)
Python 線性建模入門

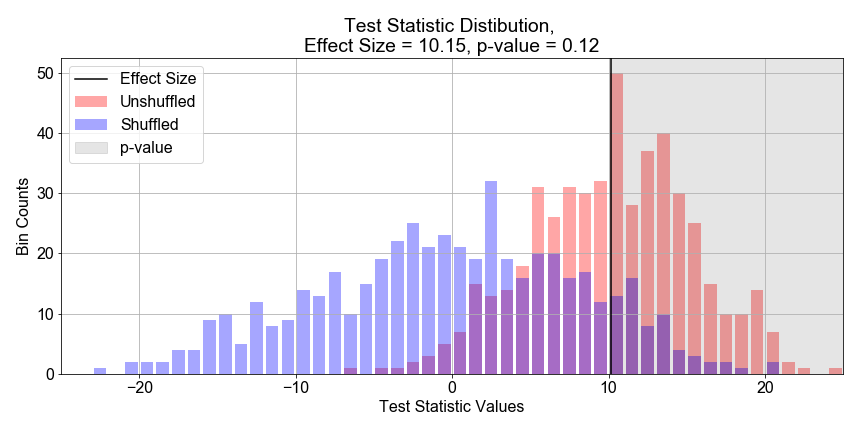
p 值

長條圖以箱數對檢定統計量區間作圖,藍色分佈以 x=0 為中心且較寬,紅色分佈以 x=10 為中心且較窄,並在 x=10 有一條垂直黑線

Python 線性建模入門

一起來練習吧!

Python 線性建模入門

Preparing Video For Download...