在 R 中操作時間序列資料
Harrison Brown
Graduate Researcher in Geography
滾動視窗:
擴張視窗:
視窗寬度遞增:
可用資料的摘要為何?
起點固定:
R 的擴張視窗:
zoo::rollapply()
width
擴張視窗寬度:
1
2
3
4
產生數列的函式:
base::seq_along()
seq_along(daily_temp)
[1] 1 2 3 4 5 6 7 8 9 ...
    ... 363 364 365
exp_widths <- seq_along(daily_temp)

exp_widths
[1] 1 2 3 4 5 ... 363 364 365
temp_expand <-
  rollapply(
    data = daily_temp,
    FUN = mean,
    width = exp_widths,
    # Alignment must be 'right'
    align = 'right'
  )
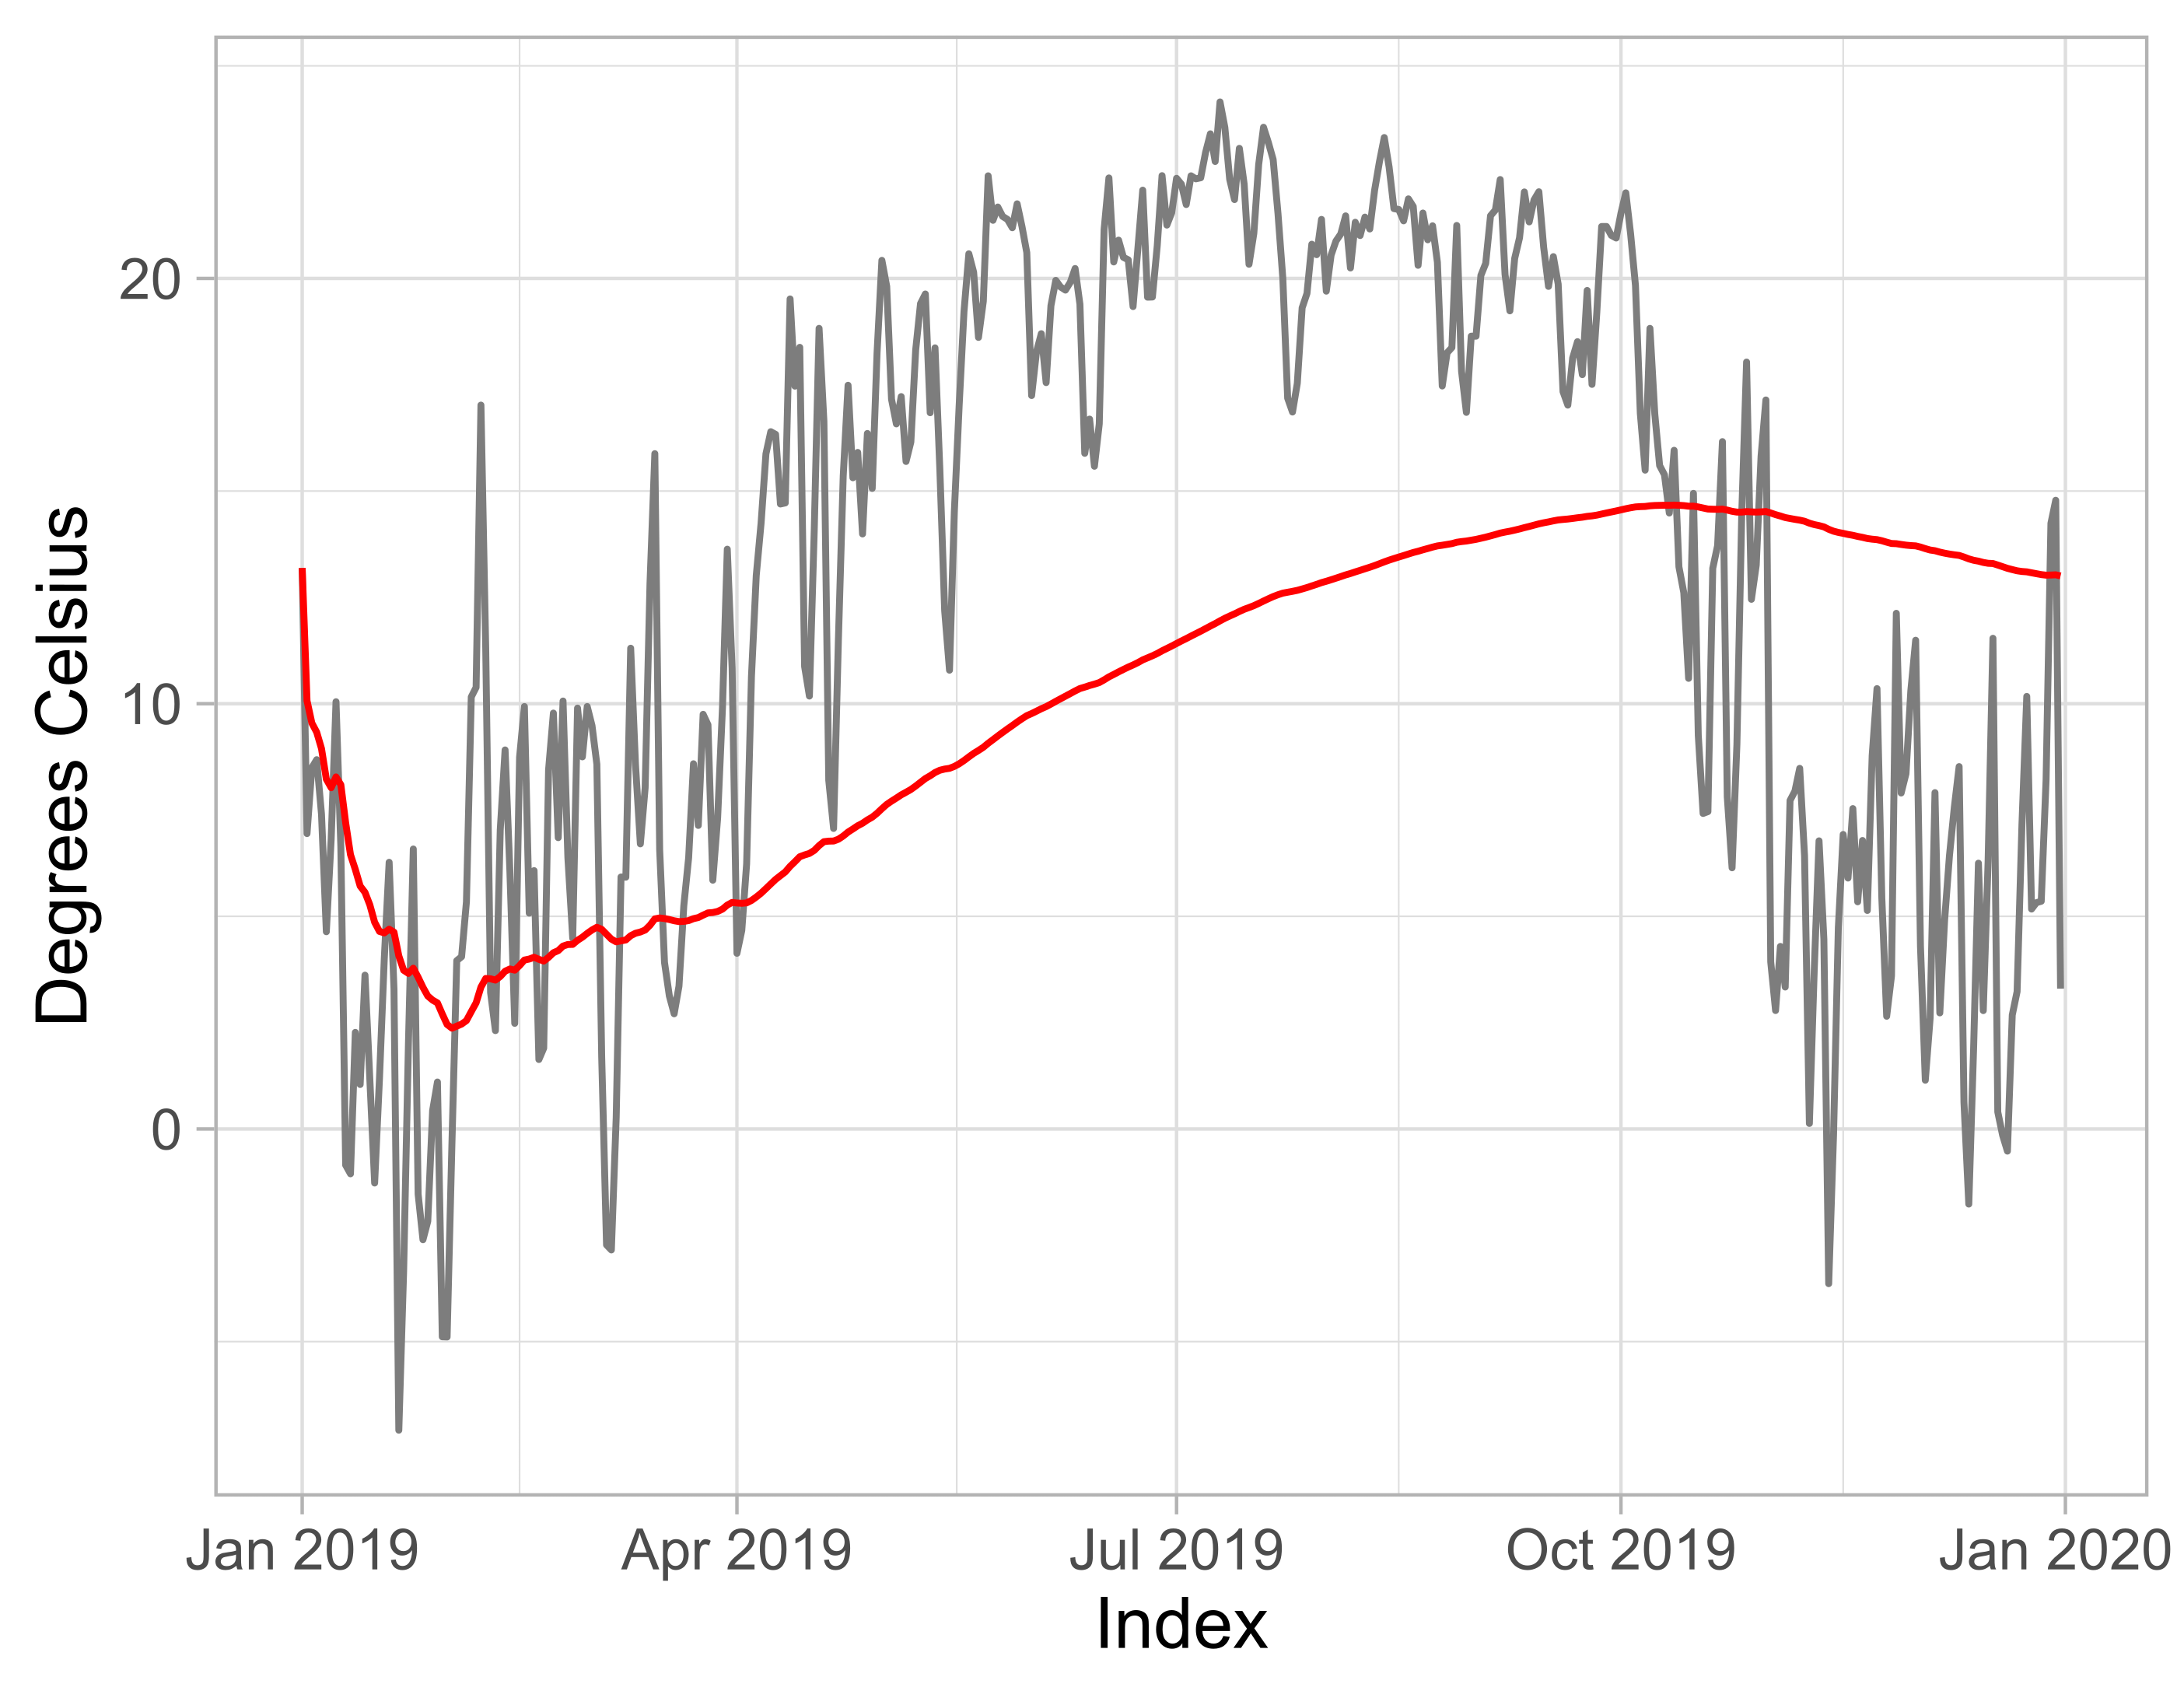
ggplot() +
# 原始資料
  geom_line(data = daily_temp,
            aes(x = Index,
            y = daily_temp),
            color = 'grey50') +

# 擴張視窗圖
  geom_line(data = temp_expand,
            aes(x = Index,
                y = temp_expand),
            color = 'red') +
  theme_light() +
  labs(y = 'Degrees Celsius')
ggplot() + # 原始資料 geom_line(data = daily_temp, aes(x = Index, y = daily_temp), color = 'grey50') +
# 擴張視窗圖 geom_line(data = temp_expand, aes(x = Index, y = temp_expand), color = 'red') + theme_light() + labs(y = 'Degrees Celsius')