各產業財務比率一瞥
使用 Python 分析財務報表

Rohan Chatterjee
Risk Modeler
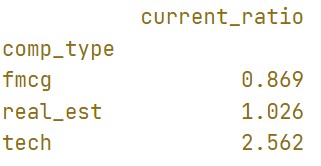
平均流動比率
- 流動比率 = $\dfrac{\text{Current Assets}}{\text{Current Liabilities}}$
- 各產業平均流動比率:
balance_sheet["current_ratio"] =
                      balance_sheet["Total Current Assets"]/
                      balance_sheet["Total Current Liabilities"]
balance_sheet.pivot_table(index="comp_type", values="current_ratio")
平均負債權益比
- 負債權益比 = $\dfrac{\text{Total liabilities}}{\text{Total shareholders equity}}$
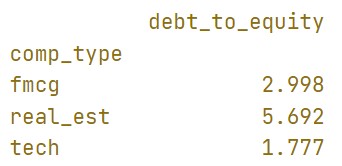
- 各產業平均負債權益比:
balance_sheet["debt_to_equity"] =
                      balance_sheet["Total Liabilities"]/
                      balance_sheet["Total Shareholders Equity"]
balance_sheet.pivot_table(index="comp_type", values="debt_to_equity")
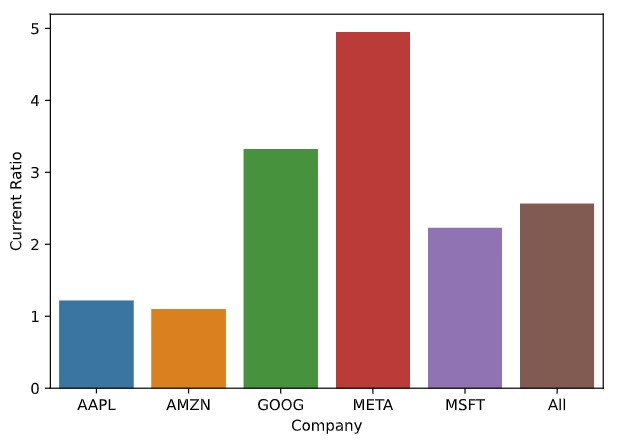
以圖比較與產業平均的差異
製作長條圖
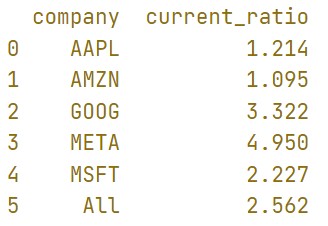
plot = balance_sheet_tech.pivot_table(index="company", values = "current_ratio",
                                      margins = True).reset_index()
plot
製作長條圖
sns.barplot(data=plot, x = "company", y = "current_ratio")
plt.ylabel("Current Ratio"), plt.xlabel("Company")
plt.show()

