使用 pandas 計算財務比率
使用 Python 分析財務報表

Rohan Chatterjee
Risk Modeler
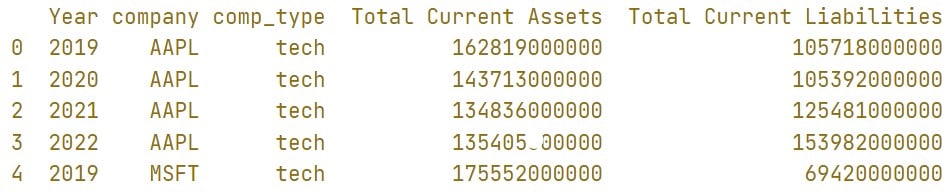
資產負債表資料結構
- 已將資產負債表資料載入為
pandas的 DataFrame,名稱為balance_sheet。
----CODE_GLUE----
```print(balance_sheet.head())
----CODE_GLUE----
`
計算流動比率
balance_sheet["current_ratio"] = balance_sheet["Total Current Assets"] /
                                 balance_sheet["Total Current Liabilities"]
print(balance_sheet.head())

用 .groupby() 取得分組結果
- 取得各產業的平均流動比率:
balance_sheet.groupby("comp_type")["current_ratio"].mean()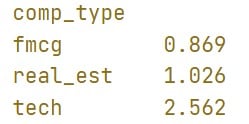
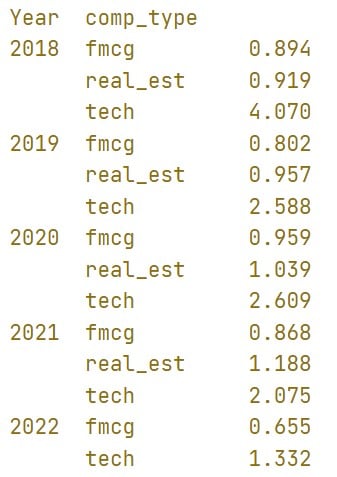
用 .groupby() 取得分組結果
balance_sheet.groupby(["Year","comp_type"])["current_ratio"].mean()
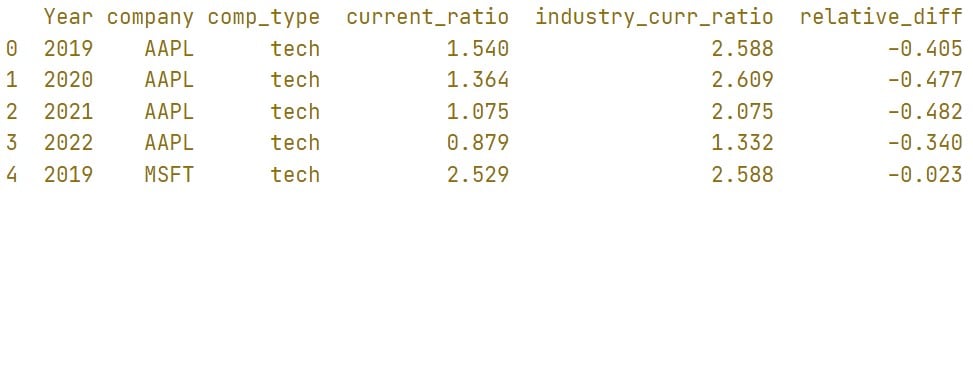
使用 groupby().transform()
.transform()可在.groupby()之後使用,依每列所屬群組,將分組結果回填到各列。balance_sheet["industry_curr_ratio"] = balance_sheet.groupby([ "Year","comp_type"])["current_ratio"].transform("mean") print(balance_sheet.head())

使用 .groupby().transform()
balance_sheet["relative_diff"] =
                            (balance_sheet["current_ratio"] /
                             balance_sheet["industry_curr_ratio"]) - 1