在 R 中處理遺漏值
Nicholas Tierney
Instructor
ggplot(airquality,
       aes(x = Ozone,
           y = Solar.R)) +
  geom_point()
Warning message:
Removed 42 rows containing
missing values (geom_point).
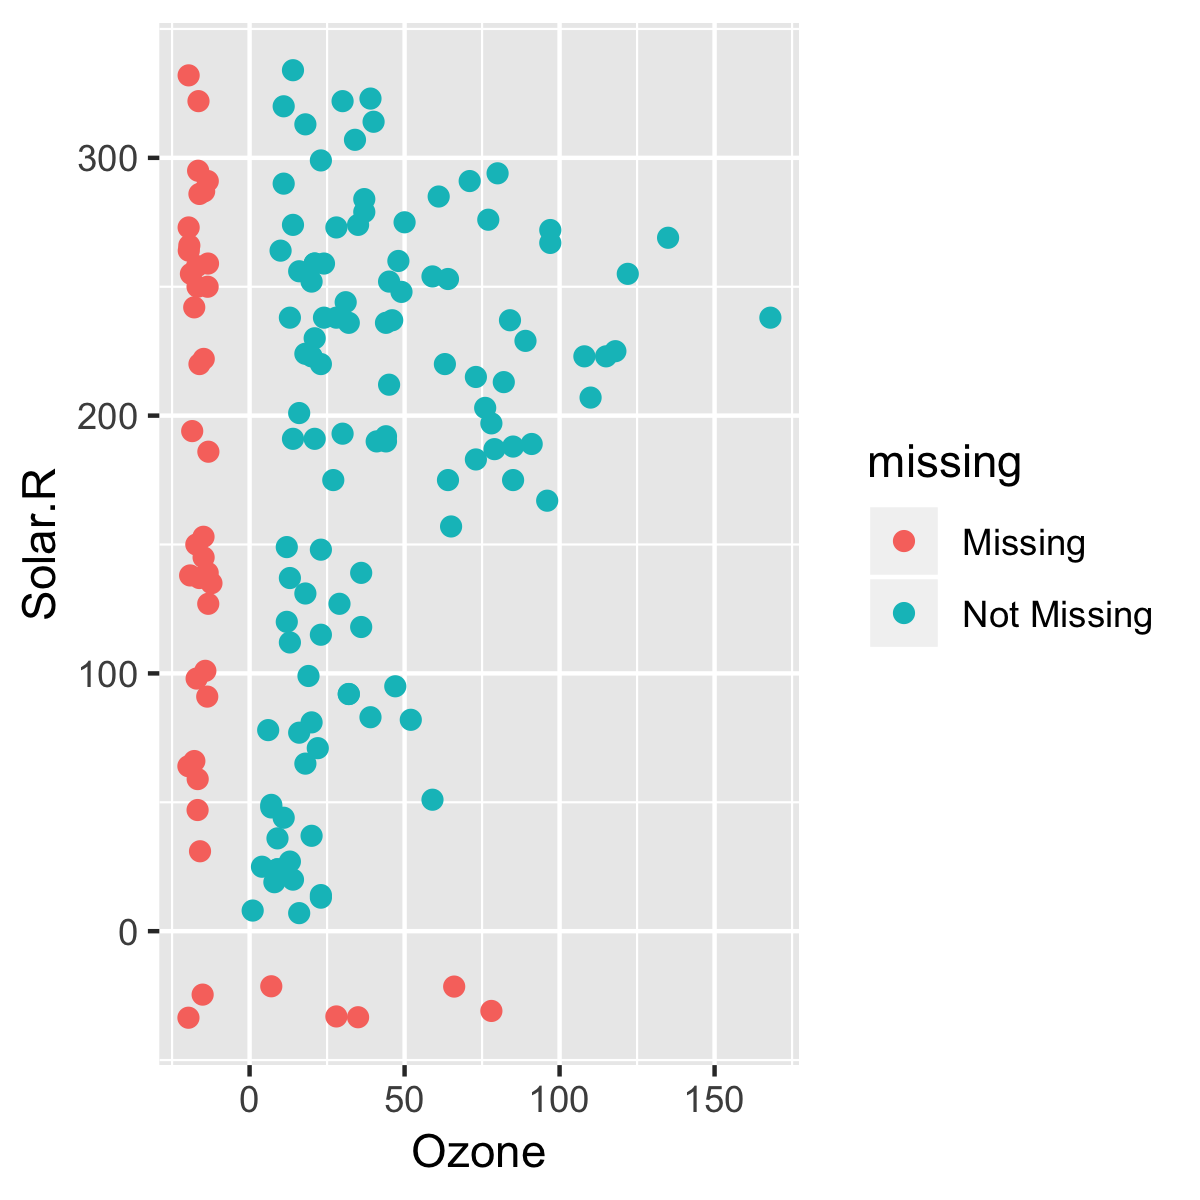
ggplot(airquality,
       aes(x = Ozone,
           y = Solar.R)) +
  geom_miss_point()
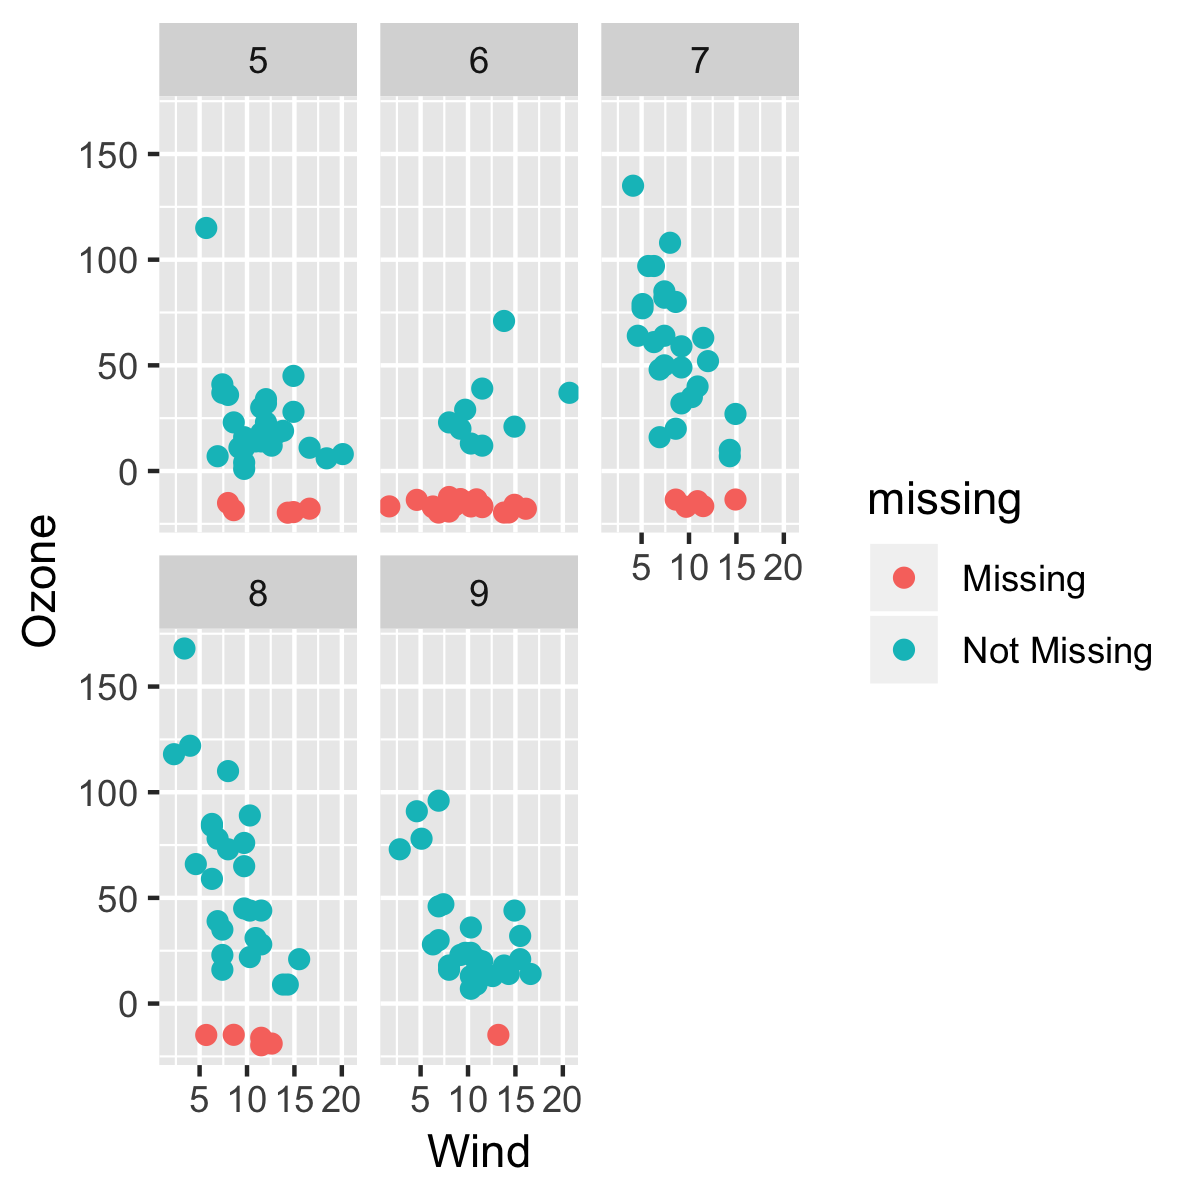
ggplot(airquality,
       aes(x = Wind,
           y = Ozone)) +
  geom_miss_point() +
  facet_wrap(~ Month)
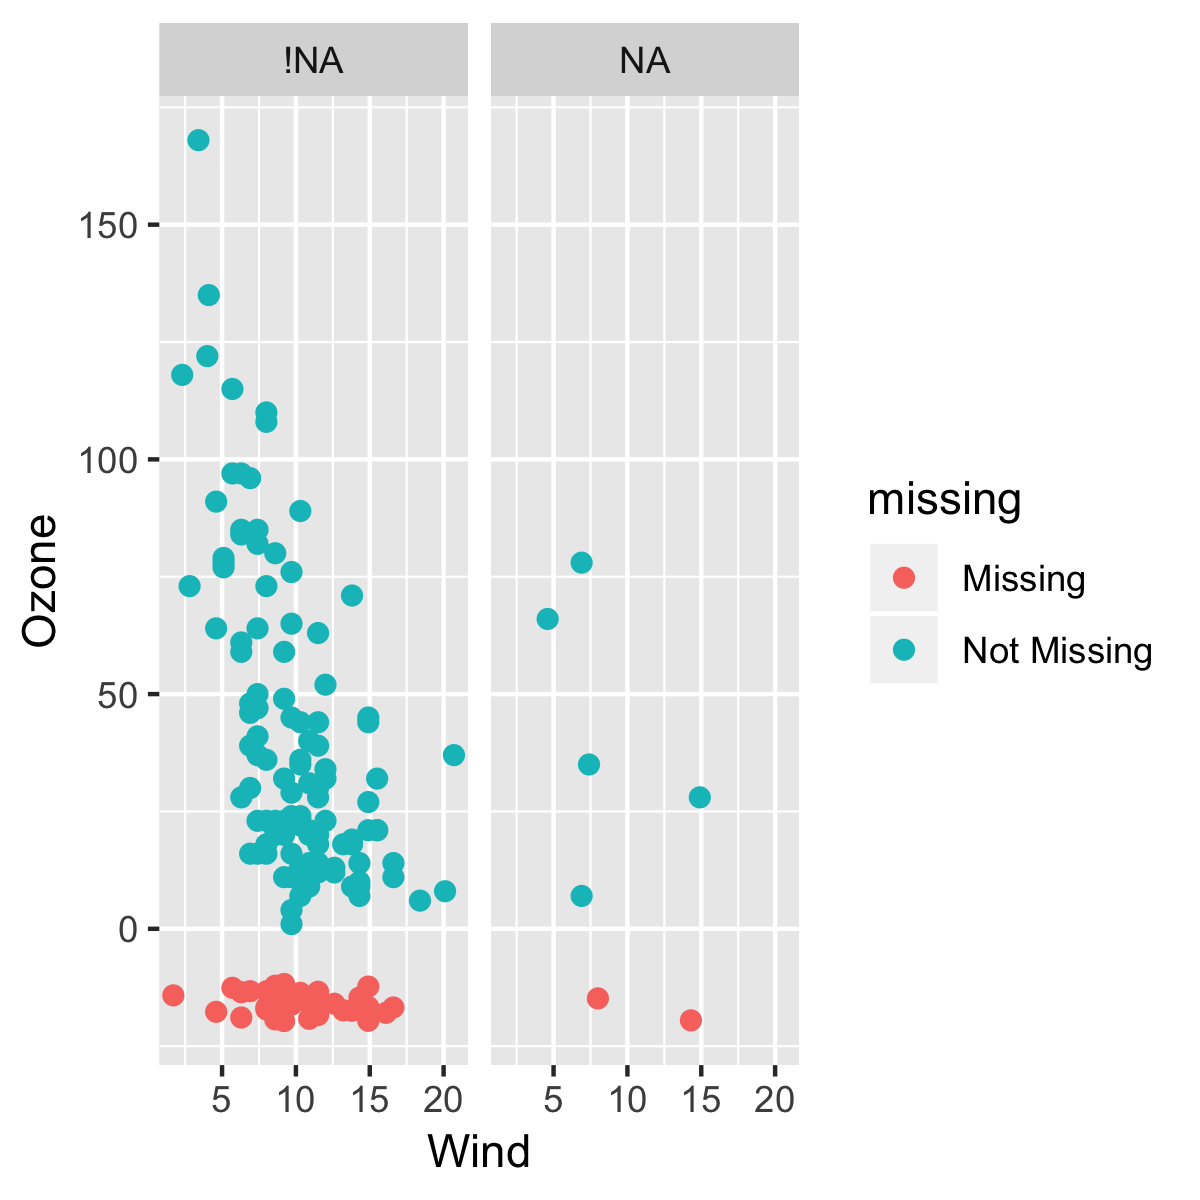
airquality %>%
  bind_shadow() %>%
ggplot(aes(x = Wind,
           y = Ozone)) +
  geom_miss_point() +
  facet_wrap(~ Solar.R_NA)