模擬式推論

R 中的線性迴歸推論

Jo Hardin

Professor, Pomona College
R 中的線性迴歸推論

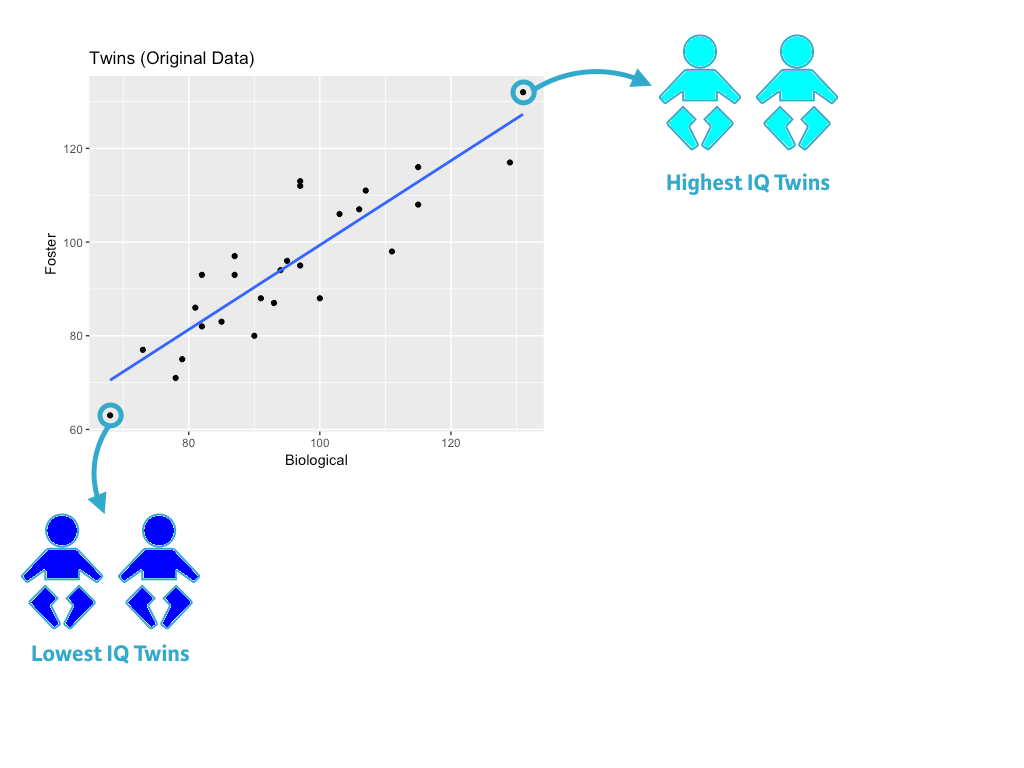
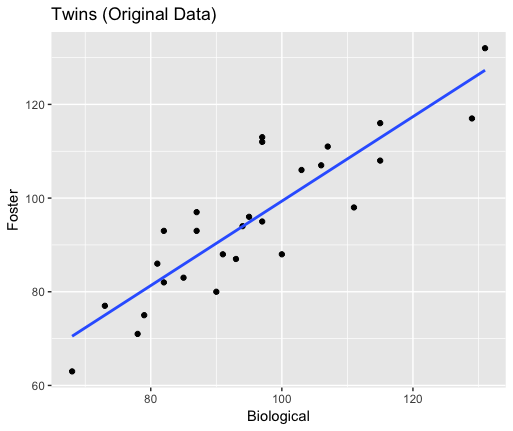
雙胞胎 IQ 的散佈圖。

R 中的線性迴歸推論

雙胞胎資料

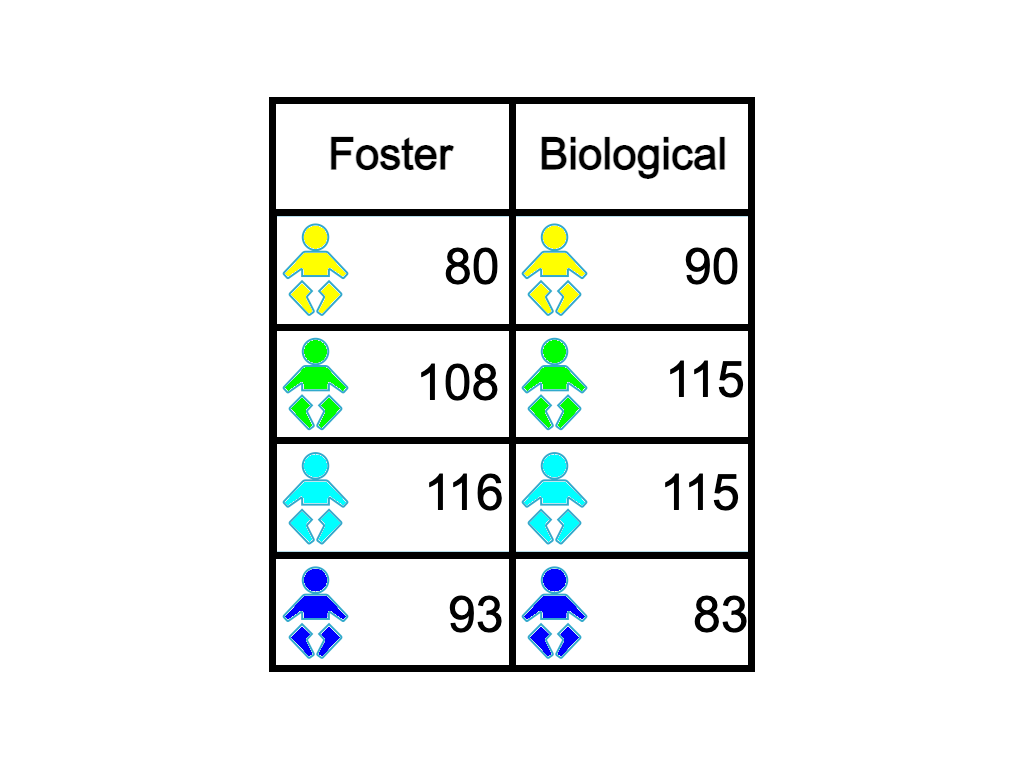
雙胞胎 IQ 的表格。每列對應一對雙胞胎。第一欄是由寄養父母撫養者的 IQ,第二欄是由生父母撫養者的 IQ。

R 中的線性迴歸推論

重排後的雙胞胎資料

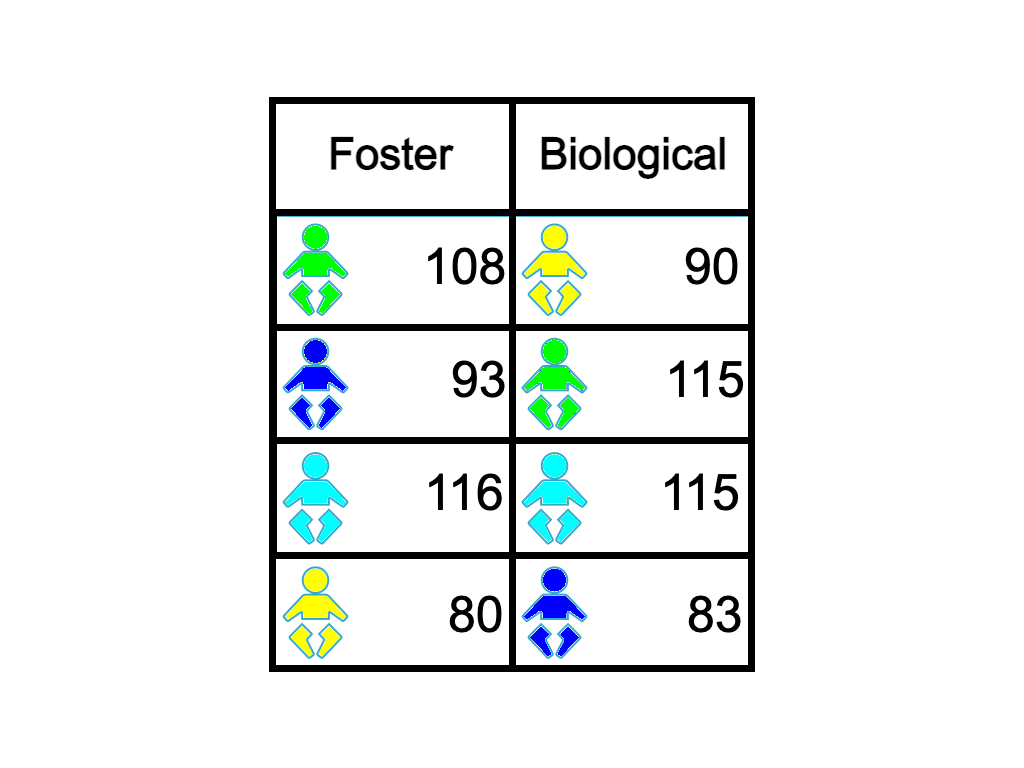
雙胞胎 IQ 表格的每一欄都已個別重排,因此同一對雙胞胎不再出現在同一列。

R 中的線性迴歸推論

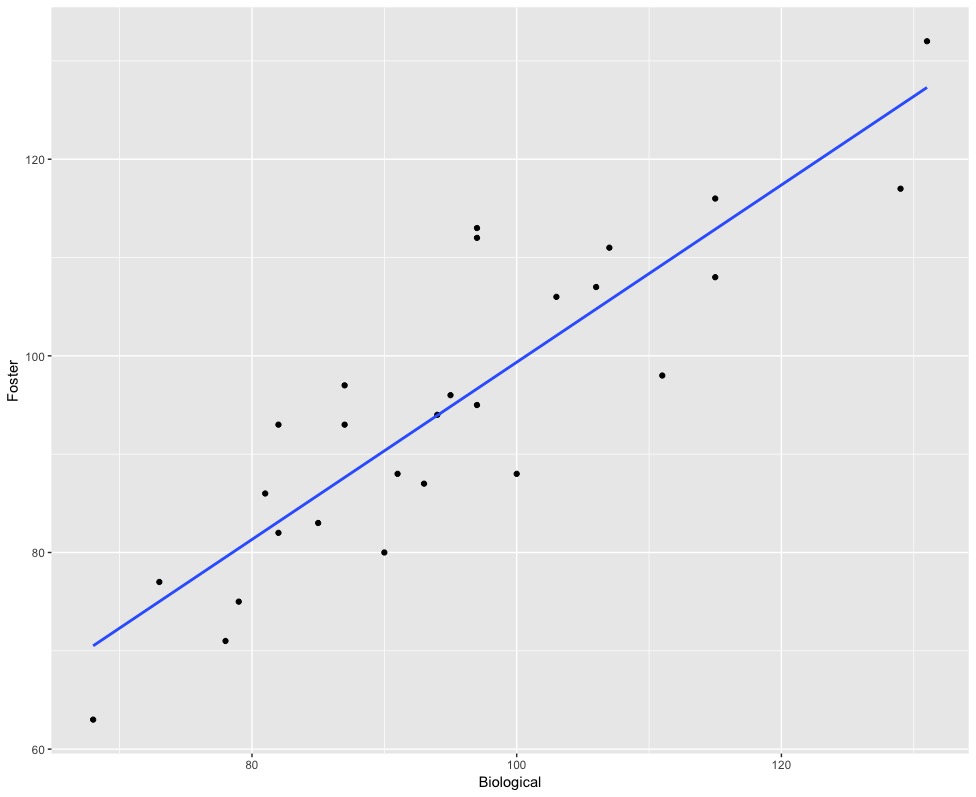
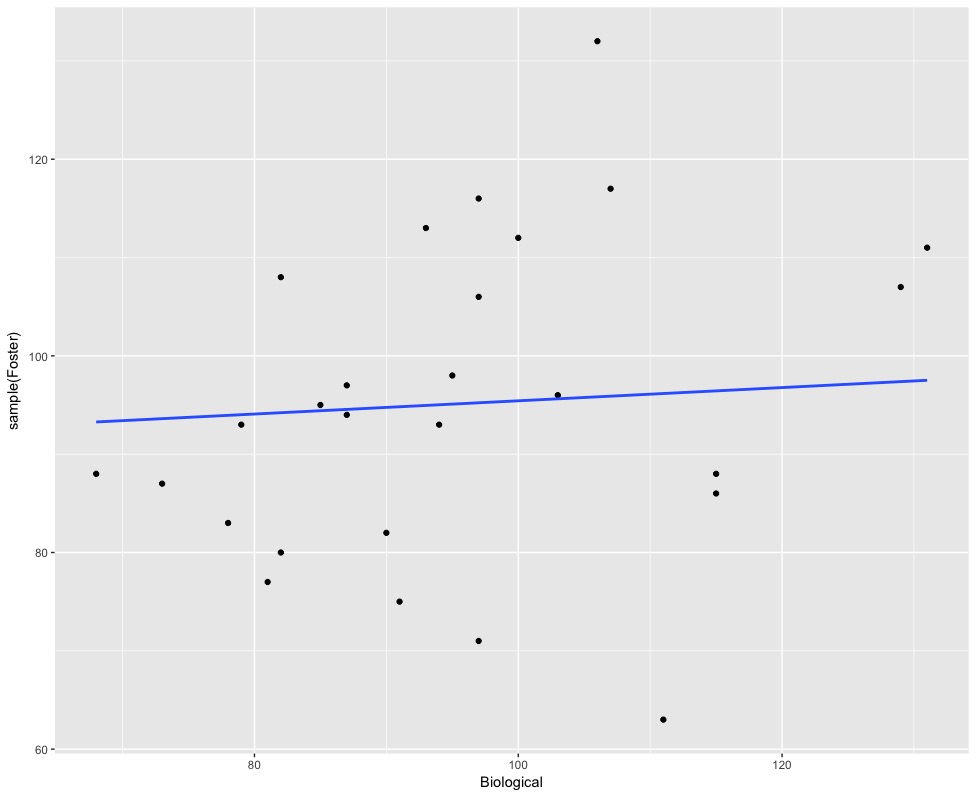
重排資料(1)散佈圖

原始資料

重排資料(1)

R 中的線性迴歸推論

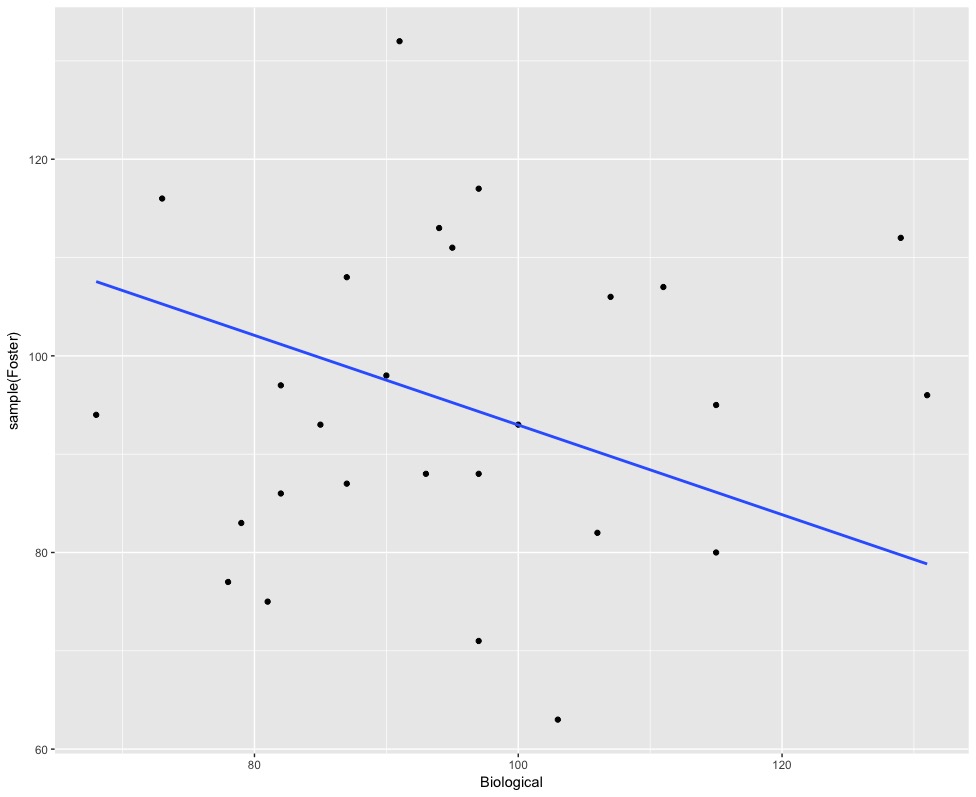
重排資料(2)散佈圖

原始資料

重排資料(2)

R 中的線性迴歸推論

重排資料(1)與(2)

重排資料(1)

重排資料(2)

R 中的線性迴歸推論
twins %>%
   specify(Foster ~ Biological) %>%
   hypothesize(null = "independence") %>%
   generate(reps = 10, type = "permute") %>%
   calculate(stat = "slope")
A tibble: 10 x 2
   replicate          stat
       <int>         <dbl>
 1         1  0.0007709302
 2         2 -0.0353592305
 3         3 -0.0278627974
 4         4 -0.0072547982
 5         5 -0.1252761541
 6         6 -0.1669869287
 7         7 -0.2610519170
 8         8 -0.0157695494
 9         9  0.0581361900
10        10  0.1598471947
R 中的線性迴歸推論

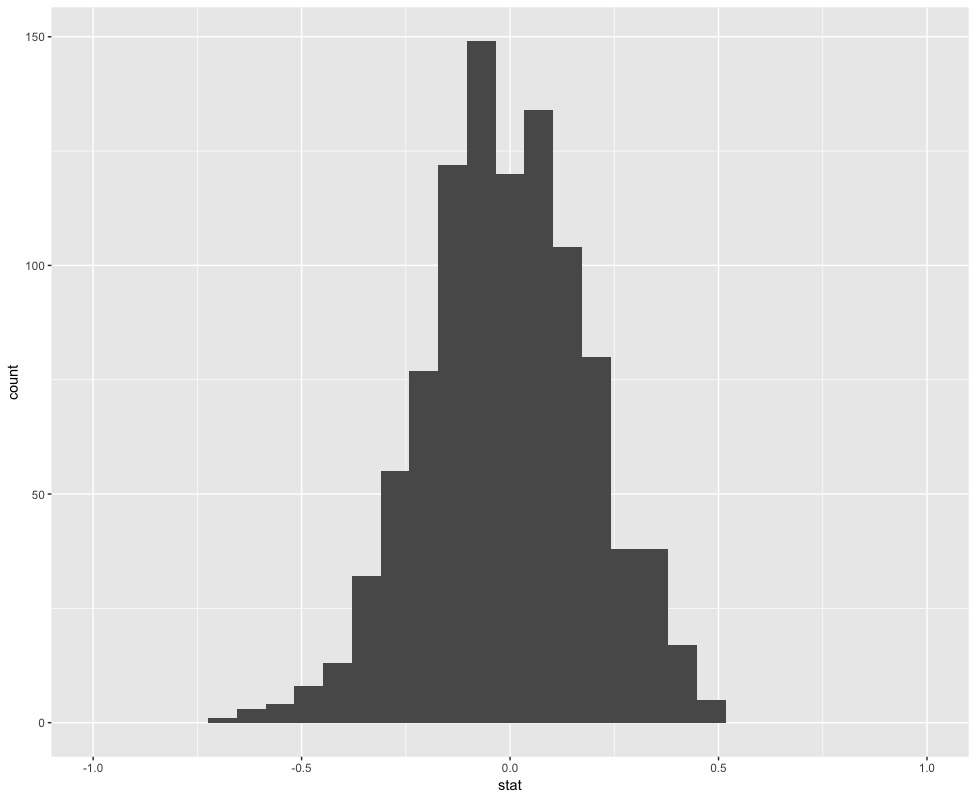
多次重排的斜率

perm_slope <- twins %>%
   specify(Foster ~ Biological) %>%
   hypothesize(
     null = "independence"
     ) %>%
   generate(reps = 1000, 
            type = "permute") %>%
   calculate(stat = "slope") 

ggplot(data = perm_slope, aes(x = stat)) + 
   geom_histogram() +
   xlim(-1,1)

R 中的線性迴歸推論

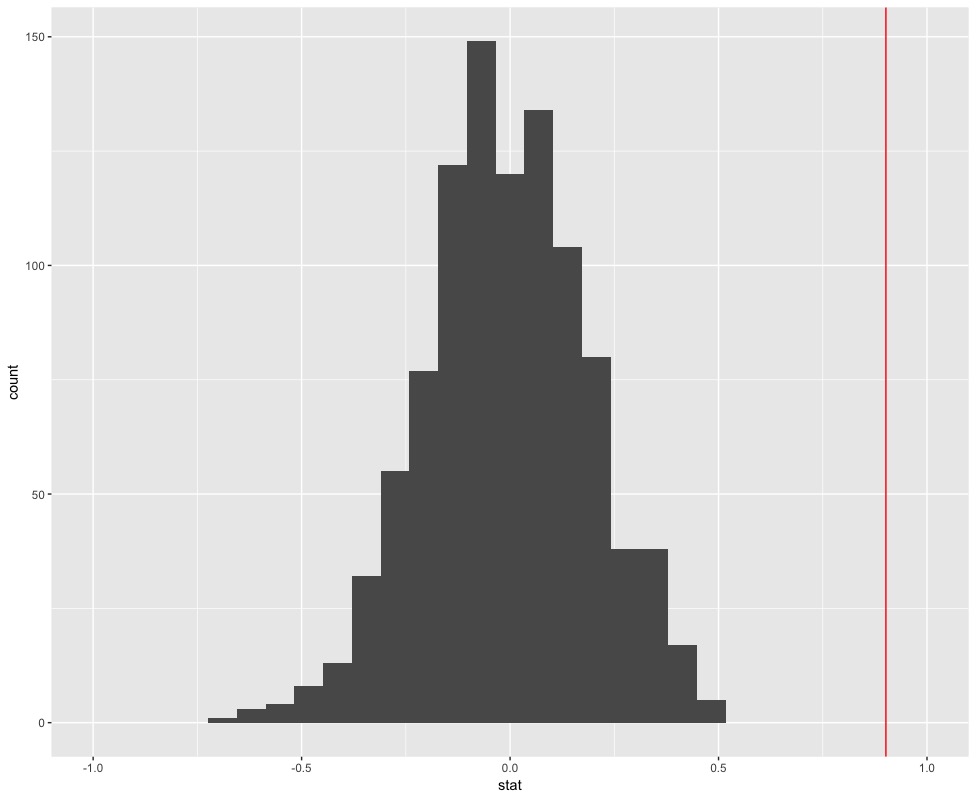
重排斜率與觀察到的斜率(紅色)

obs_slope <- lm(Foster ~ Biological,
                data = twins) %>%
   tidy() %>%   
   filter(term == "Biological") %>%
   select(estimate) %>%   
   pull()
obs_slope
0.901436
ggplot(data = perm_slope, aes(x = stat)) + 
   geom_histogram() +
   geom_vline(xintercept = obs_slope, color = "red") 
   + xlim(-1,1)

R 中的線性迴歸推論

一起來練習吧!

R 中的線性迴歸推論

Preparing Video For Download...